
Houses for sale & to rent in NE38 7PY, Lanercost, Washington Central, Washington
House Prices in NE38 7PY, Lanercost, Washington Central
Properties in NE38 7PY have no sales history available within the last 3 years. NE38 7PY is a postcode in Lanercost located in Washington Central, an area in Washington, Sunderland, with 21 households².
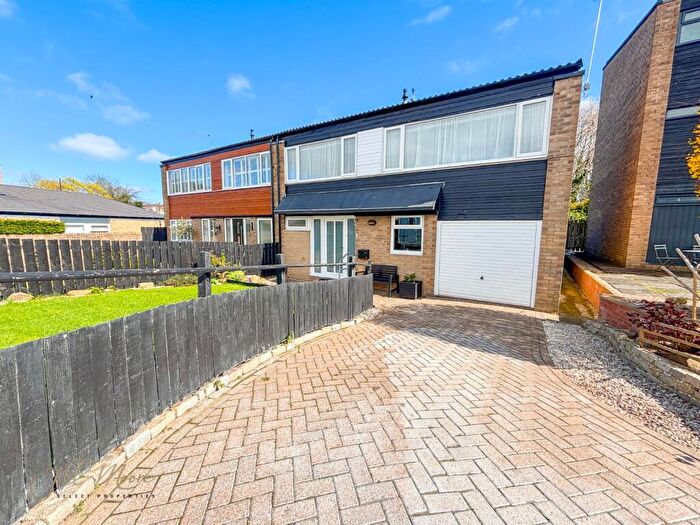
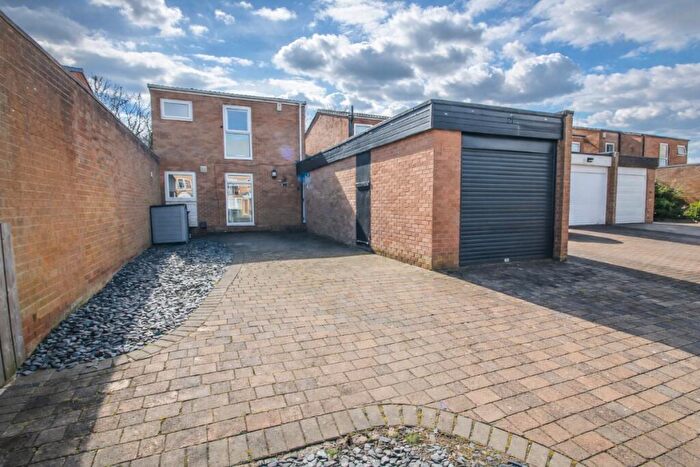
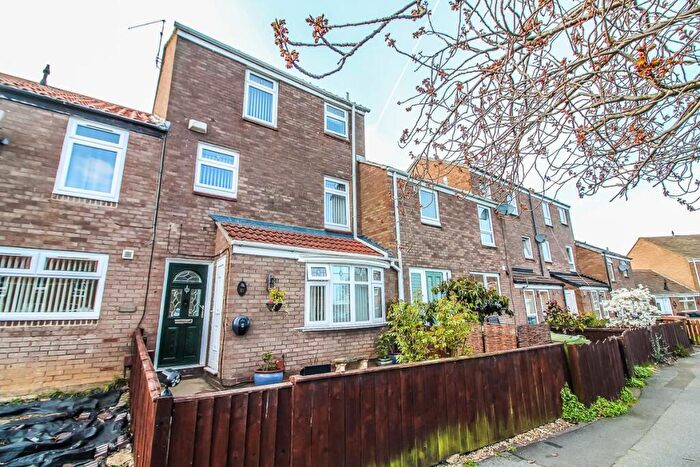
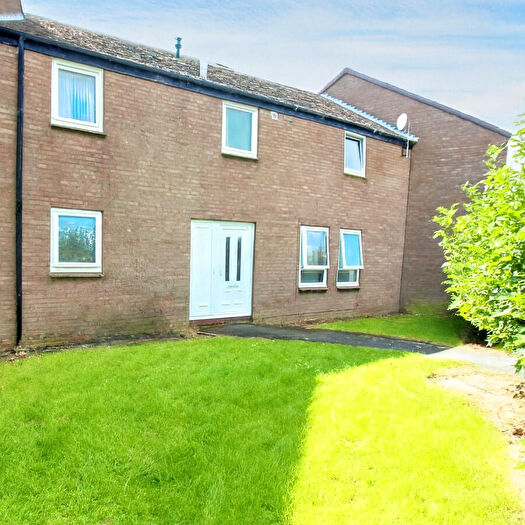
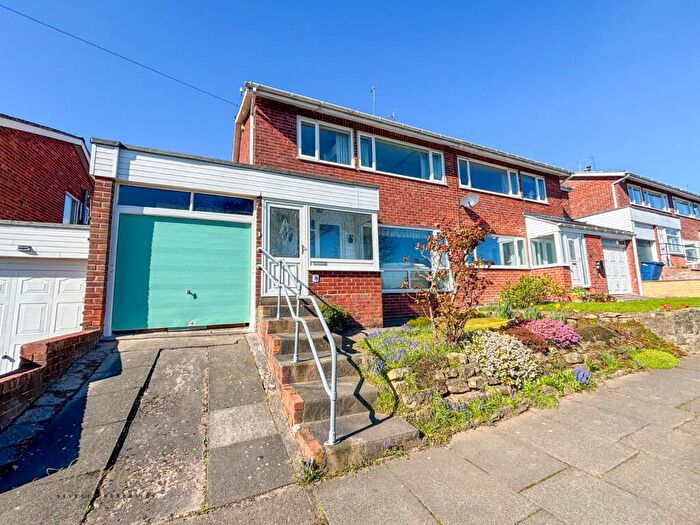
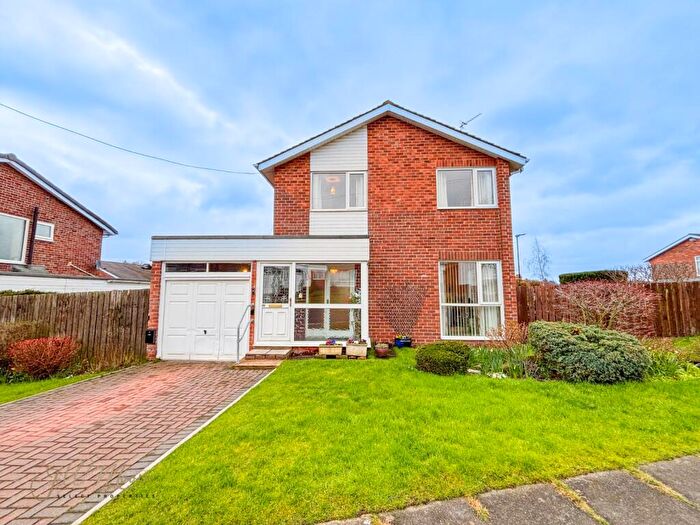
Properties for sale near NE38 7PY, Lanercost
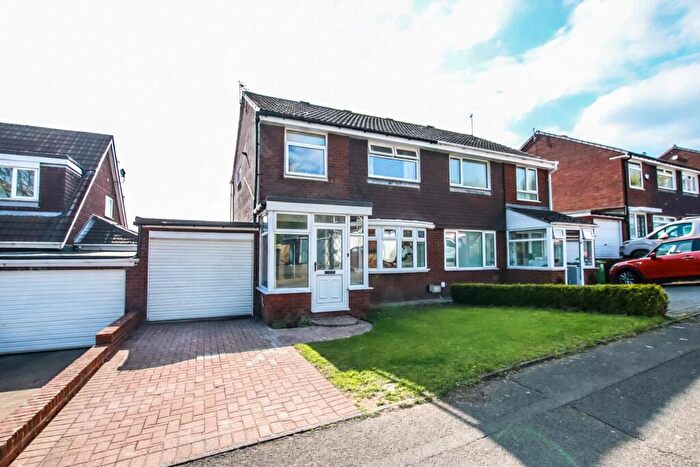
![]()
If you are looking to sell your house, let it out, or receive a property valuation, an expert can help you.
Click the button below to get started.
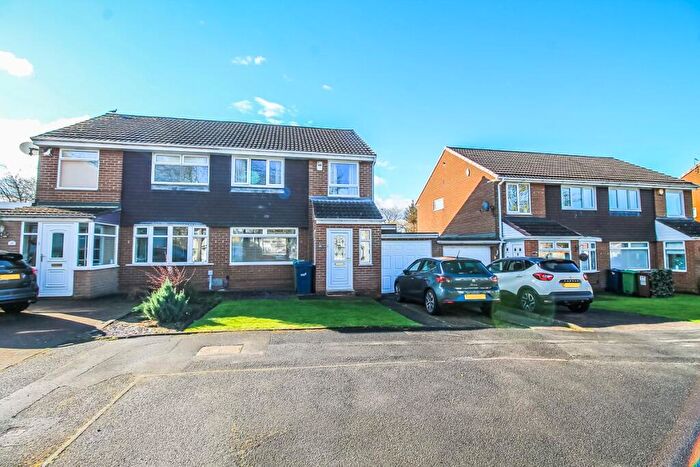
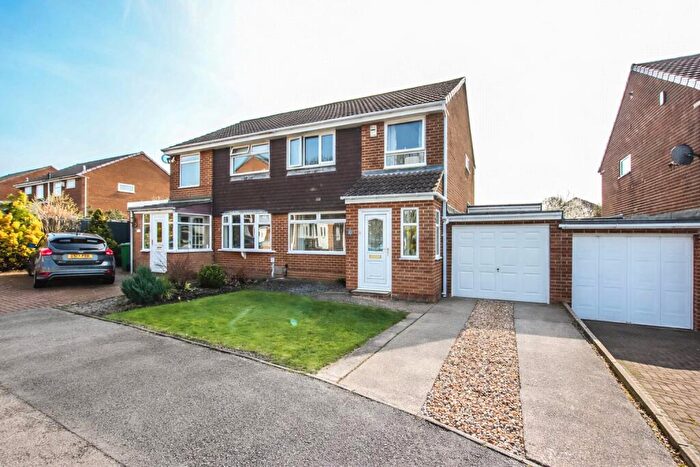
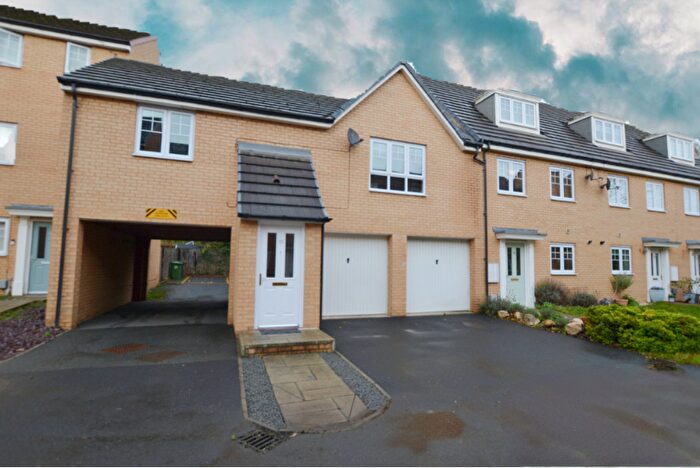
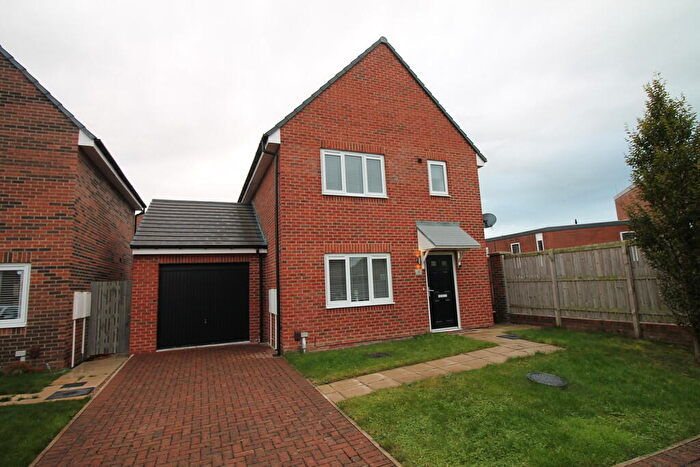
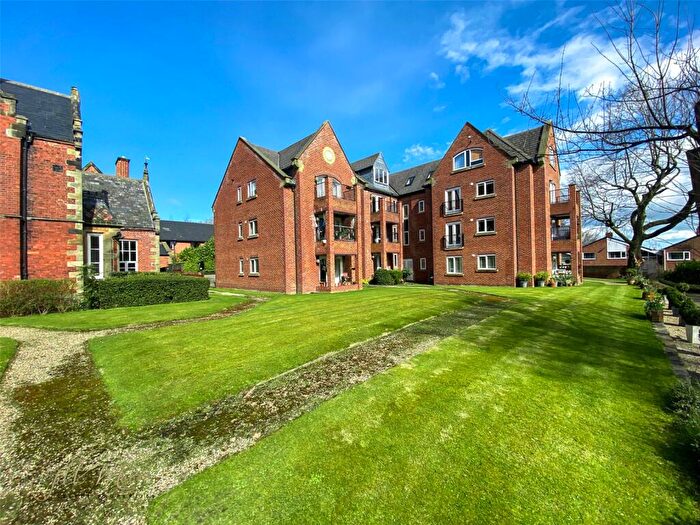
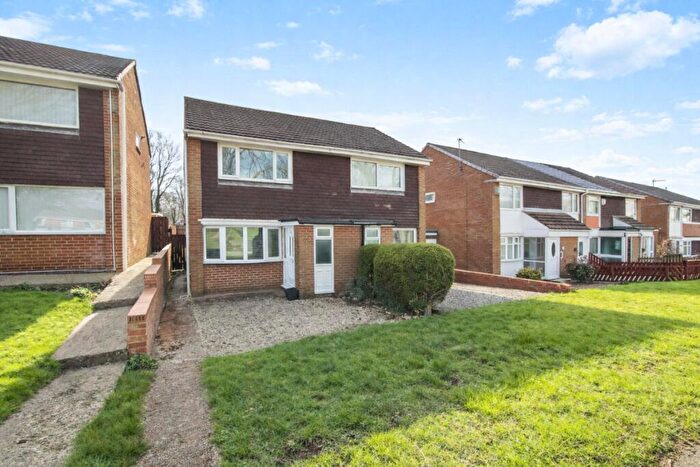
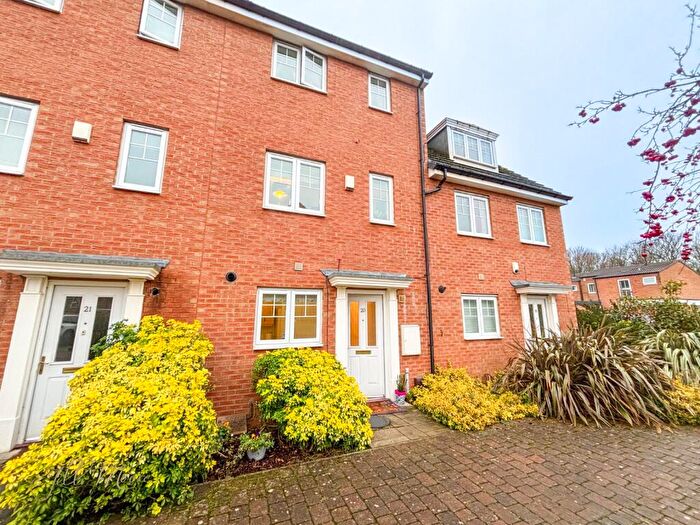
Previously listed properties near NE38 7PY, Lanercost
Price Paid in Lanercost, NE38 7PY, Washington Central
19 Lanercost, NE38 7PY, Washington Central Washington
Property 19 has been sold 1 time. The last time it was sold was in 09/01/2008 and the sold price was £88,000.00.
This terraced house, sold as a freehold on 09/01/2008, is a 115 sqm mid-terrace house with an EPC rating of D.
| Date | Price | Property Type | Tenure | Classification |
|---|---|---|---|---|
| 09/01/2008 | £88,000.00 | Terraced House | freehold | Established Building |
4 Lanercost, NE38 7PY, Washington Central Washington
Property 4 has been sold 2 times. The last time it was sold was in 20/12/2000 and the sold price was £18,000.00.
This is a Terraced House which was sold as a freehold in 20/12/2000
| Date | Price | Property Type | Tenure | Classification |
|---|---|---|---|---|
| 20/12/2000 | £18,000.00 | Terraced House | freehold | Established Building |
| 15/09/1997 | £24,000.00 | Terraced House | freehold | Established Building |
Postcodes in Lanercost, Washington Central
Navigate through other locations in Lanercost, Washington Central, Washington to see more property listings for sale or to rent.
Transport near NE38 7PY, Lanercost
-
 Heworth Station
 -
Chester-Le-Street Station
-
Sunderland Station
-
Dunston Station
-
Manors Station
-
Newcastle Station
-
MetroCentre Station
-
Seaham Station
-
Durham Station
-
Blaydon Station
House price paid reports for NE38 7PY, Lanercost
Click on the buttons below to see price paid reports by year or property price:
- Price Paid By Year
Property Price Paid in NE38 7PY, Lanercost by Year
The average sold property price by year was:
| Year | Average Sold Price | Price Change |
Sold Properties
|
|---|---|---|---|
| 2008 | £88,000 | 80% |
1 Property |
| 2000 | £18,000 | -33% |
1 Property |
| 1997 | £24,000 | - |
1 Property |