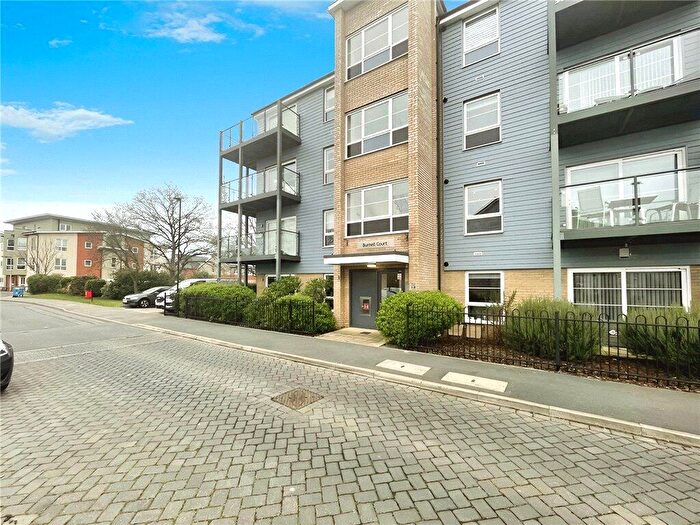
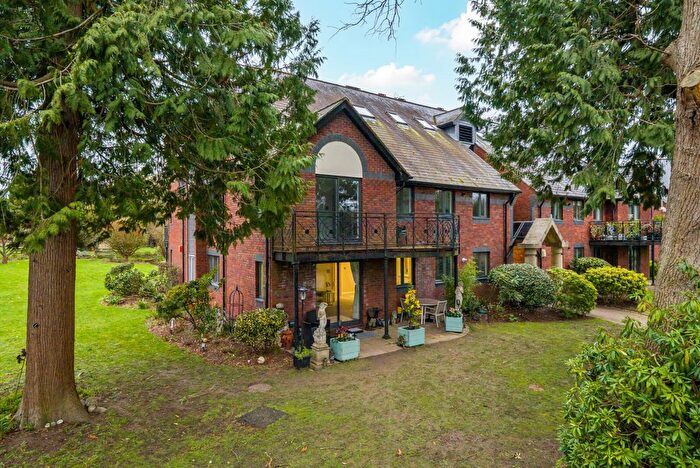
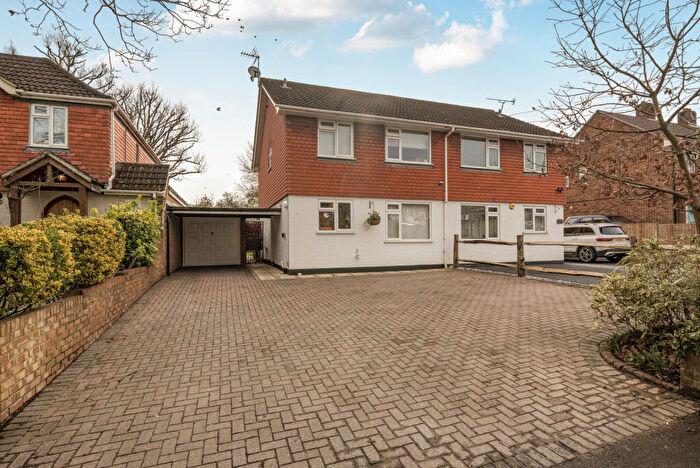
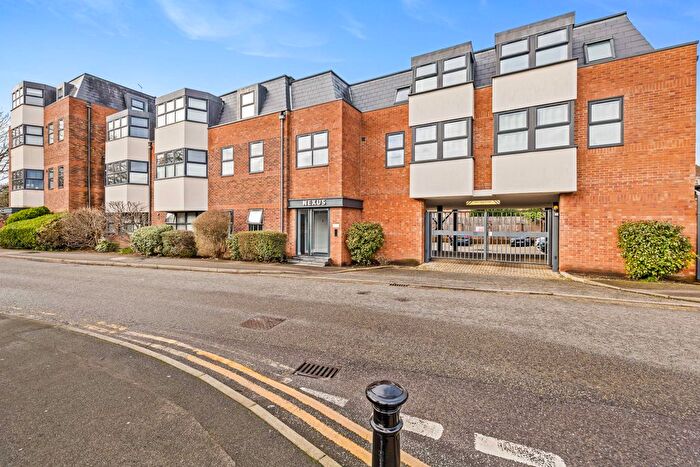
Houses for sale & to rent in Chertsey, Surrey
House Prices in Chertsey
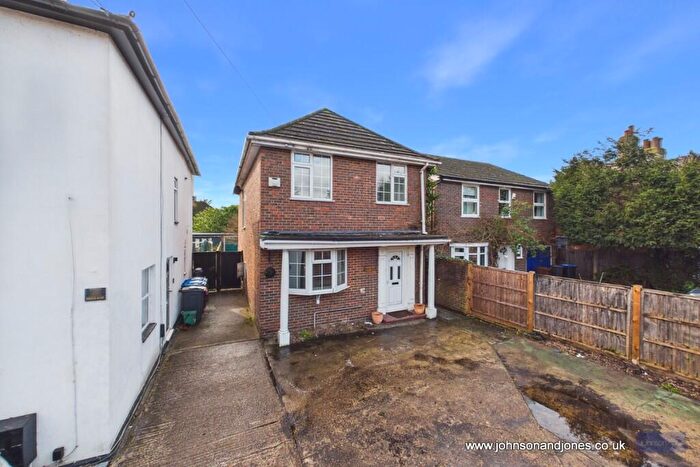
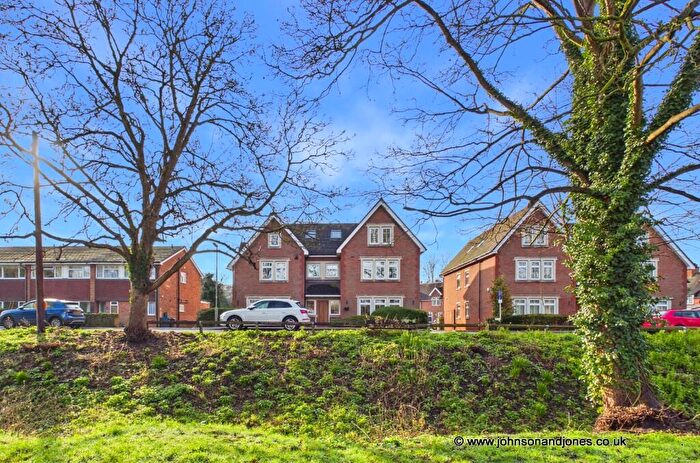
Properties in Chertsey have an average house price of £473,032.00 and had 825 Property Transactions within the last 3 years.¹
Chertsey is an area in Surrey with 7,706 households², where the most expensive property was sold for £2,525,000.00.
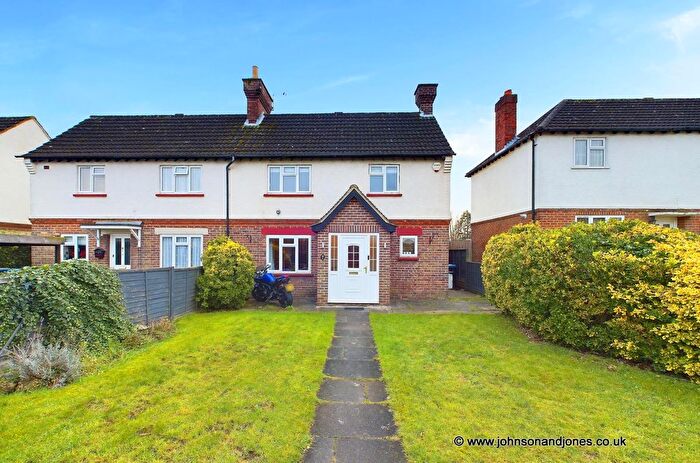
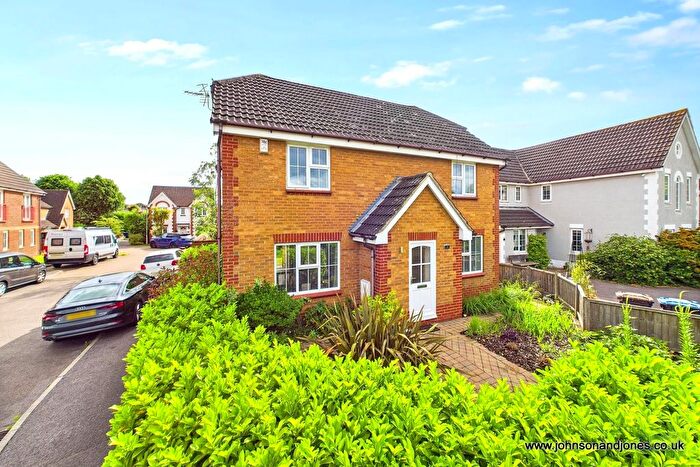
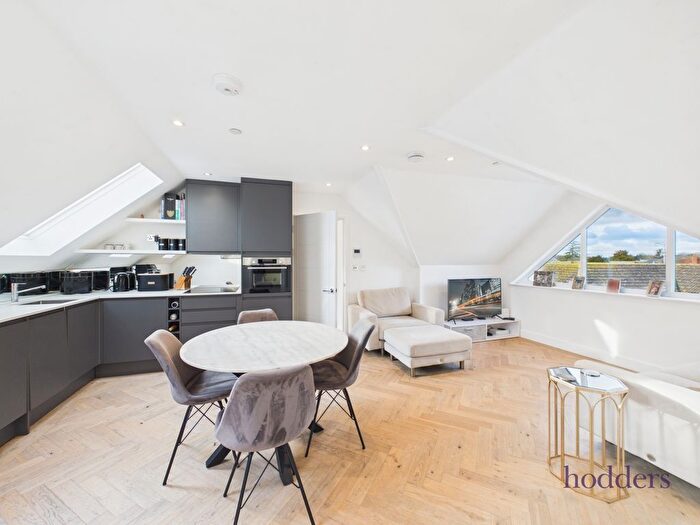
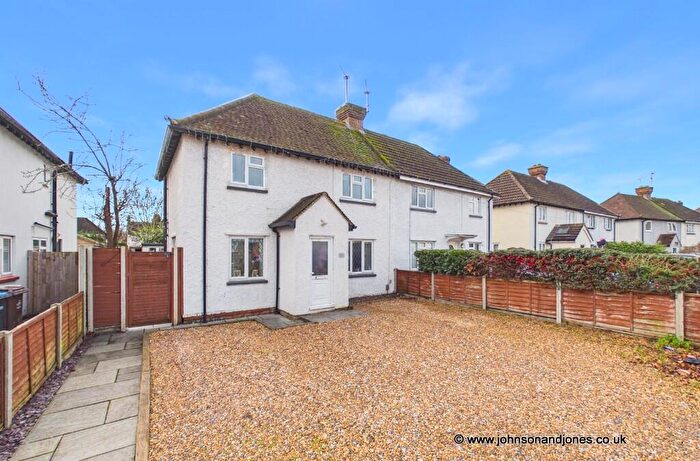
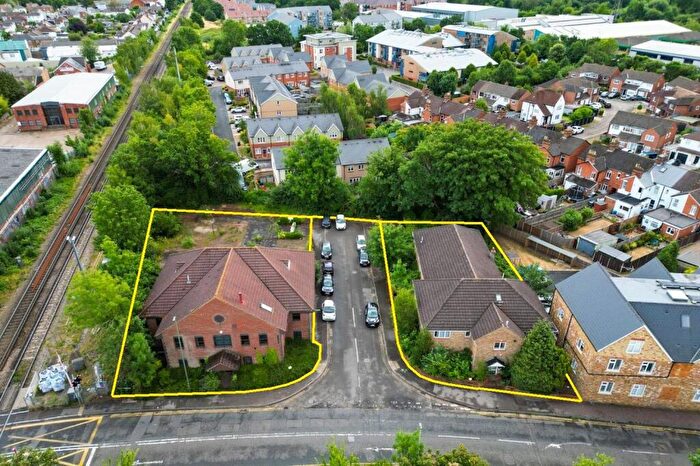
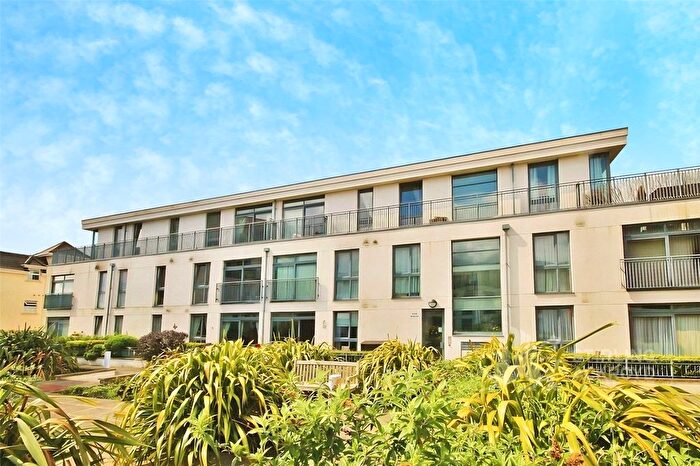
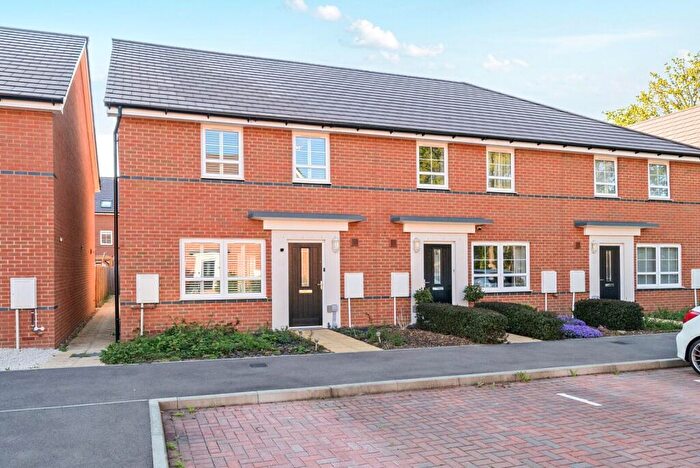
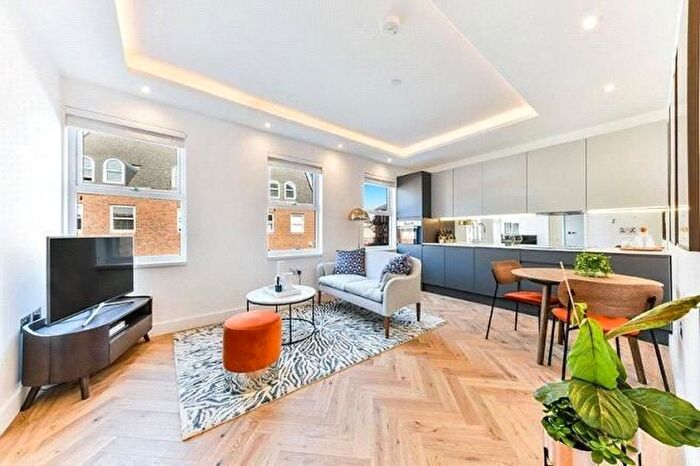
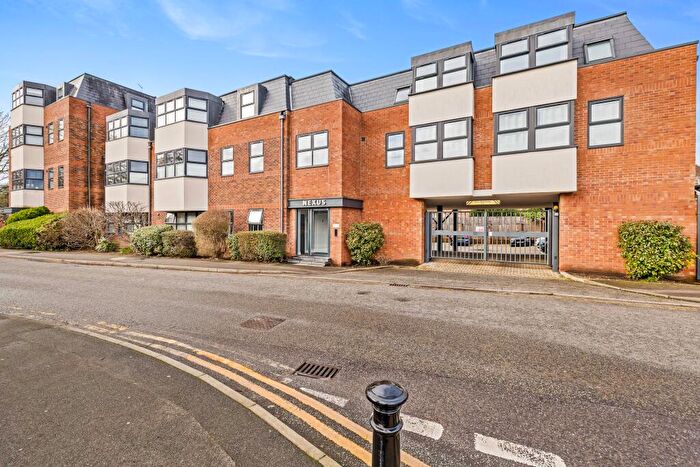
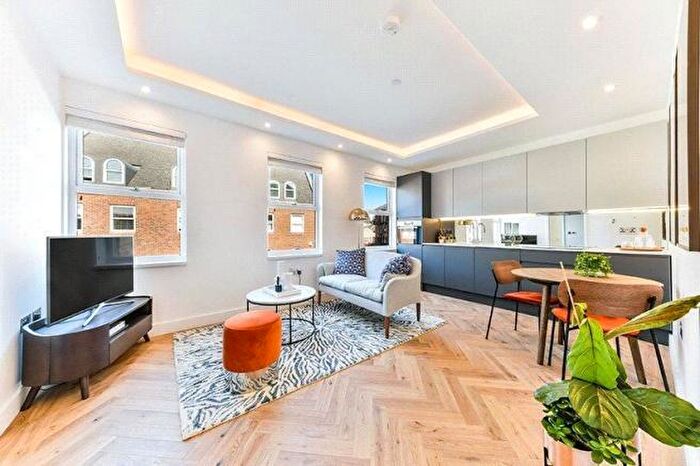
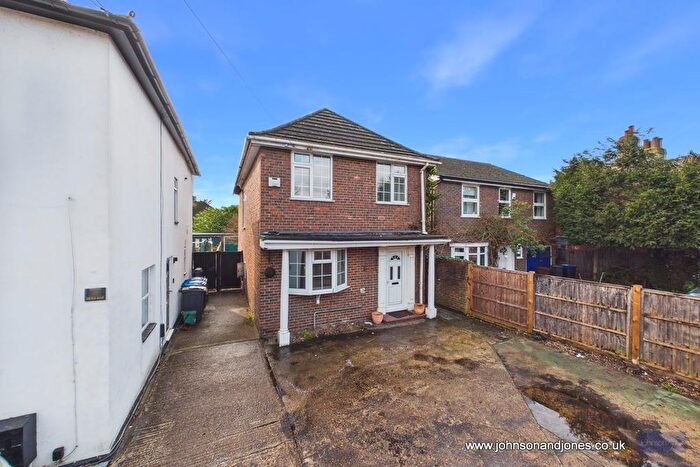
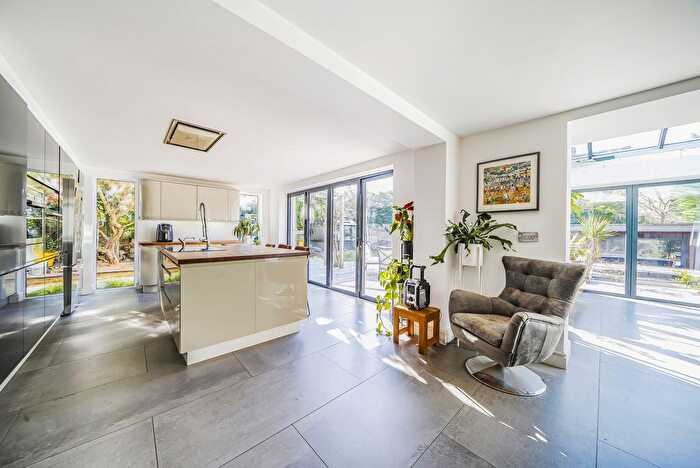
Properties for sale in Chertsey
Neighbourhoods in Chertsey
Navigate through our locations to find the location of your next house in Chertsey, Surrey for sale or to rent.
Transport in Chertsey
Please see below transportation links in this area:
-
Chertsey Station
-
Addlestone Station
-
Virginia Water Station
-
Byfleet and New Haw Station
-
Weybridge Station
-
West Byfleet Station
- FAQ
- Price Paid By Year
- Property Type Price
Frequently asked questions about Chertsey
What is the average price for a property for sale in Chertsey?
The average price for a property for sale in Chertsey is £473,032. This amount is 22% lower than the average price in Surrey. There are more than 10,000 property listings for sale in Chertsey.
What locations have the most expensive properties for sale in Chertsey?
The locations with the most expensive properties for sale in Chertsey are Longcross, Lyne & Chertsey South at an average of £936,833, Chertsey South And Row Town at an average of £621,384 and Foxhills at an average of £618,275.
What locations have the most affordable properties for sale in Chertsey?
The locations with the most affordable properties for sale in Chertsey are Chertsey Riverside at an average of £318,989, Chertsey St Anns at an average of £431,636 and Chertsey Meads at an average of £438,278.
Which train stations are available in or near Chertsey?
Some of the train stations available in or near Chertsey are Chertsey, Addlestone and Virginia Water.
Property Price Paid in Chertsey by Year
The average sold property price by year was:
| Year | Average Sold Price | Price Change |
Sold Properties
|
|---|---|---|---|
| 2025 | £483,769 | -1% |
232 Properties |
| 2024 | £486,598 | 7% |
304 Properties |
| 2023 | £450,143 | -6% |
289 Properties |
| 2022 | £478,148 | 3% |
320 Properties |
| 2021 | £465,021 | 5% |
468 Properties |
| 2020 | £441,106 | 1% |
295 Properties |
| 2019 | £436,285 | -4% |
355 Properties |
| 2018 | £455,048 | 7% |
429 Properties |
| 2017 | £420,995 | 2% |
341 Properties |
| 2016 | £414,186 | 10% |
363 Properties |
| 2015 | £371,756 | 2% |
430 Properties |
| 2014 | £362,890 | 12% |
365 Properties |
| 2013 | £318,261 | 3% |
316 Properties |
| 2012 | £307,491 | -1% |
243 Properties |
| 2011 | £309,533 | -1% |
298 Properties |
| 2010 | £312,596 | 12% |
270 Properties |
| 2009 | £275,761 | -8% |
241 Properties |
| 2008 | £298,556 | -4% |
241 Properties |
| 2007 | £310,210 | 14% |
452 Properties |
| 2006 | £267,820 | 6% |
516 Properties |
| 2005 | £250,766 | -3% |
435 Properties |
| 2004 | £258,672 | 8% |
392 Properties |
| 2003 | £237,989 | 4% |
393 Properties |
| 2002 | £228,361 | 17% |
450 Properties |
| 2001 | £189,174 | 12% |
401 Properties |
| 2000 | £167,138 | 10% |
302 Properties |
| 1999 | £150,185 | 16% |
393 Properties |
| 1998 | £126,387 | 4% |
379 Properties |
| 1997 | £121,803 | 8% |
470 Properties |
| 1996 | £111,549 | 8% |
427 Properties |
| 1995 | £102,697 | - |
293 Properties |
Property Price per Property Type in Chertsey
Here you can find historic sold price data in order to help with your property search.
The average Property Paid Price for specific property types in the last three years are:
| Property Type | Average Sold Price | Sold Properties |
|---|---|---|
| Semi Detached House | £510,461.00 | 181 Semi Detached Houses |
| Detached House | £799,668.00 | 176 Detached Houses |
| Terraced House | £410,087.00 | 185 Terraced Houses |
| Flat | £287,104.00 | 283 Flats |

