
Houses for sale in Surrey, England
House Prices in Surrey
Properties in Surrey have
an average house price of
£609k
and had 56,080 Property Transactions
within the last 3 years.¹
Surrey is a location in
England with
535,977 households², where the most expensive property was sold for £34M.
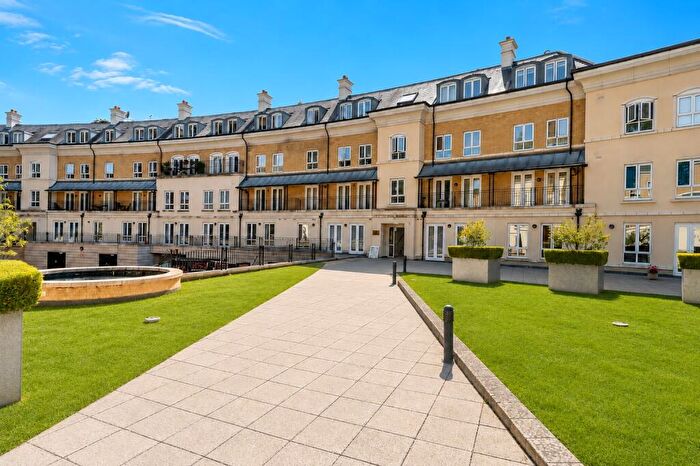
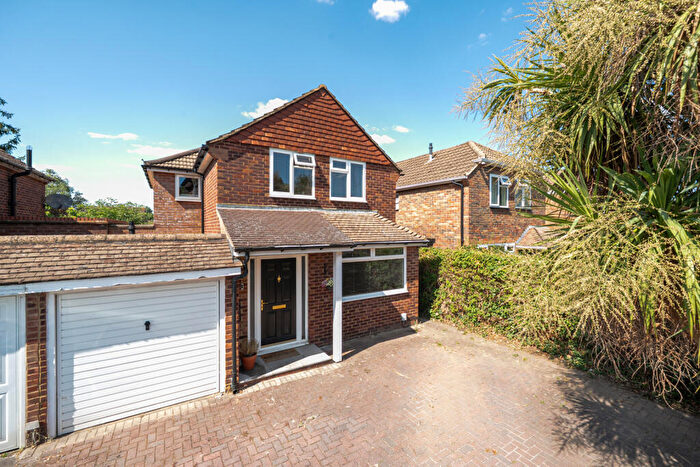
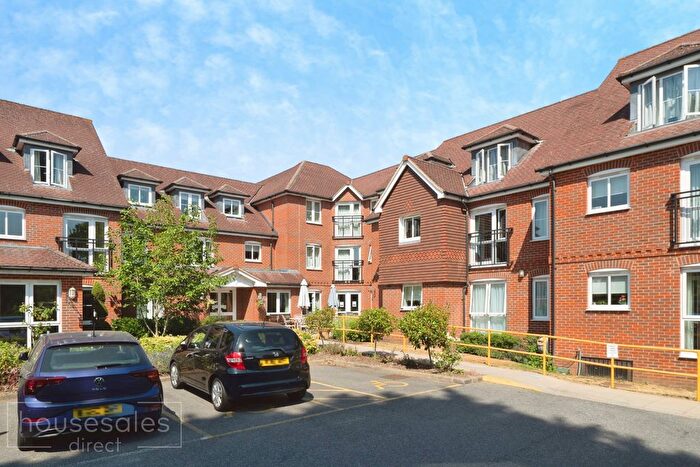
Properties for sale in Surrey
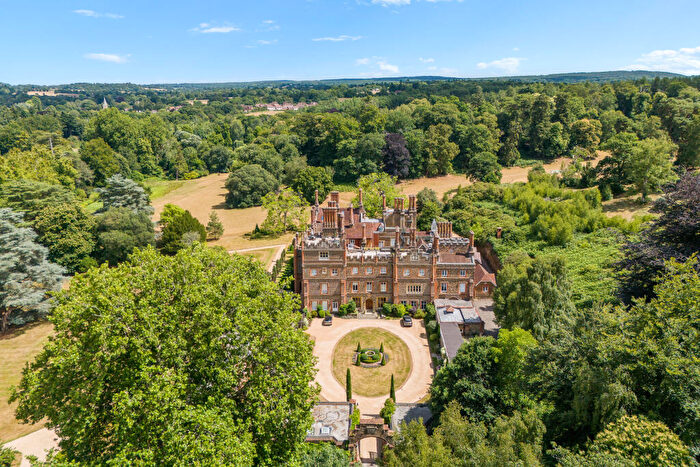
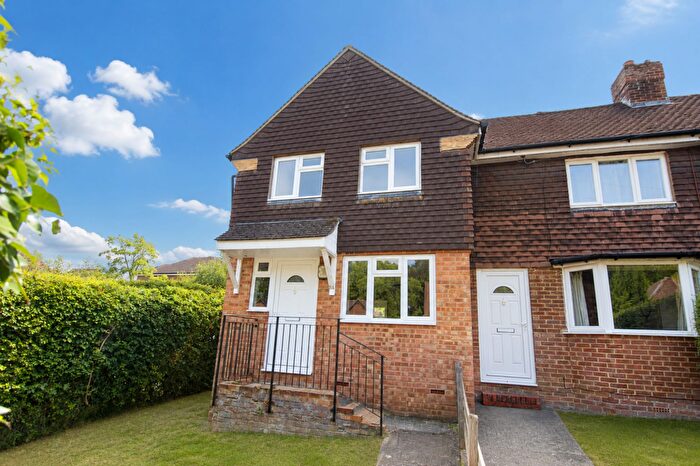
![]()
If you are looking to sell your house, let it out, or receive a property valuation, an expert can help you.
Click the button below to get started.


Towns in Surrey
Navigate through our locations to find the location of your next house in Surrey, England for sale or to rent.
- Hounslow
- Chertsey
- Windlesham
- Liss
- West Molesey
- Sunbury-on-thames
- Carshalton
- Oxted
- Cobham
- Lightwater
- Weybridge
- Banstead
- Reigate
- Virginia Water
- Petersfield
- Walton-on-thames
- Liphook
- Chichester
- Kenley
- Whyteleafe
- Hindhead
- Haslemere
- Billingshurst
- Ashford
- Horley
- Emsworth
- Warlingham
- Lingfield
- West Byfleet
- Edenbridge
- Epsom
- Chessington
- Guildford
- Staines
- Redhill
- Rowlands Castle
- Esher
- Aldershot
- Egham
- Westerham
- Windsor
- Crawley
- Bagshot
- Sutton
- East Molesey
- Leatherhead
- Betchworth
- Woking
- East Grinstead
- Coulsdon
- Shepperton
- Worcester Park
- Dorking
- Camberley
- Gatwick
- Feltham
- Addlestone
- Cranleigh
- Thames Ditton
- Farnham
- Ascot
- Caterham
- Surbiton
- Horsham
- Midhurst
- Pulborough
- Staines-upon-thames
- Godalming
- Tadworth
- Godstone
- Ashtead
- Petworth
Property price trends in Surrey
According to the latest Land Registry data, the average home in Surrey sold for £542,772 in 2026. That figure comes from a substantial record of 742,673 sales logged over the past 31 years.
Prices have fallen back over the last three years. Compared with 2023, when the typical sale came in around £623,571, that's a fall of roughly 13%.
Looking back five years, average prices are down about 8.8% since 2021, a drop of around £52,293 in cash terms.
Zoom out to the past decade for the fuller picture. Back in 2016, homes here averaged £496,868, so the typical sold price has climbed about 9.2% since then, roughly 0.9% a year. Stretch the view to fifteen years and that annual pace edges up closer to 2.2%.
Frequently asked questions about Surrey
What is the average price for a property for sale in Surrey?
The average price for a property for sale in Surrey is £609,282. This amount is 70% higher than the average price in England. There are more than 10,000 property listings for sale in Surrey.
What locations have the most expensive properties for sale in Surrey?
The locations with the most expensive properties for sale in Surrey are Ascot at an average of £5,143,750, Virginia Water at an average of £1,572,649 and Liphook at an average of £1,335,792.
What locations have the most affordable properties for sale in Surrey?
The locations with the most affordable properties for sale in Surrey are Whyteleafe at an average of £329,613, Staines-upon-thames at an average of £411,040 and Aldershot at an average of £415,194.
Which train stations are available in or near Surrey?
Some of the train stations available in or near Surrey are Clandon, Gomshall and Chilworth.
Property Price Paid in Surrey by Year
The average sold property price by year was:
| Year | Average Sold Price | Price Change |
Sold Properties
|
|---|---|---|---|
| 2026 | £542,772 | -12% |
3,242 Properties |
| 2025 | £608,837 | - |
18,193 Properties |
| 2024 | £608,700 | -2% |
18,247 Properties |
| 2023 | £623,571 | -1% |
16,398 Properties |
| 2022 | £632,791 | 6% |
21,906 Properties |
| 2021 | £595,065 | 4% |
28,088 Properties |
| 2020 | £571,134 | 8% |
19,258 Properties |
| 2019 | £523,434 | 0,4% |
20,336 Properties |
| 2018 | £521,340 | 0,1% |
20,658 Properties |
| 2017 | £520,978 | 5% |
21,569 Properties |
Property Price per Property Type in Surrey
Here you can find historic sold price data in order to help with your property search.
The average Property Paid Price for specific property types in the last three years are:
| Property Type | Average Sold Price | Sold Properties |
|---|---|---|
| Semi Detached House | £554,449.00 | 15,292 Semi Detached Houses |
| Terraced House | £459,361.00 | 10,637 Terraced Houses |
| Detached House | £1,015,279.00 | 16,493 Detached Houses |
| Flat | £297,163.00 | 13,658 Flats |
Transport in Surrey
Please see below transportation links in this area:
