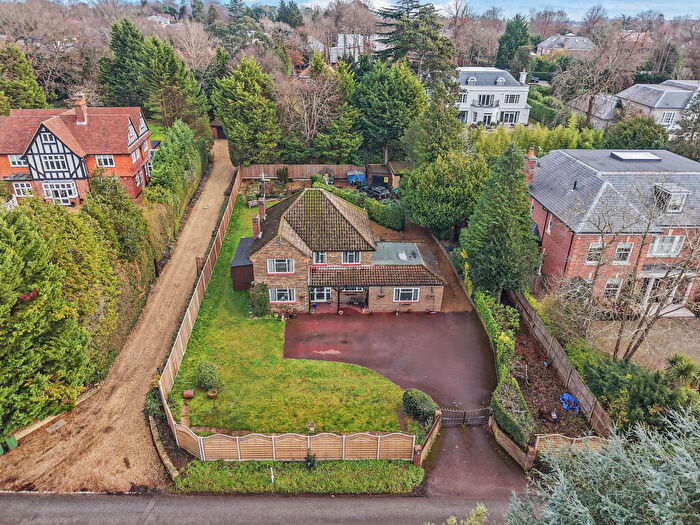
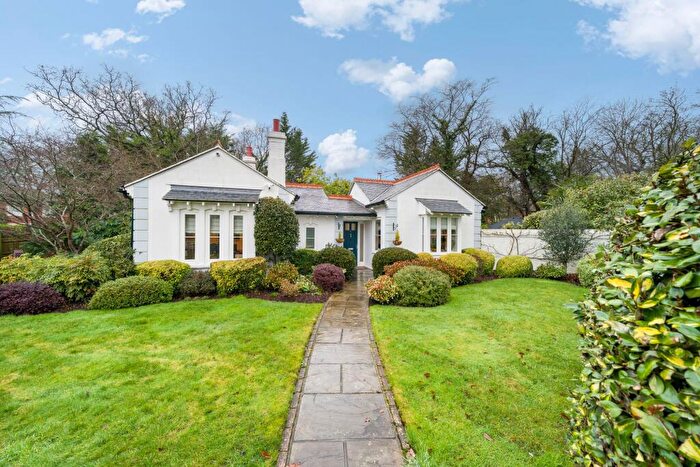
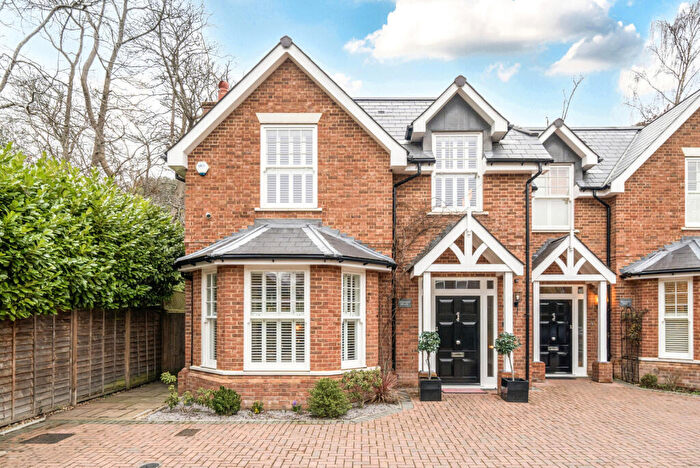
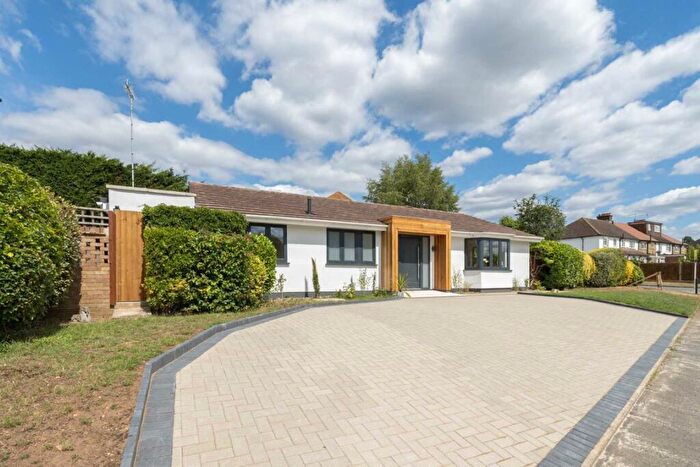
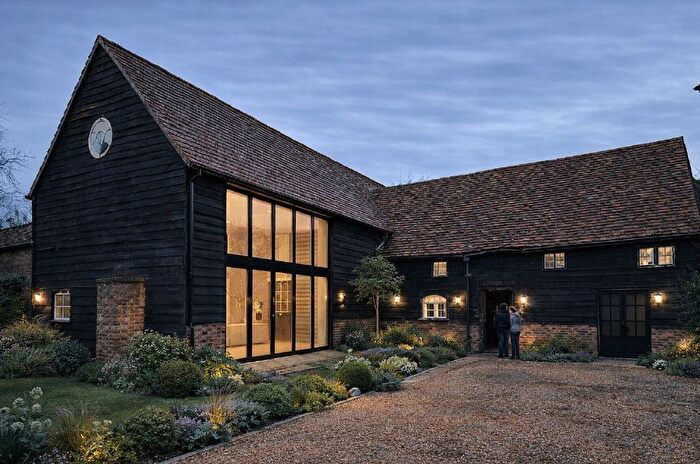
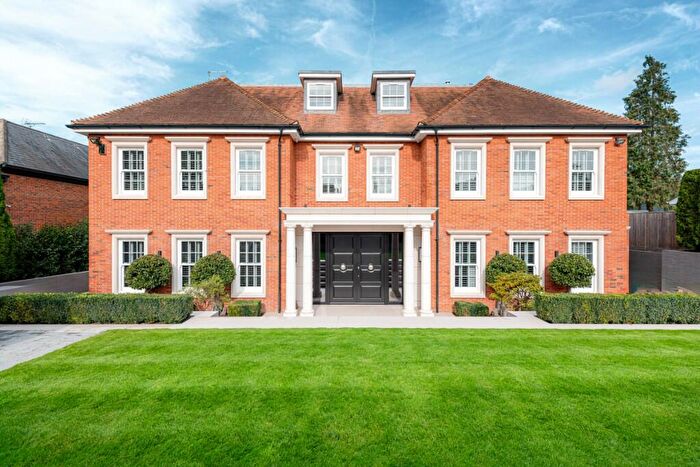
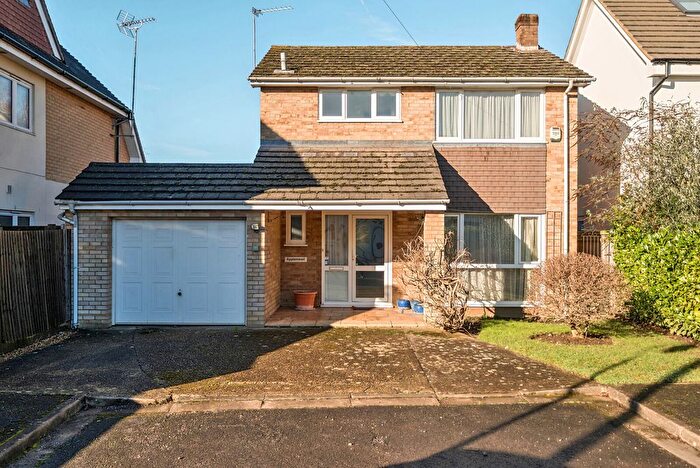
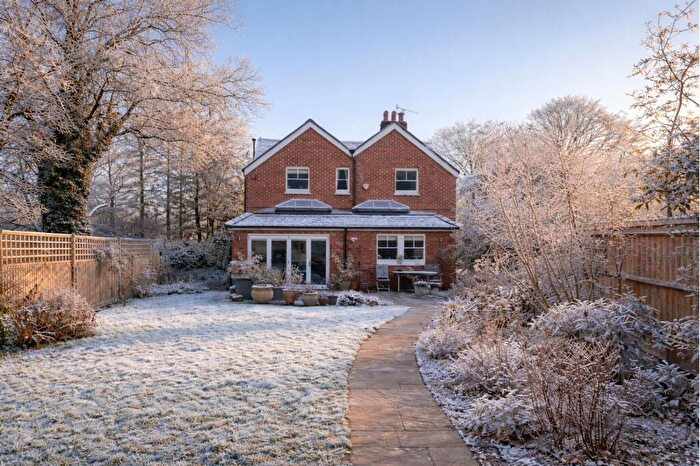
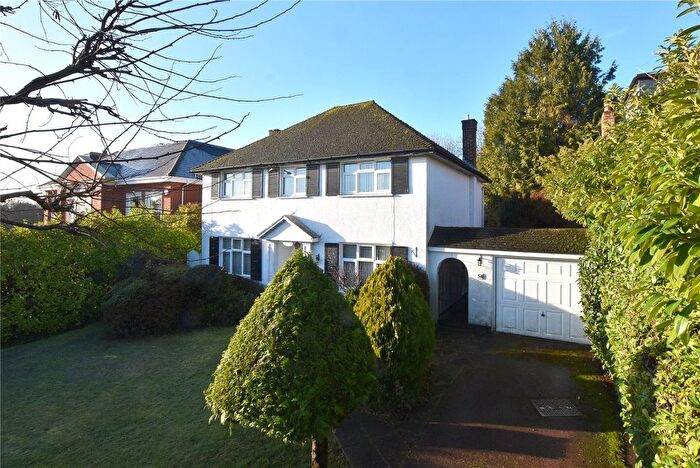
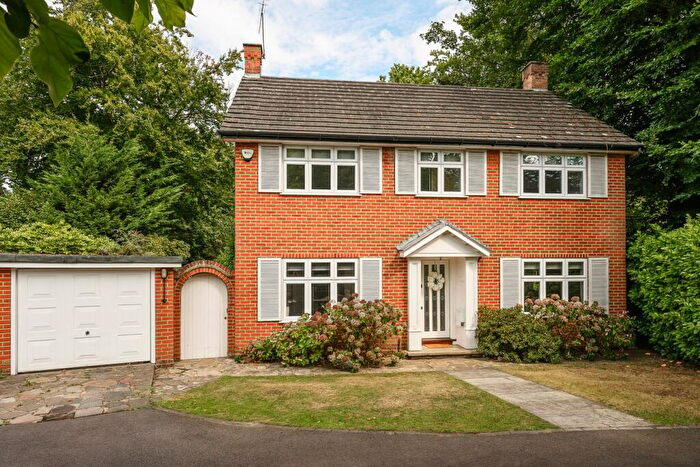
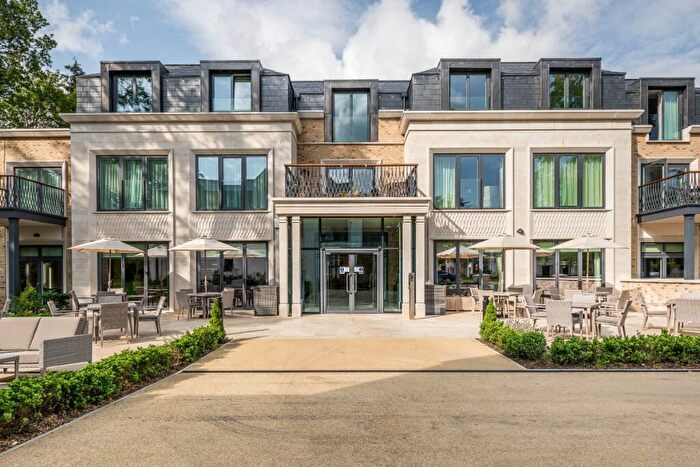
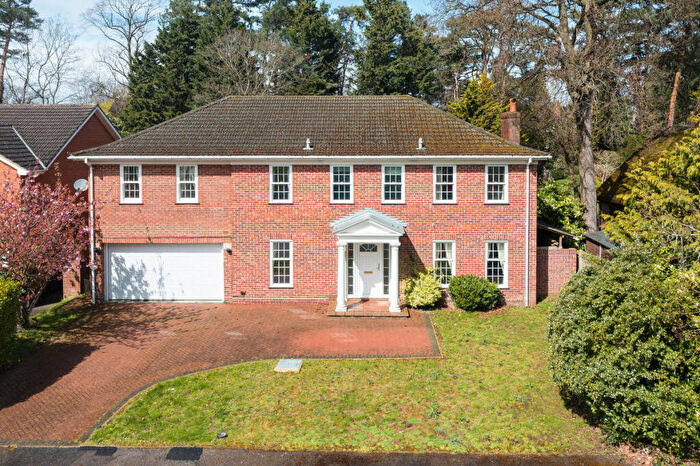
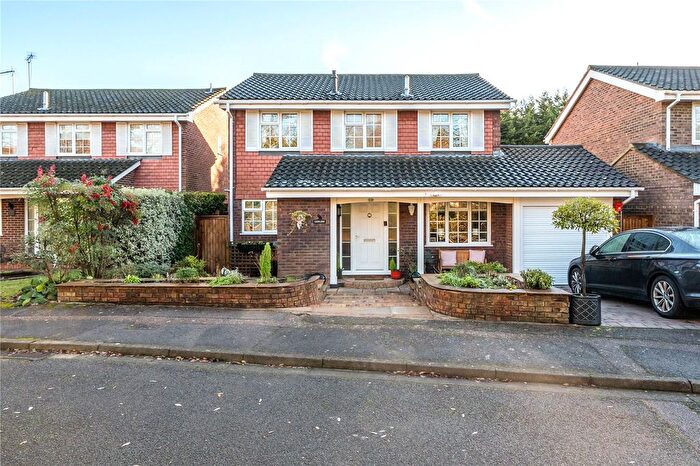
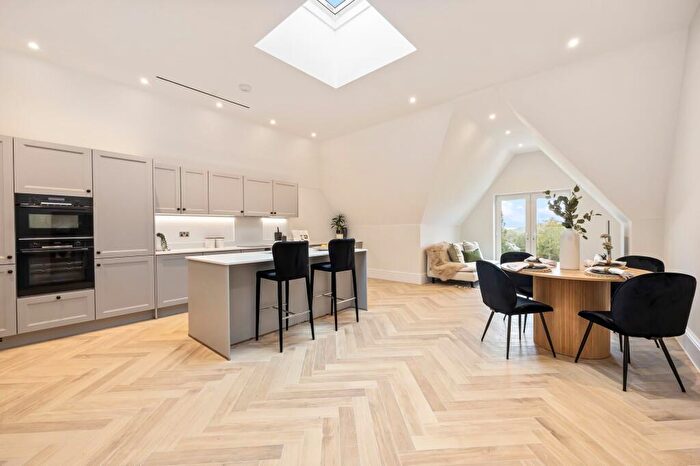
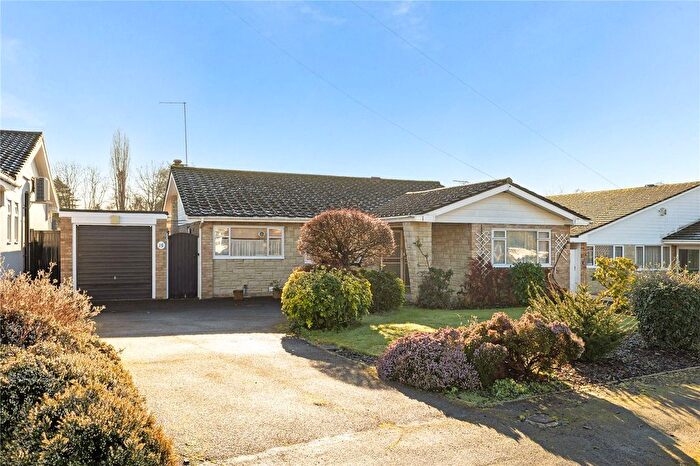
Houses for sale & to rent in Oxshott And Stoke Dabernon, Cobham
House Prices in Oxshott And Stoke Dabernon
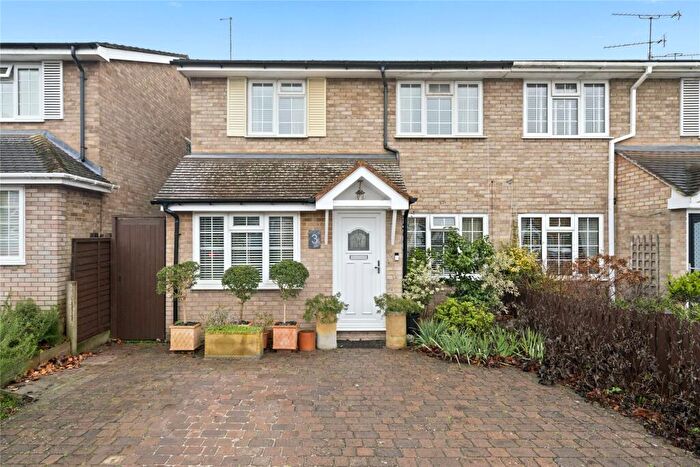
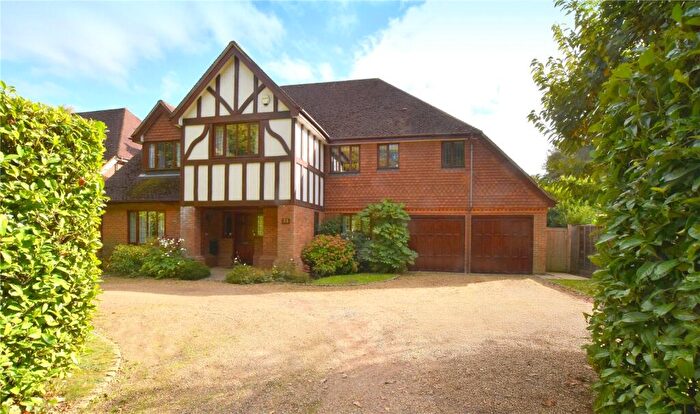
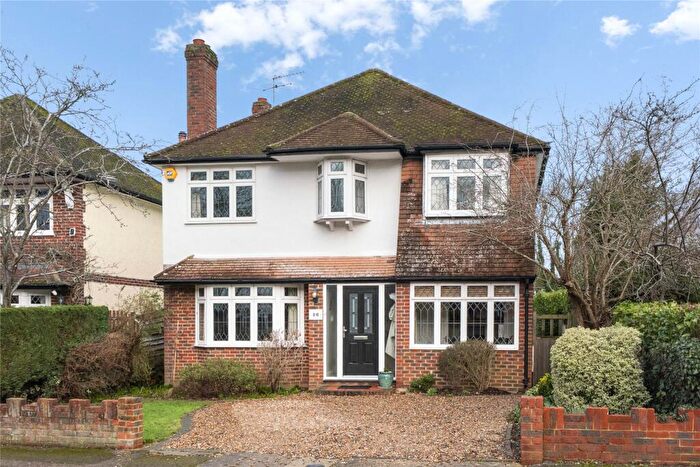
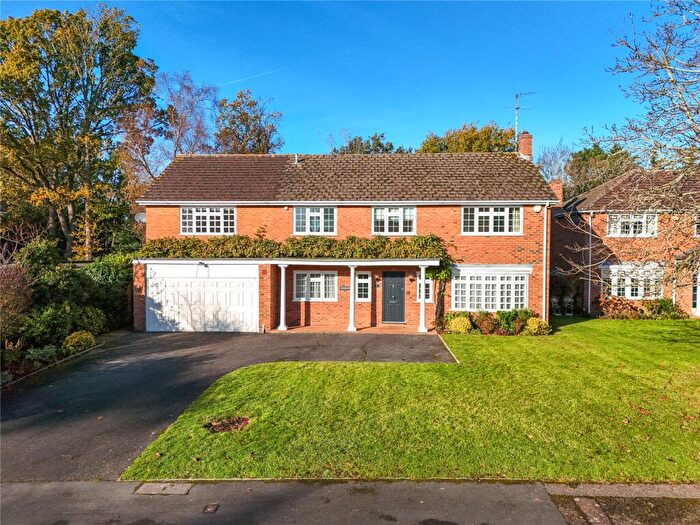
Properties in Oxshott And Stoke Dabernon have an average house price of £1,503,355.75 and had 113 Property Transactions within the last 3 years¹.
Oxshott And Stoke Dabernon is an area in Cobham, Surrey with 1,185 households², where the most expensive property was sold for £5,100,000.00.
Properties for sale in Oxshott And Stoke Dabernon
Roads and Postcodes in Oxshott And Stoke Dabernon
Navigate through our locations to find the location of your next house in Oxshott And Stoke Dabernon, Cobham for sale or to rent.
| Streets | Postcodes |
|---|---|
| Aspen Close | KT11 3AD |
| Beechwood Drive | KT11 2DX |
| Birch Vale | KT11 2PX |
| Blue Bell Lane | KT11 3PW |
| Blundel Lane | KT11 2SE KT11 2SF KT11 2SN KT11 2SP KT11 2SU KT11 2SY KT11 2SL |
| Brackenhill | KT11 2EW |
| Bray Road | KT11 3HZ |
| Cobham Road | KT11 3QF |
| Coppice Avenue | KT11 2FG |
| Courtleas | KT11 2PW |
| Crow Gables Close | KT11 2FP KT11 2FR KT11 2FS KT11 2FT KT11 2FU KT11 2FW |
| Dabernon Drive | KT11 3JD KT11 3JE |
| Evelyn Way | KT11 2SJ |
| Fairmile Lane | KT11 2FY |
| Fairmile Park Road | KT11 2PL KT11 2PP |
| Hawkhurst | KT11 2QX |
| Heath Ridge Green | KT11 2QJ KT11 2QL |
| Heathfield | KT11 2QY |
| Hill View Place | KT11 2QA |
| Irene Road | KT11 2SR |
| Kenilworth Avenue | KT11 2ST |
| Kimberley Ride | KT11 2QD |
| Knighton Place | KT11 3AH |
| Knowle Park | KT11 3AA KT11 3AB |
| Lebanon Drive | KT11 2PR |
| Links Green Way | KT11 2QH |
| Littleheath Lane | KT11 2QG KT11 2QN KT11 2QQ KT11 2QS KT11 2QF |
| Lodge Close | KT11 2SG KT11 2SH KT11 2SQ |
| Oxdowne Close | KT11 2SZ |
| Park Hill Drive | KT11 2FN |
| Pony Chase | KT11 2PF |
| Portsmouth Road | KT11 1TA KT11 1TF |
| Randolph Close | KT11 2SW |
| Richards Road | KT11 2SX |
| Roundhill Way | KT11 2EX |
| Sandroyd Way | KT11 2PS |
| Sandy Drive | KT11 2ET |
| Sandy Lane | KT11 2EU KT11 2EH KT11 2EJ KT11 2ER KT11 2ES |
| Sandy Way | KT11 2EY |
| Somerville Road | KT11 2QT KT11 2QU |
| Spinney Close | KT11 2DY |
| Station Road | KT11 3BL KT11 3BN KT11 3BT KT11 3BW |
| Stoke Close | KT11 3AE |
| Stoke Road | KT11 3BH KT11 3BJ KT11 3PT KT11 3PU KT11 3AF KT11 3PS KT11 3PX |
| The Laurels | KT11 2TA |
| The Ridings | KT11 2PT KT11 2PU |
| Tilt Close | KT11 3HU |
| Tilt Road | KT11 3HS KT11 3HT KT11 3HX KT11 3HY |
| Tudor Close | KT11 2PH |
| Twinoaks | KT11 2QP KT11 2QW |
| Vincent Road | KT11 3JA KT11 3JB |
| Warblers Green | KT11 2NY |
| Water Lane | KT11 2PA KT11 2PB KT11 2TD |
| Waverley Road | KT11 2SS |
| Winston Drive | KT11 3BP KT11 3BS |
| Woodland Drive | KT11 2GN |
| Woodlands Lane | KT11 3QA KT11 3QD KT11 3PY KT11 3PZ KT11 3QB |
| Woodside Road | KT11 2QR |
| KT11 2TJ |
Transport near Oxshott And Stoke Dabernon
-
Cobham and Stoke D'abernon Station
-
Oxshott Station
-
Claygate Station
-
Bookham Station
-
Leatherhead Station
- FAQ
- Price Paid By Year
- Property Type Price
Frequently asked questions about Oxshott And Stoke Dabernon
What is the average price for a property for sale in Oxshott And Stoke Dabernon?
The average price for a property for sale in Oxshott And Stoke Dabernon is £1,503,356. This amount is 14% higher than the average price in Cobham. There are 978 property listings for sale in Oxshott And Stoke Dabernon.
What streets have the most expensive properties for sale in Oxshott And Stoke Dabernon?
The streets with the most expensive properties for sale in Oxshott And Stoke Dabernon are Water Lane at an average of £3,035,833, Park Hill Drive at an average of £2,580,000 and Sandy Lane at an average of £2,253,333.
What streets have the most affordable properties for sale in Oxshott And Stoke Dabernon?
The streets with the most affordable properties for sale in Oxshott And Stoke Dabernon are Winston Drive at an average of £638,333, Station Road at an average of £743,666 and Stoke Road at an average of £745,000.
Which train stations are available in or near Oxshott And Stoke Dabernon?
Some of the train stations available in or near Oxshott And Stoke Dabernon are Cobham and Stoke D'abernon, Oxshott and Claygate.
Property Price Paid in Oxshott And Stoke Dabernon by Year
The average sold property price by year was:
| Year | Average Sold Price | Price Change |
Sold Properties
|
|---|---|---|---|
| 2025 | £1,209,576.92 | -25% |
26 Properties |
| 2024 | £1,517,614.58 | -11% |
48 Properties |
| 2023 | £1,681,658.97 | 9% |
39 Properties |
| 2022 | £1,528,541.49 | 9% |
67 Properties |
| 2021 | £1,391,648.51 | 2% |
67 Properties |
| 2020 | £1,368,651.53 | 9% |
66 Properties |
| 2019 | £1,249,708.16 | -7% |
49 Properties |
| 2018 | £1,338,402.29 | -9% |
58 Properties |
| 2017 | £1,464,813.73 | 21% |
51 Properties |
| 2016 | £1,158,585.72 | -0,3% |
53 Properties |
| 2015 | £1,162,188 | -2% |
60 Properties |
| 2014 | £1,183,839 | 6% |
69 Properties |
| 2013 | £1,112,514 | 24% |
62 Properties |
| 2012 | £845,192 | -10% |
52 Properties |
| 2011 | £932,264.79 | 8% |
47 Properties |
| 2010 | £855,273.37 | 4% |
57 Properties |
| 2009 | £819,559 | -9% |
64 Properties |
| 2008 | £890,819.44 | 4% |
36 Properties |
| 2007 | £855,020 | 23% |
69 Properties |
| 2006 | £660,458 | 11% |
65 Properties |
| 2005 | £586,666 | -4% |
58 Properties |
| 2004 | £609,421 | 9% |
64 Properties |
| 2003 | £556,663 | 4% |
59 Properties |
| 2002 | £536,248 | 8% |
66 Properties |
| 2001 | £493,094 | 11% |
70 Properties |
| 2000 | £437,851.79 | 13% |
56 Properties |
| 1999 | £379,611 | 11% |
82 Properties |
| 1998 | £338,994.79 | 24% |
67 Properties |
| 1997 | £258,636.92 | 17% |
65 Properties |
| 1996 | £214,463 | 9% |
65 Properties |
| 1995 | £195,689 | - |
53 Properties |
Property Price per Property Type in Oxshott And Stoke Dabernon
Here you can find historic sold price data in order to help with your property search.
The average Property Paid Price for specific property types in the last three years are:
| Property Type | Average Sold Price | Sold Properties |
|---|---|---|
| Semi Detached House | £966,937.00 | 16 Semi Detached Houses |
| Detached House | £1,605,591.11 | 90 Detached Houses |
| Terraced House | £957,500.00 | 2 Terraced Houses |
| Flat | £1,598,000.00 | 5 Flats |

