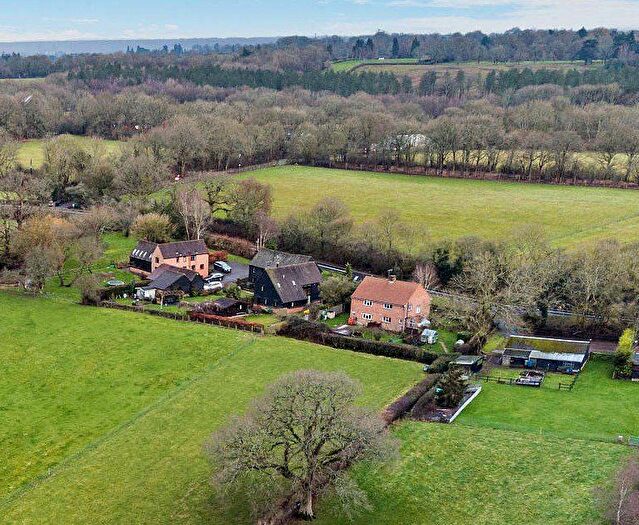
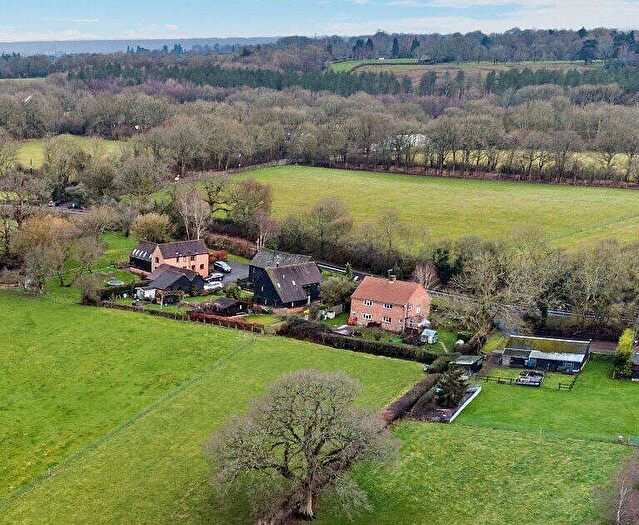
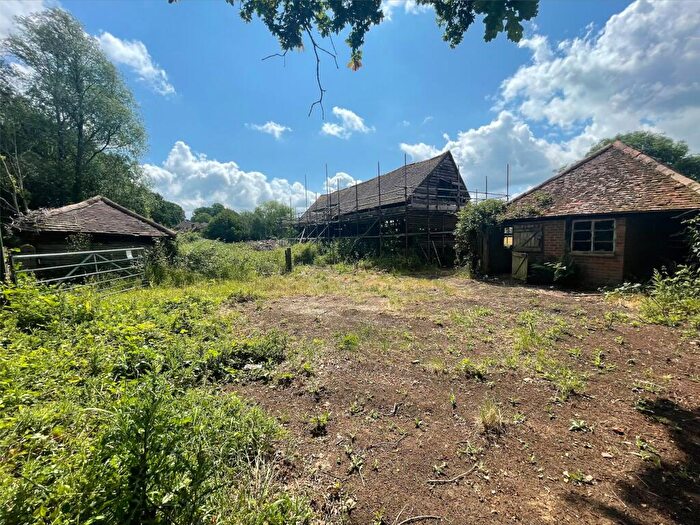
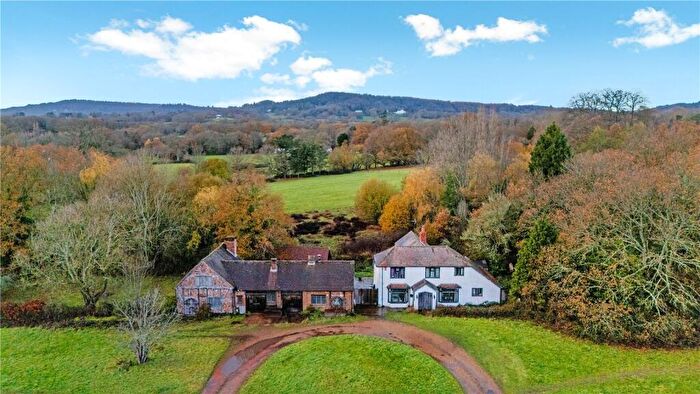
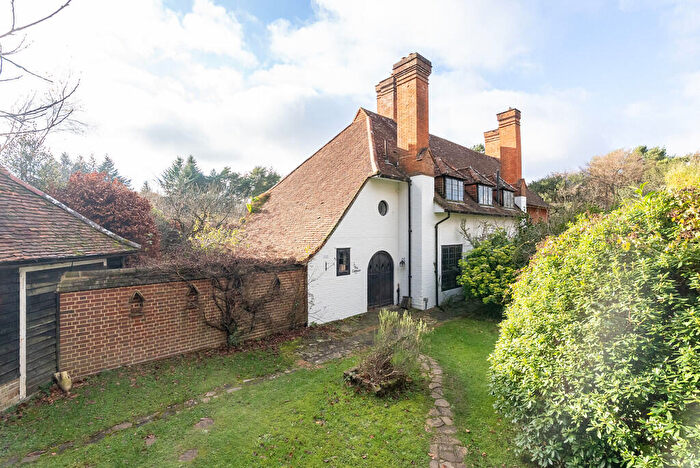
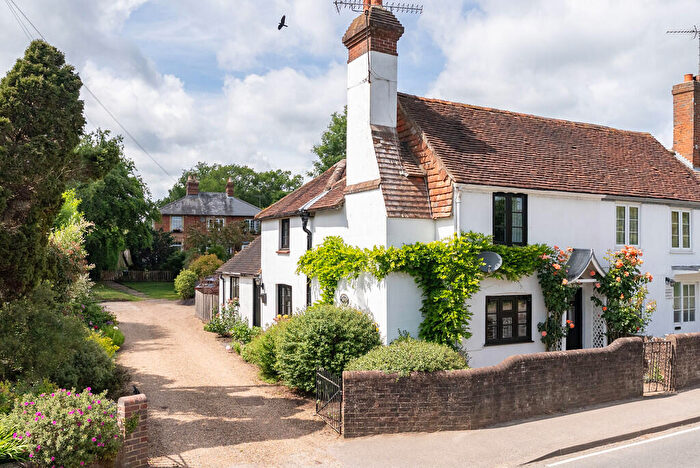
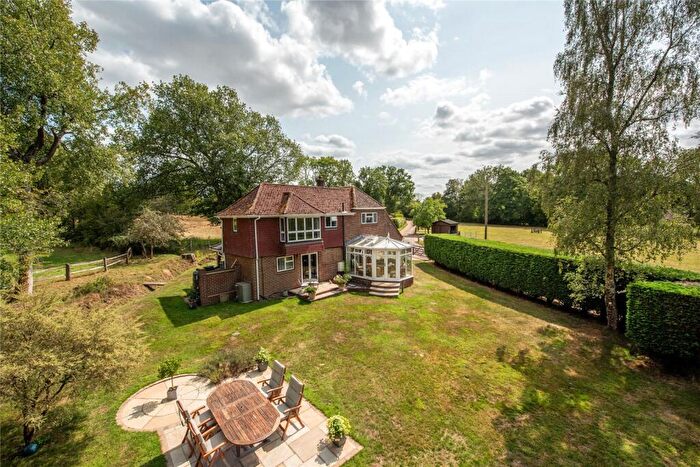
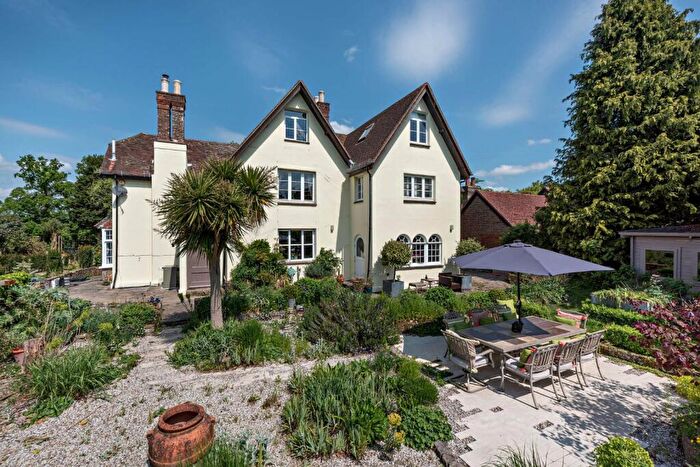
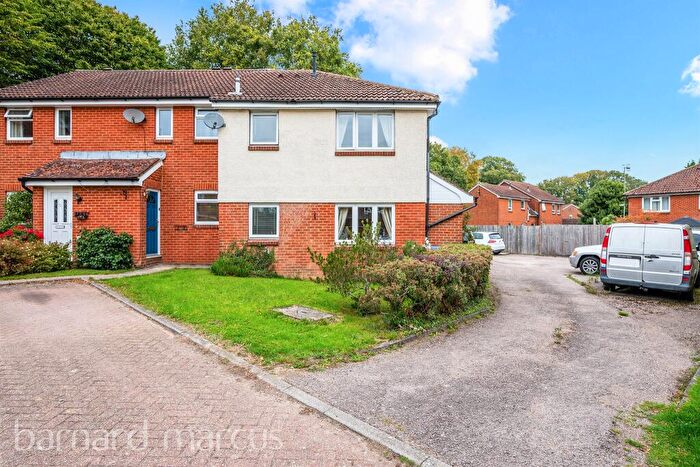
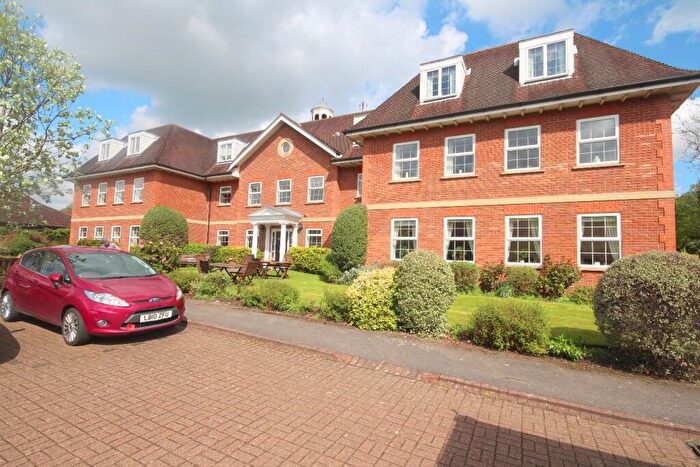
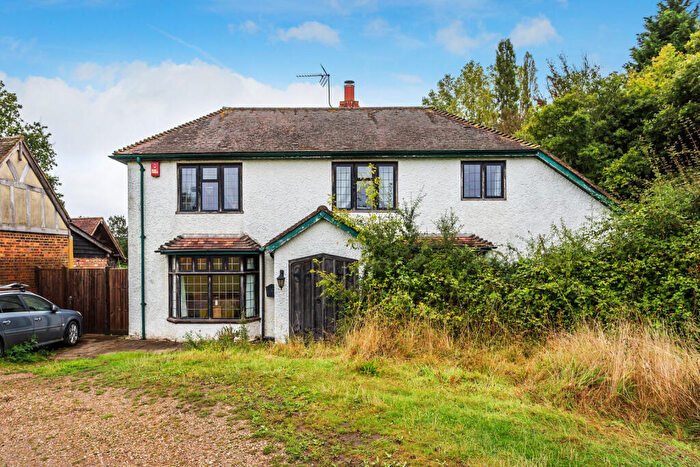
Houses for sale & to rent in Okewood, Dorking
House Prices in Okewood
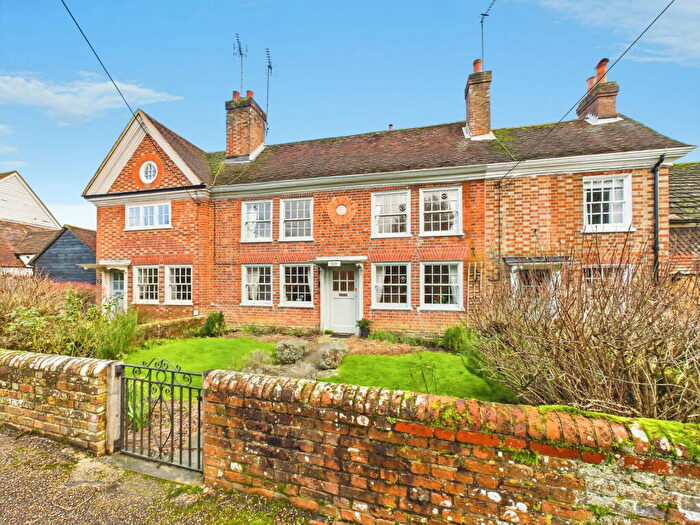
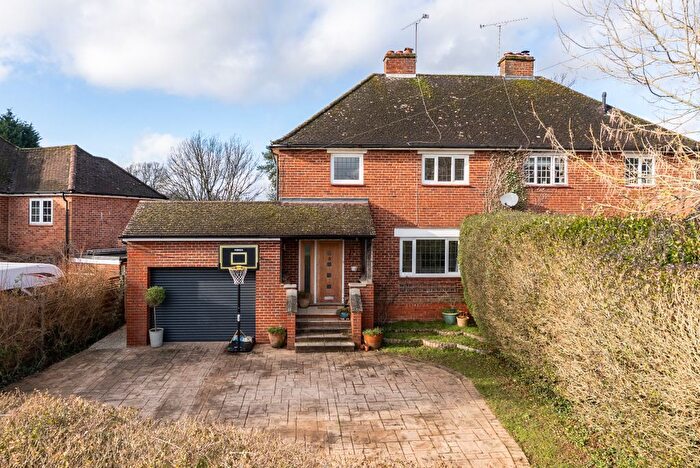
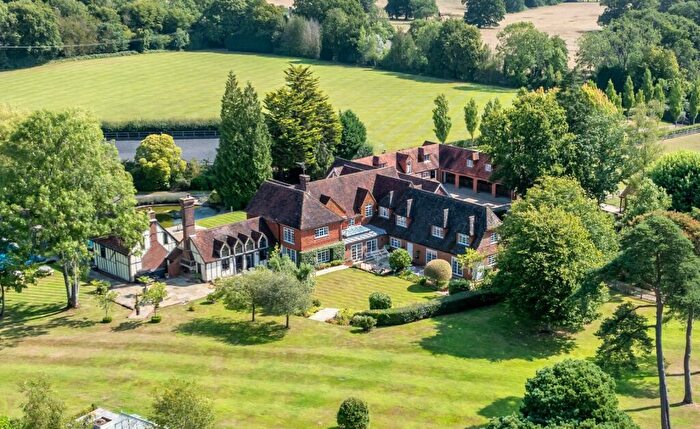
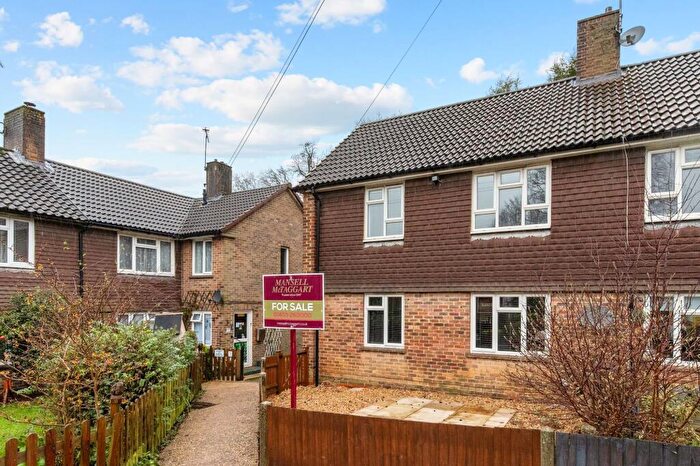
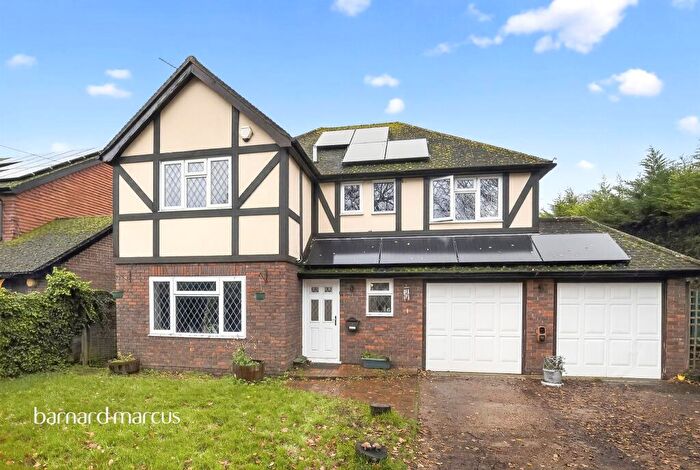
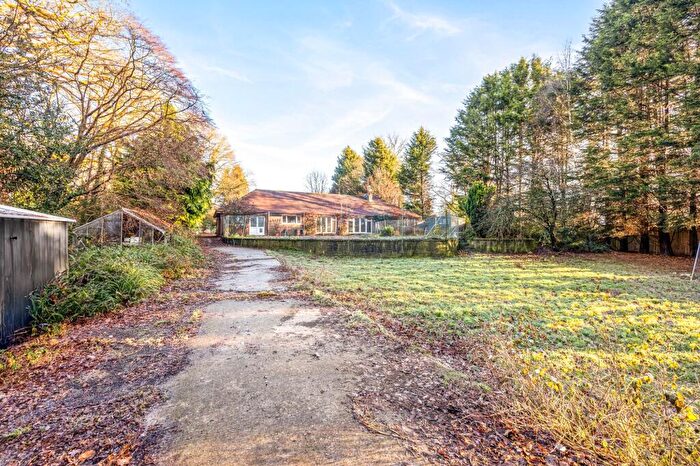
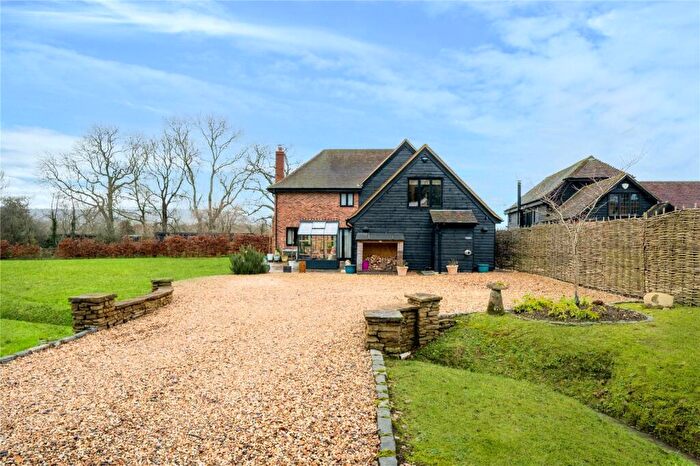
Properties in Okewood have an average house price of £828,970.00 and had 39 Property Transactions within the last 3 years¹.
Okewood is an area in Dorking, Surrey with 768 households², where the most expensive property was sold for £2,000,000.00.
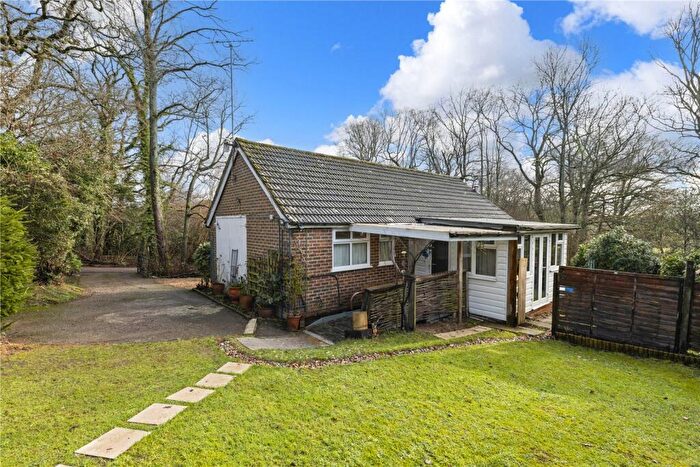
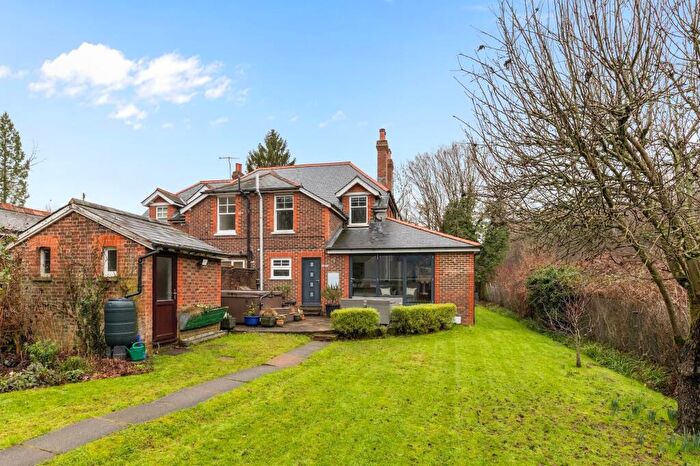
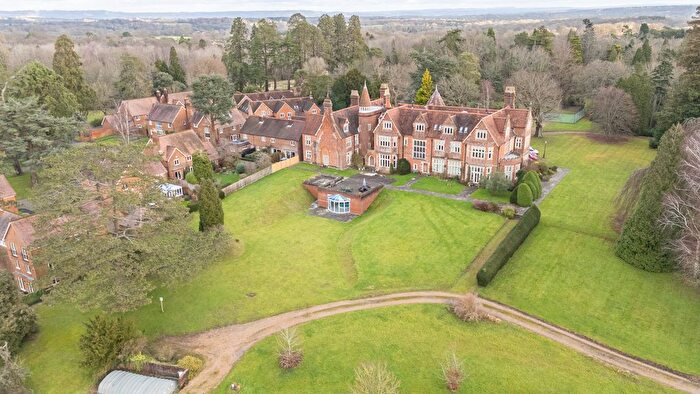
Properties for sale in Okewood
Roads and Postcodes in Okewood
Navigate through our locations to find the location of your next house in Okewood, Dorking for sale or to rent.
| Streets | Postcodes |
|---|---|
| Beare Green Road | RH5 4PX RH5 4PY |
| Brickyard Copse | RH5 5TJ |
| Broome Hall Road | RH5 6HP |
| Cathill Lane | RH5 5QP |
| Chenies Cottages | RH5 5NB |
| Church Lane | RH5 5QT |
| Coles Lane | RH5 5HU RH5 5LS RH5 5LT RH5 5SX |
| Cricketers Close | RH5 5BA |
| Elmers Road | RH5 5TL |
| Fernbank Close | RH5 5SP |
| Forest Green | RH5 5PP RH5 5PR RH5 5RZ RH5 5SB RH5 5SQ |
| Friday Street | RH5 5TE |
| Froggetts Lane | RH5 5RJ |
| Furzen Lane | RH5 5QE |
| Honeywood Lane | RH5 5PZ RH5 5PY RH5 5QB |
| Horsham Road | RH5 5QG RH5 5RL RH5 5QD |
| Kings Arms Court | RH5 5BD |
| Lazenbys Estate | RH5 5RE |
| Lyefield Lane | RH5 5SN |
| Mayes Green | RH5 5PN |
| Mole Street | RH5 5PB RH5 5PE |
| New Barn Lane | RH5 5PF |
| New Road | RH5 5SA |
| Oakfields | RH5 5RQ |
| Ockley Road | RH5 5SG |
| Okewood Hill | RH5 5PT RH5 5PU RH5 5NA RH5 5PS RH5 5RH |
| Pisley Farm Road | RH5 5PD |
| Prideaux Gardens | RH5 5TA |
| Rectory Close | RH5 5TN |
| Ruckmans Lane | RH5 5ND RH5 5NE |
| Sheep Green | RH5 5RR |
| Standon Lane | RH5 5QR RH5 5QU RH5 5QY RH5 5PQ RH5 5QZ |
| Stane Street | RH5 5LU RH5 5LX RH5 5NG RH5 5ST RH5 5SY RH5 5TD RH5 5TH RH5 5TP RH5 5TQ RH5 5TS RH5 5LY RH5 5TG |
| Station Approach | RH5 5HT |
| The Green | RH5 5SS RH5 5TR RH5 5TB |
| Trap Lane | RH5 5QX |
| Vann Farm Road | RH5 5TF |
| Vann Lake Road | RH5 5JB RH5 5NS RH5 5NT |
| Weare Street | RH5 5HY RH5 5JA RH5 5JD RH5 5NH RH5 5NW RH5 5NL RH5 5NN RH5 5NP |
| Wheelwright Court | RH5 5TT |
| Woodlands Drive | RH5 5HZ |
| RH5 5PL RH5 5QJ RH5 5RD RH5 5RG RH5 5QH |
Transport near Okewood
- FAQ
- Price Paid By Year
- Property Type Price
Frequently asked questions about Okewood
What is the average price for a property for sale in Okewood?
The average price for a property for sale in Okewood is £828,970. This amount is 35% higher than the average price in Dorking. There are 674 property listings for sale in Okewood.
What streets have the most expensive properties for sale in Okewood?
The streets with the most expensive properties for sale in Okewood are Mole Street at an average of £1,500,000, Forest Green at an average of £1,096,250 and Weare Street at an average of £1,061,799.
What streets have the most affordable properties for sale in Okewood?
The streets with the most affordable properties for sale in Okewood are Honeywood Lane at an average of £306,666, Oakfields at an average of £392,500 and Kings Arms Court at an average of £502,500.
Which train stations are available in or near Okewood?
Some of the train stations available in or near Okewood are Ockley, Holmwood and Warnham.
Property Price Paid in Okewood by Year
The average sold property price by year was:
| Year | Average Sold Price | Price Change |
Sold Properties
|
|---|---|---|---|
| 2025 | £900,130 | 17% |
18 Properties |
| 2024 | £745,944 | -5% |
9 Properties |
| 2023 | £784,499 | -16% |
12 Properties |
| 2022 | £909,067 | -7% |
24 Properties |
| 2021 | £969,698 | 17% |
40 Properties |
| 2020 | £809,463 | 5% |
15 Properties |
| 2019 | £765,356 | 22% |
16 Properties |
| 2018 | £596,239 | -18% |
20 Properties |
| 2017 | £702,886 | 8% |
22 Properties |
| 2016 | £644,651 | 1% |
29 Properties |
| 2015 | £640,270 | 9% |
24 Properties |
| 2014 | £585,012 | 4% |
22 Properties |
| 2013 | £564,146 | -14% |
15 Properties |
| 2012 | £645,261 | 12% |
17 Properties |
| 2011 | £568,636 | -4% |
11 Properties |
| 2010 | £591,666 | 28% |
24 Properties |
| 2009 | £424,900 | -47% |
24 Properties |
| 2008 | £623,653 | 2% |
13 Properties |
| 2007 | £613,078 | 22% |
30 Properties |
| 2006 | £479,410 | 1% |
23 Properties |
| 2005 | £474,270 | 27% |
31 Properties |
| 2004 | £347,732 | -3% |
34 Properties |
| 2003 | £358,413 | -9% |
23 Properties |
| 2002 | £390,989 | 18% |
34 Properties |
| 2001 | £321,564 | -12% |
27 Properties |
| 2000 | £361,342 | 27% |
25 Properties |
| 1999 | £265,513 | 25% |
23 Properties |
| 1998 | £198,611 | 11% |
17 Properties |
| 1997 | £176,156 | -47% |
29 Properties |
| 1996 | £258,565 | 44% |
23 Properties |
| 1995 | £144,976 | - |
21 Properties |
Property Price per Property Type in Okewood
Here you can find historic sold price data in order to help with your property search.
The average Property Paid Price for specific property types in the last three years are:
| Property Type | Average Sold Price | Sold Properties |
|---|---|---|
| Semi Detached House | £626,500.00 | 14 Semi Detached Houses |
| Detached House | £1,133,623.00 | 19 Detached Houses |
| Terraced House | £400,000.00 | 2 Terraced Houses |
| Flat | £305,000.00 | 4 Flats |

