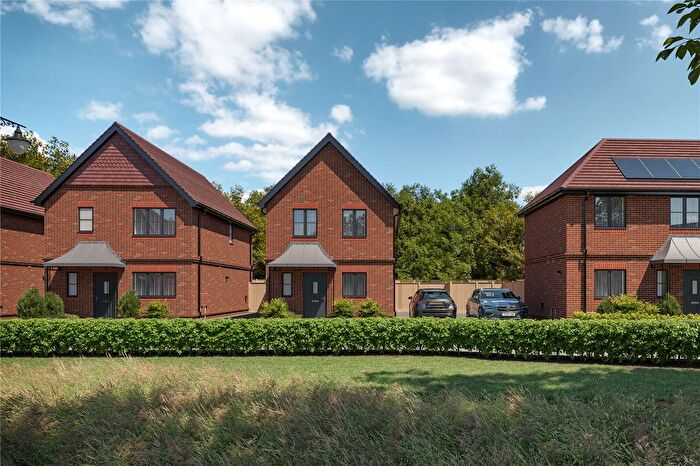
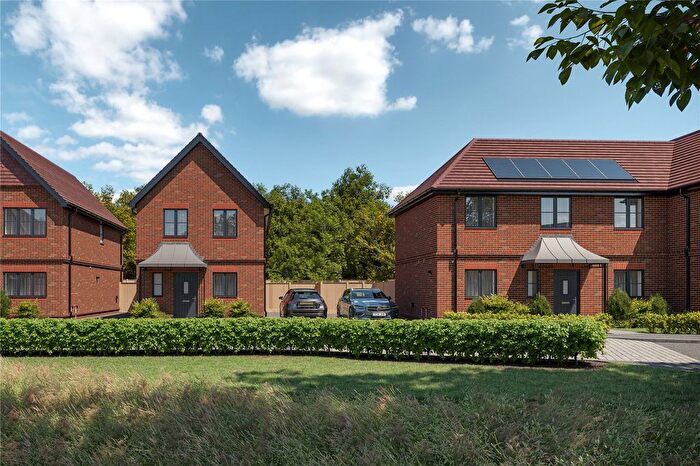
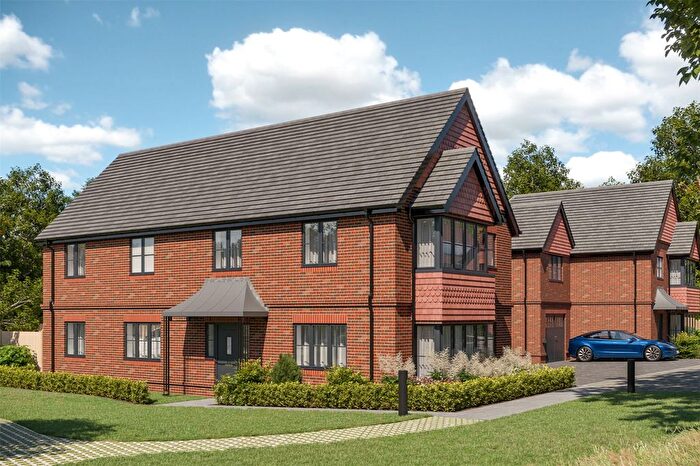
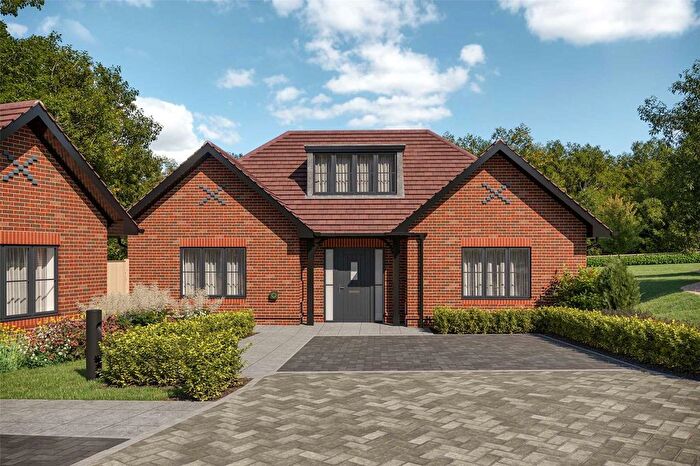
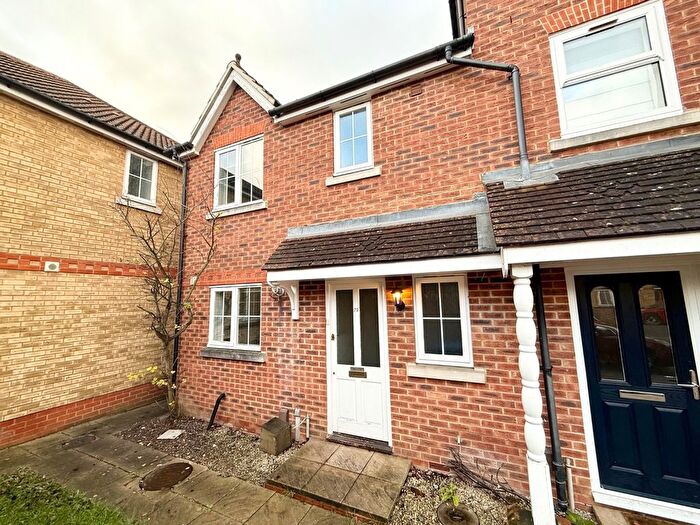
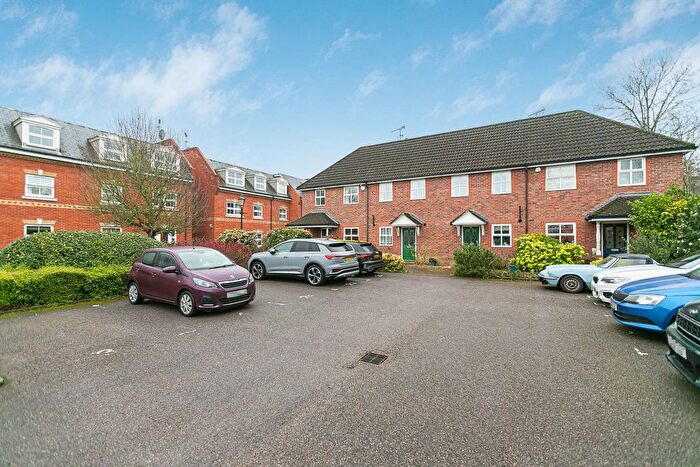
Houses for sale & to rent in Englefield Green East, Egham
House Prices in Englefield Green East
Properties in Englefield Green East have an average house price of £726,620.00 and had 102 Property Transactions within the last 3 years¹.
Englefield Green East is an area in Egham, Surrey with 1,187 households², where the most expensive property was sold for £2,200,000.00.
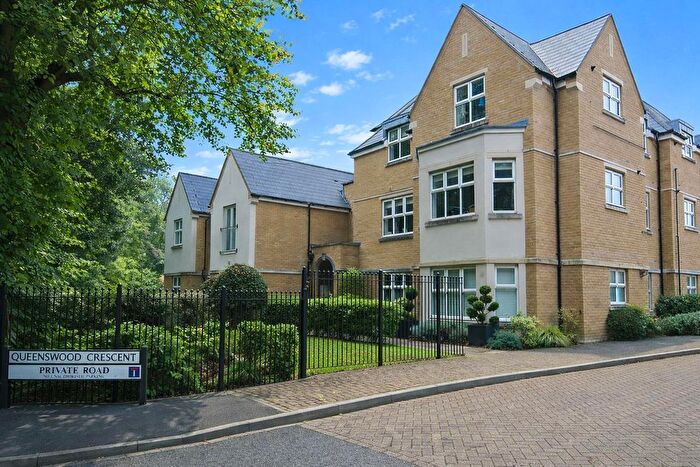
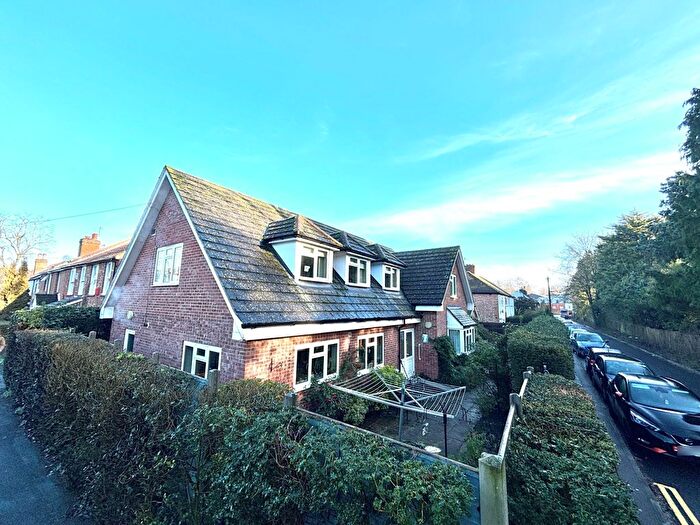
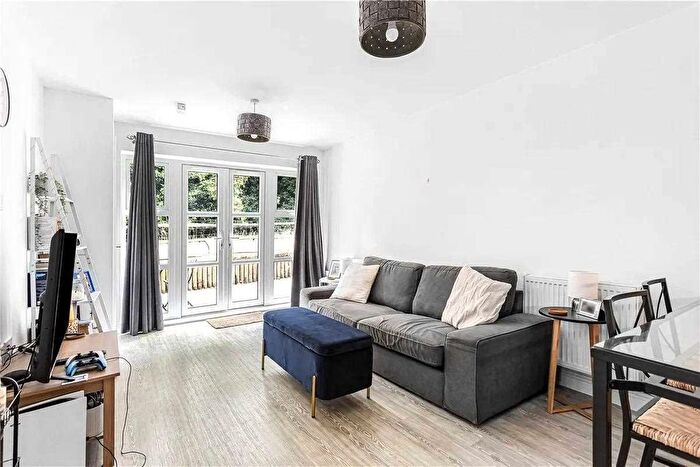
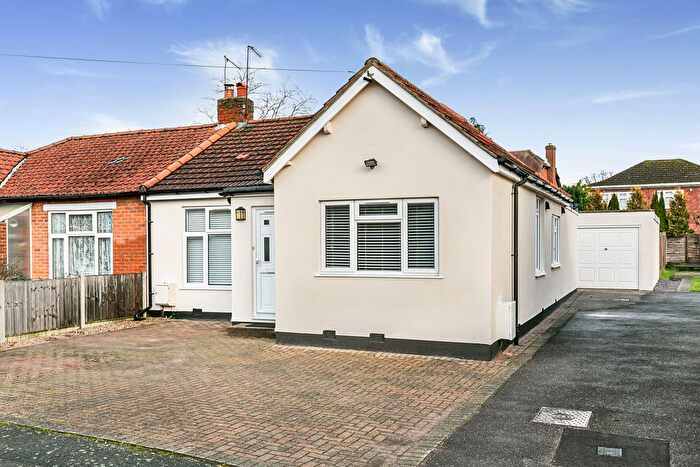
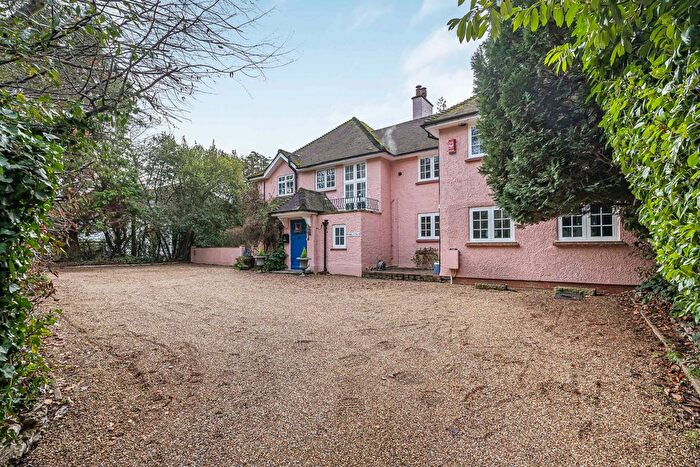
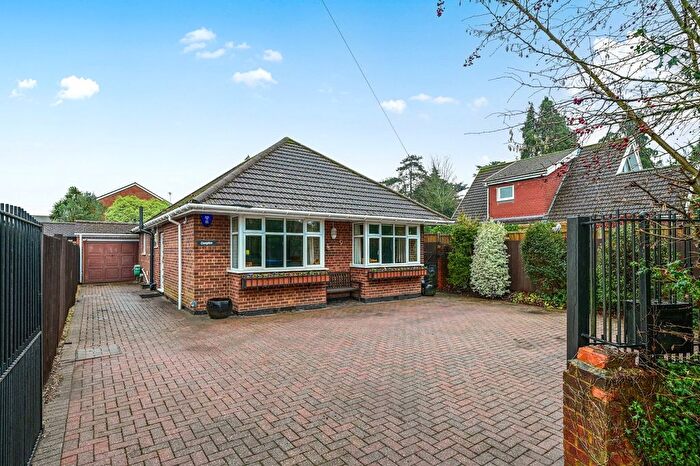
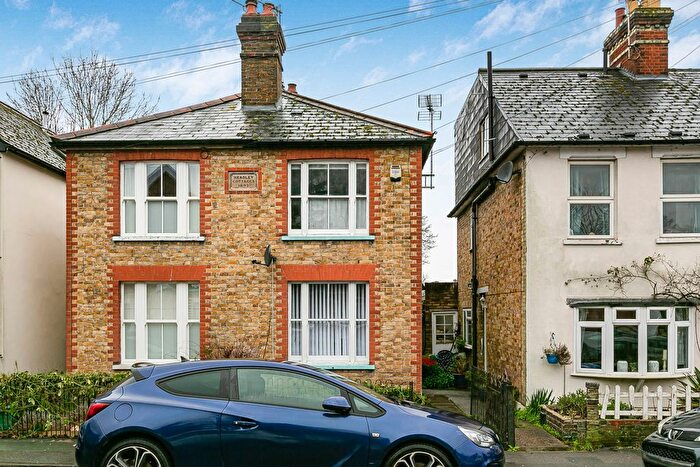
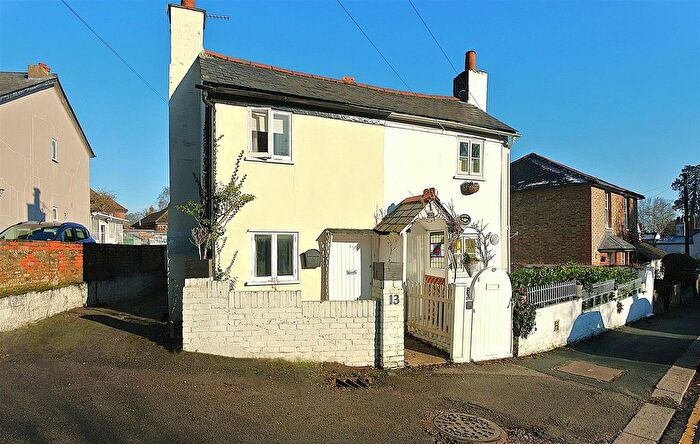
Properties for sale in Englefield Green East
Previously listed properties in Englefield Green East
Roads and Postcodes in Englefield Green East
Navigate through our locations to find the location of your next house in Englefield Green East, Egham for sale or to rent.
| Streets | Postcodes |
|---|---|
| Albert Road | TW20 0RQ TW20 0RJ |
| Alder Close | TW20 0LU |
| Alderside Walk | TW20 0LX TW20 0LY |
| Alexandra Road | TW20 0RP TW20 0RR |
| Armstrong Road | TW20 0RW |
| Bakeham Lane | TW20 9TS TW20 9TT TW20 9TU TW20 9TY TW20 9TZ |
| Barley Mow Road | TW20 0NP TW20 0NT TW20 0NU |
| Barnway | TW20 0QU |
| Bulkeley Close | TW20 0NS |
| Burnham Mews | TW20 0LW |
| Chestnut Drive | TW20 0BJ |
| Clarence Drive | TW20 0NL |
| Coopers Hill Lane | TW20 0JX TW20 0LF |
| Danehurst Close | TW20 9PX |
| Egham Hill | TW20 0AL TW20 0AY TW20 0BD TW20 0BG TW20 0ER TW20 0BL TW20 0BQ TW20 0EG TW20 0EQ TW20 0ES TW20 0EX TW20 0EY |
| Englefield Close | TW20 0SE |
| Englefield Green | TW20 0JU |
| Falaise | TW20 0BB |
| Falconwood | TW20 0LS |
| Furzedown Close | TW20 9PY |
| Greenacre Court | TW20 0RF |
| Harvest Road | TW20 0QP TW20 0QR TW20 0QS TW20 0QT TW20 0SG TW20 0BN TW20 0QH |
| Highfield Close | TW20 0RN |
| Highfield Road | TW20 0BW TW20 0SS TW20 0TB |
| Hollycombe | TW20 0LQ |
| King Johns Place | TW20 0AP |
| Kingswood Close | TW20 0NQ |
| Kingswood Rise | TW20 0NG |
| Lancaster Close | TW20 0LA |
| Lodge Close | TW20 0JF |
| Middle Hill | TW20 0JG TW20 0JJ TW20 0JL TW20 0JP TW20 0JQ TW20 0JR TW20 0JS TW20 0JT TW20 0NW |
| Mount Pleasant Cottages | TW20 0BH |
| Oak Tree Drive | TW20 0NR |
| Parsonage Road | TW20 0JW TW20 0LD |
| Prune Hill | TW20 9TR |
| Roberts Way | TW20 9SH |
| Rushmere Place | TW20 0NN |
| Savill Mews | TW20 0SN |
| Simons Walk | TW20 9SJ TW20 9SQ |
| South Road | TW20 0RL |
| Spencer Gardens | TW20 0JN |
| St Cuthberts Close | TW20 0QN |
| St Judes Road | TW20 0BY TW20 0DH TW20 0DB |
| The Retreat | TW20 0JH |
| Tite Hill | TW20 0LT TW20 0LZ TW20 0ND TW20 0NF TW20 0NH TW20 0NJ TW20 0LR |
| Victoria Street | TW20 0AW TW20 0QX TW20 0QY TW20 0QL |
| Willow Walk | TW20 0DQ |
Transport near Englefield Green East
- FAQ
- Price Paid By Year
- Property Type Price
Frequently asked questions about Englefield Green East
What is the average price for a property for sale in Englefield Green East?
The average price for a property for sale in Englefield Green East is £726,620. This amount is 21% higher than the average price in Egham. There are 859 property listings for sale in Englefield Green East.
What streets have the most expensive properties for sale in Englefield Green East?
The streets with the most expensive properties for sale in Englefield Green East are Kingswood Close at an average of £1,425,000, Lancaster Close at an average of £1,385,000 and Tite Hill at an average of £1,270,200.
What streets have the most affordable properties for sale in Englefield Green East?
The streets with the most affordable properties for sale in Englefield Green East are Armstrong Road at an average of £271,666, Englefield Close at an average of £323,500 and South Road at an average of £341,250.
Which train stations are available in or near Englefield Green East?
Some of the train stations available in or near Englefield Green East are Egham, Virginia Water and Wraysbury.
Property Price Paid in Englefield Green East by Year
The average sold property price by year was:
| Year | Average Sold Price | Price Change |
Sold Properties
|
|---|---|---|---|
| 2025 | £534,204 | -45% |
22 Properties |
| 2024 | £773,689 | -1% |
37 Properties |
| 2023 | £784,564 | 5% |
43 Properties |
| 2022 | £743,679 | -16% |
72 Properties |
| 2021 | £863,819 | 12% |
59 Properties |
| 2020 | £762,391 | 6% |
53 Properties |
| 2019 | £713,825 | 24% |
43 Properties |
| 2018 | £539,996 | -10% |
47 Properties |
| 2017 | £592,738 | -12% |
53 Properties |
| 2016 | £665,941 | 20% |
48 Properties |
| 2015 | £534,668 | -1% |
56 Properties |
| 2014 | £541,680 | 10% |
56 Properties |
| 2013 | £489,622 | -30% |
60 Properties |
| 2012 | £636,869 | -8% |
38 Properties |
| 2011 | £685,891 | 34% |
46 Properties |
| 2010 | £450,409 | 14% |
66 Properties |
| 2009 | £386,865 | -26% |
42 Properties |
| 2008 | £487,399 | 14% |
41 Properties |
| 2007 | £420,721 | 14% |
93 Properties |
| 2006 | £362,459 | -3% |
98 Properties |
| 2005 | £373,315 | 1% |
80 Properties |
| 2004 | £369,978 | 26% |
78 Properties |
| 2003 | £273,300 | -14% |
75 Properties |
| 2002 | £312,113 | 16% |
68 Properties |
| 2001 | £261,939 | -1% |
87 Properties |
| 2000 | £264,425 | 17% |
73 Properties |
| 1999 | £219,207 | 3% |
94 Properties |
| 1998 | £212,116 | 10% |
69 Properties |
| 1997 | £190,774 | 22% |
77 Properties |
| 1996 | £149,468 | 24% |
58 Properties |
| 1995 | £113,783 | - |
56 Properties |
Property Price per Property Type in Englefield Green East
Here you can find historic sold price data in order to help with your property search.
The average Property Paid Price for specific property types in the last three years are:
| Property Type | Average Sold Price | Sold Properties |
|---|---|---|
| Semi Detached House | £626,178.00 | 14 Semi Detached Houses |
| Detached House | £1,083,119.00 | 44 Detached Houses |
| Terraced House | £482,092.00 | 27 Terraced Houses |
| Flat | £275,000.00 | 17 Flats |

