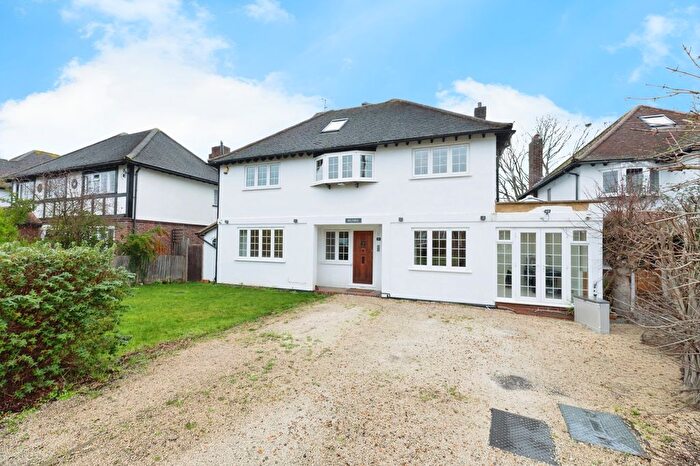
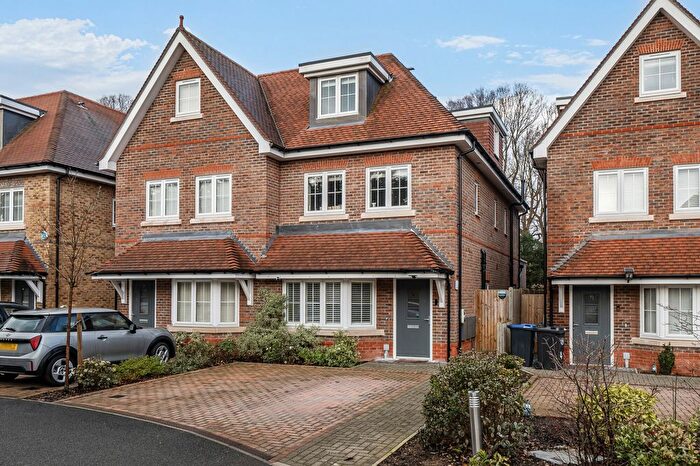
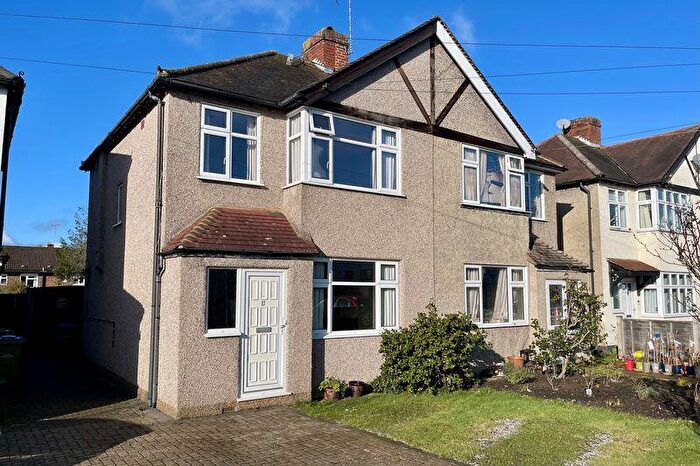
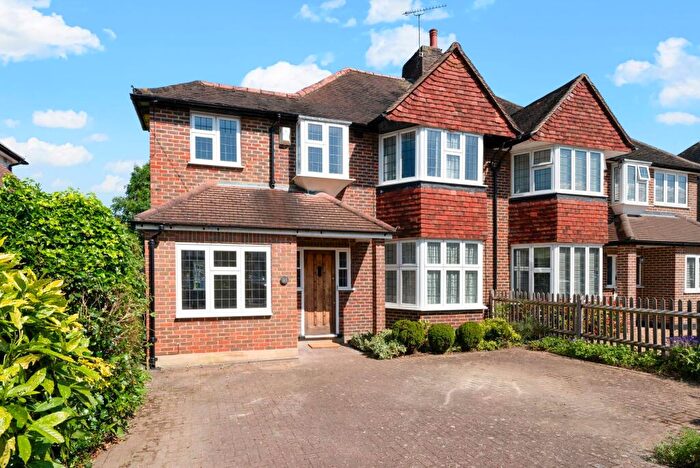
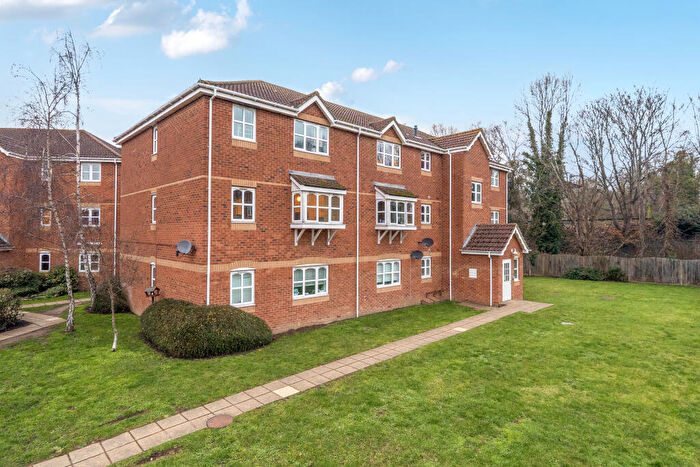
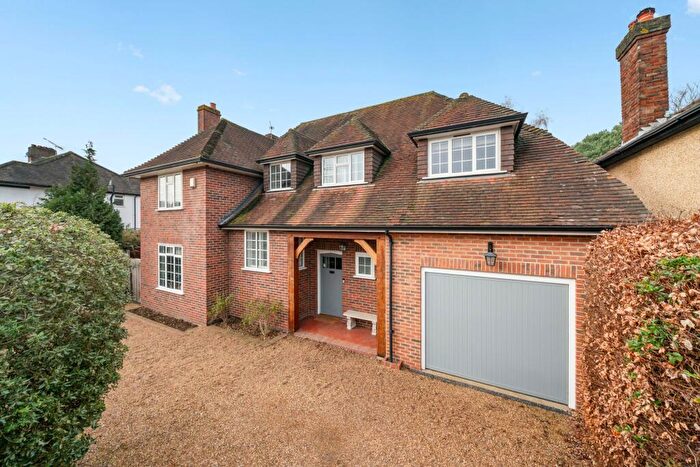
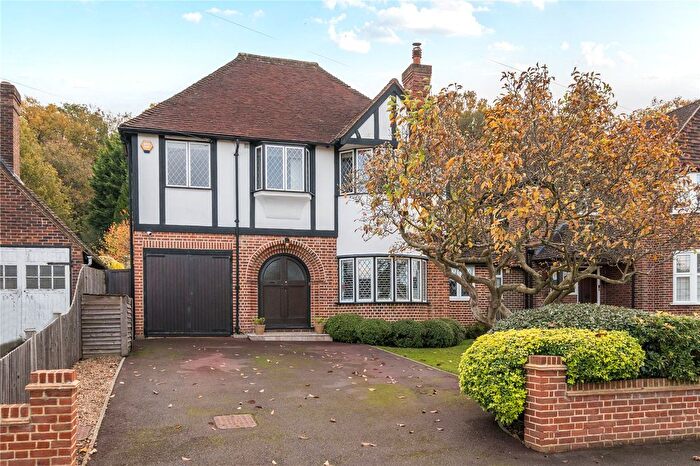
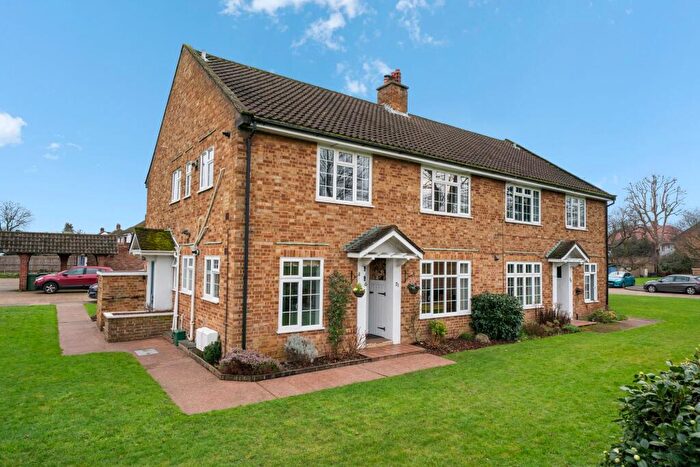
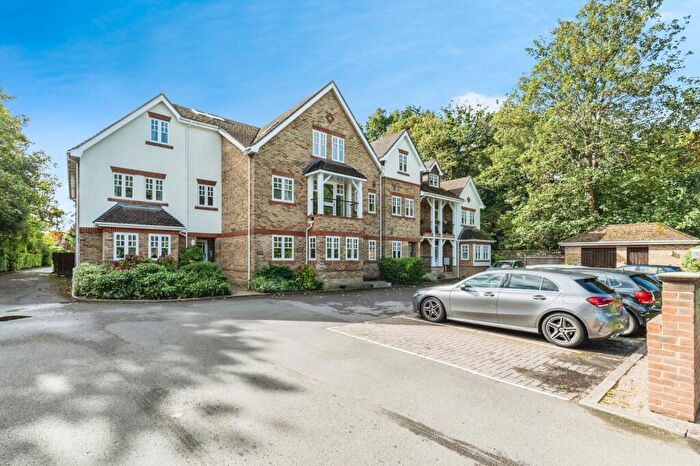
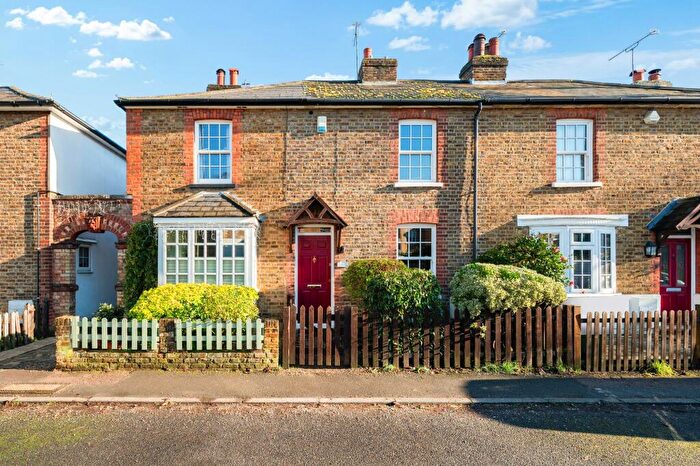
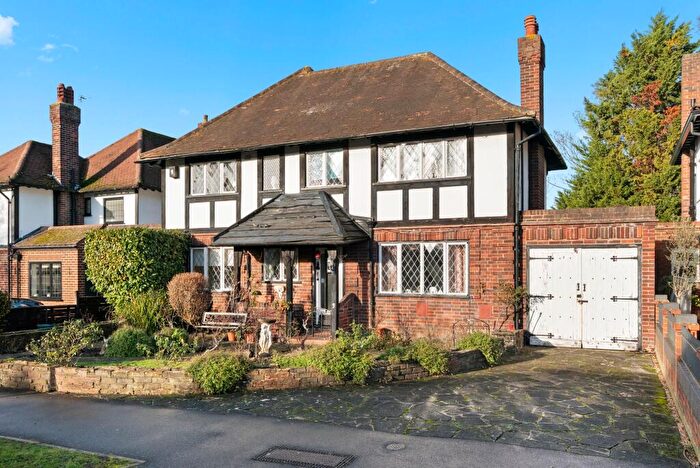
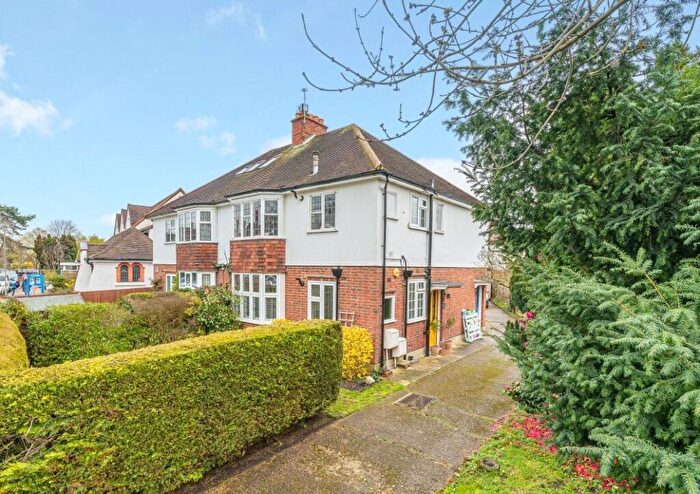
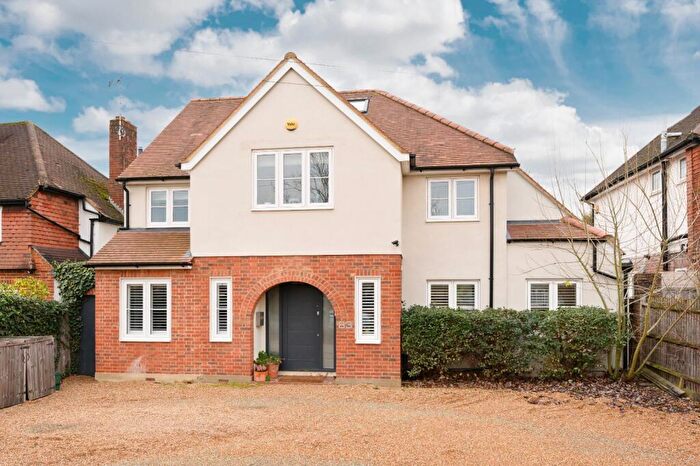
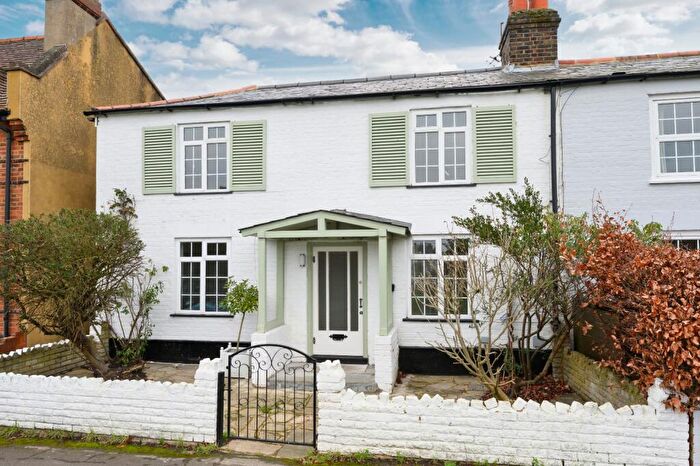
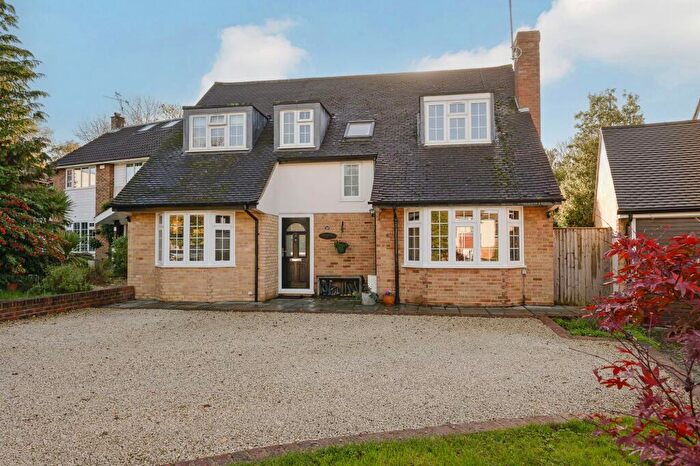
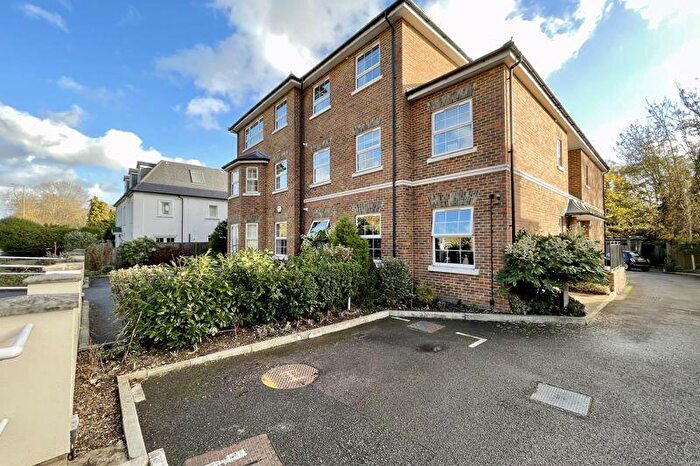
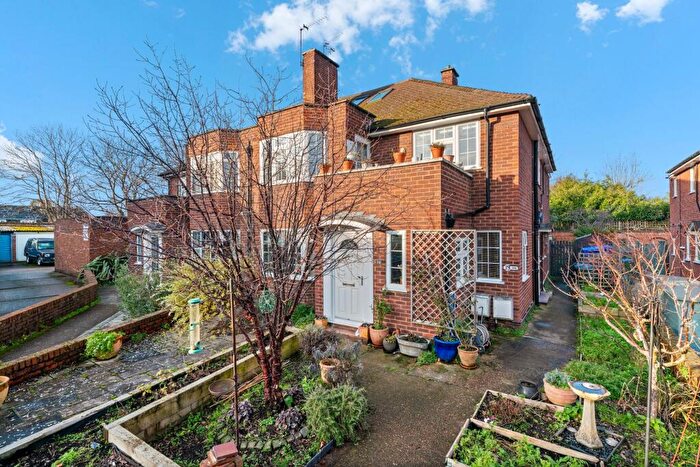
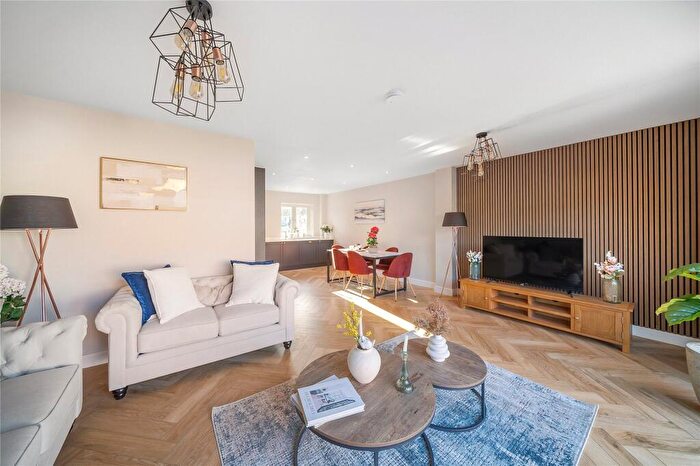
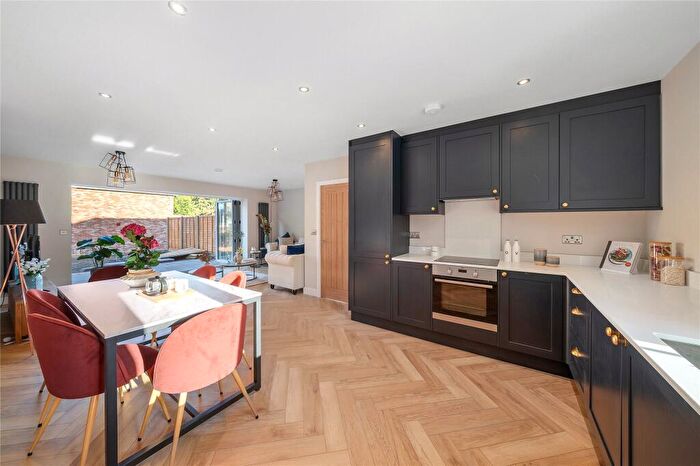
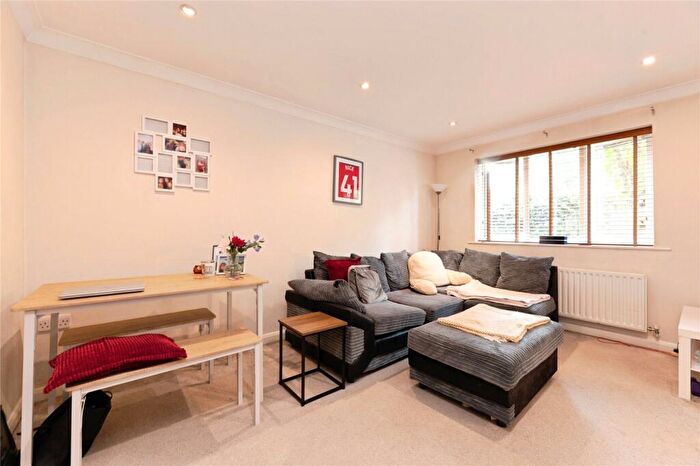
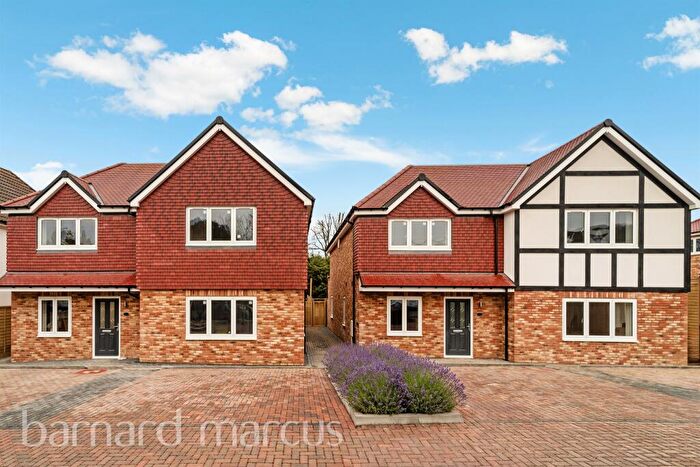
Houses for sale & to rent in Hinchley Wood, Esher
House Prices in Hinchley Wood
Properties in Hinchley Wood have an average house price of £878,311.00 and had 160 Property Transactions within the last 3 years¹.
Hinchley Wood is an area in Esher, Surrey with 1,561 households², where the most expensive property was sold for £1,750,000.00.
Properties for sale in Hinchley Wood
Roads and Postcodes in Hinchley Wood
Navigate through our locations to find the location of your next house in Hinchley Wood, Esher for sale or to rent.
| Streets | Postcodes |
|---|---|
| Avondale Avenue | KT10 0DA KT10 0DB |
| Chesterfield Drive | KT10 0AH |
| Claygate Lane | KT10 0AQ KT10 0BH KT10 0BJ KT10 0BQ |
| Cotswold Close | KT10 0AP |
| Couchmore Avenue | KT10 9AS KT10 9AU KT10 9AX |
| Cumberland Drive | KT10 0BB KT10 0BG |
| Dorchester Close | KT10 0BE |
| Eastmont Road | KT10 9AY KT10 9AZ |
| Fairway Close | KT10 0DJ |
| Greenways | KT10 0QD KT10 0QH KT10 0QJ |
| Harefield | KT10 9TG KT10 9TQ |
| Haven Close | KT10 9AH |
| Haven Place | KT10 9AQ |
| Heathside | KT10 9TB KT10 9TD KT10 9TF |
| Heathside Close | KT10 9TE |
| Hengest Avenue | KT10 0BP |
| Hill Rise | KT10 0AL |
| Hillcrest Gardens | KT10 0BS KT10 0BT KT10 0BU KT10 0BX |
| Hillmont Road | KT10 9BA |
| Hinchley Close | KT10 0BY |
| Hinchley Drive | KT10 0BZ |
| Hinchley Way | KT10 0BD |
| Littleworth Road | KT10 9BZ KT10 9TN |
| Macaulay Avenue | KT10 9AT |
| Manor Drive | KT10 0AU KT10 0AX KT10 0AZ KT10 0BA |
| Manor Road North | KT10 0AA KT10 0AB KT10 0AD KT10 0AE KT10 0AF KT10 0AG KT10 0AT KT10 0AW KT10 0GJ KT10 0SH |
| Manor Road South | KT10 0PY KT10 0QA KT10 0QB KT10 0QL KT10 0QQ |
| Meadow Close | KT10 0AY |
| Medina Avenue | KT10 9TH KT10 9TJ |
| Montgomery Avenue | KT10 9BB |
| Poplar Road | KT10 0DD |
| Portsmouth Road | KT10 9AL KT10 9AP KT10 9AW KT10 9BF |
| Severn Drive | KT10 0AJ KT10 0AN |
| Soprano Way | KT10 0DG |
| Southmont Road | KT10 9BG |
| Southwood Gardens | KT10 0DE KT10 0DF |
| Station Approach | KT10 0SP KT10 0SR |
| Westmont Road | KT10 9BD KT10 9BE |
Transport near Hinchley Wood
-
Hinchley Wood Station
-
Esher Station
-
Thames Ditton Station
-
Claygate Station
-
Chessington North Station
-
Chessington South Station
-
Hampton Court Station
-
Surbiton Station
-
Hersham Station
-
Tolworth Station
- FAQ
- Price Paid By Year
- Property Type Price
Frequently asked questions about Hinchley Wood
What is the average price for a property for sale in Hinchley Wood?
The average price for a property for sale in Hinchley Wood is £878,311. This amount is 19% lower than the average price in Esher. There are 1,054 property listings for sale in Hinchley Wood.
What streets have the most expensive properties for sale in Hinchley Wood?
The streets with the most expensive properties for sale in Hinchley Wood are Cumberland Drive at an average of £1,586,666, Chesterfield Drive at an average of £1,437,500 and Manor Drive at an average of £1,328,750.
What streets have the most affordable properties for sale in Hinchley Wood?
The streets with the most affordable properties for sale in Hinchley Wood are Poplar Road at an average of £297,250, Station Approach at an average of £338,200 and Manor Road North at an average of £508,588.
Which train stations are available in or near Hinchley Wood?
Some of the train stations available in or near Hinchley Wood are Hinchley Wood, Esher and Thames Ditton.
Property Price Paid in Hinchley Wood by Year
The average sold property price by year was:
| Year | Average Sold Price | Price Change |
Sold Properties
|
|---|---|---|---|
| 2025 | £846,372 | -6% |
43 Properties |
| 2024 | £895,702 | 1% |
65 Properties |
| 2023 | £882,984 | 9% |
52 Properties |
| 2022 | £803,827 | -9% |
78 Properties |
| 2021 | £876,463 | 4% |
93 Properties |
| 2020 | £844,812 | 10% |
56 Properties |
| 2019 | £759,194 | 2% |
62 Properties |
| 2018 | £740,418 | -4% |
69 Properties |
| 2017 | £771,552 | 3% |
68 Properties |
| 2016 | £748,175 | 9% |
65 Properties |
| 2015 | £684,444 | 8% |
76 Properties |
| 2014 | £627,300 | 13% |
100 Properties |
| 2013 | £543,227 | -10% |
103 Properties |
| 2012 | £596,032 | 25% |
104 Properties |
| 2011 | £447,884 | -3% |
108 Properties |
| 2010 | £462,287 | 5% |
94 Properties |
| 2009 | £437,466 | -24% |
68 Properties |
| 2008 | £542,867 | 9% |
47 Properties |
| 2007 | £495,023 | 9% |
78 Properties |
| 2006 | £452,105 | 9% |
90 Properties |
| 2005 | £413,405 | 4% |
93 Properties |
| 2004 | £396,025 | 3% |
84 Properties |
| 2003 | £385,553 | 6% |
90 Properties |
| 2002 | £361,163 | 11% |
97 Properties |
| 2001 | £321,882 | 7% |
87 Properties |
| 2000 | £300,604 | 17% |
53 Properties |
| 1999 | £250,021 | 15% |
92 Properties |
| 1998 | £213,676 | 23% |
77 Properties |
| 1997 | £163,727 | 1% |
93 Properties |
| 1996 | £162,094 | 2% |
83 Properties |
| 1995 | £158,405 | - |
59 Properties |
Property Price per Property Type in Hinchley Wood
Here you can find historic sold price data in order to help with your property search.
The average Property Paid Price for specific property types in the last three years are:
| Property Type | Average Sold Price | Sold Properties |
|---|---|---|
| Semi Detached House | £1,011,606.00 | 30 Semi Detached Houses |
| Detached House | £1,167,977.00 | 79 Detached Houses |
| Terraced House | £578,428.00 | 7 Terraced Houses |
| Flat | £315,056.00 | 44 Flats |

