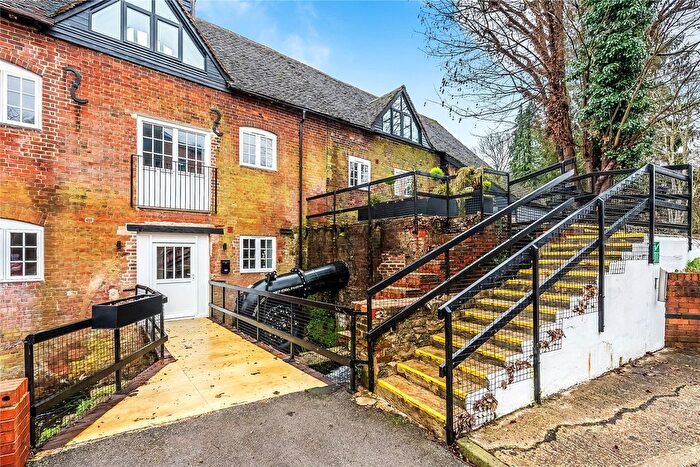
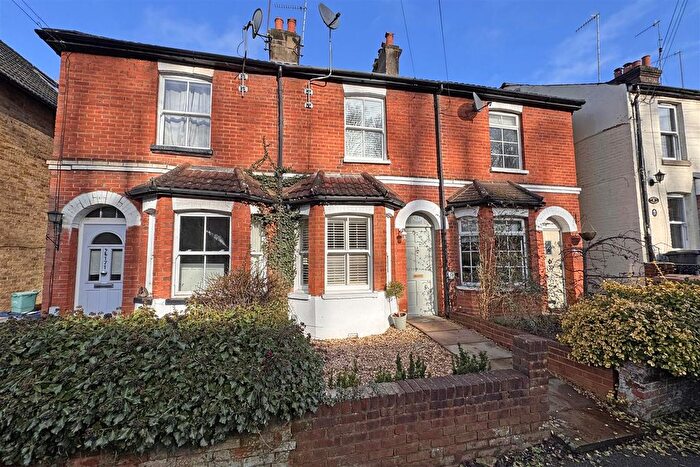
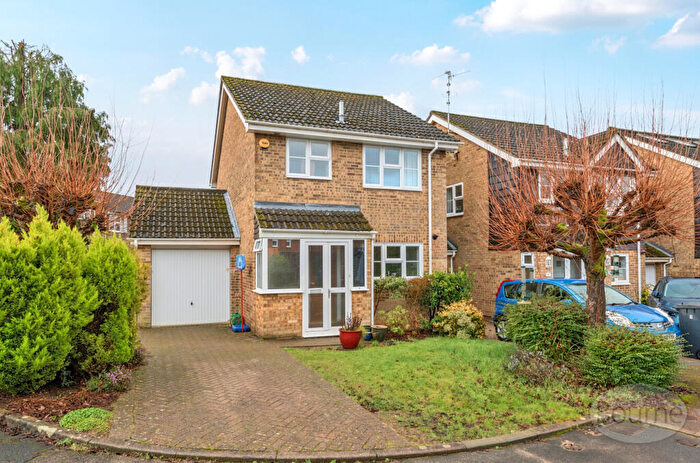
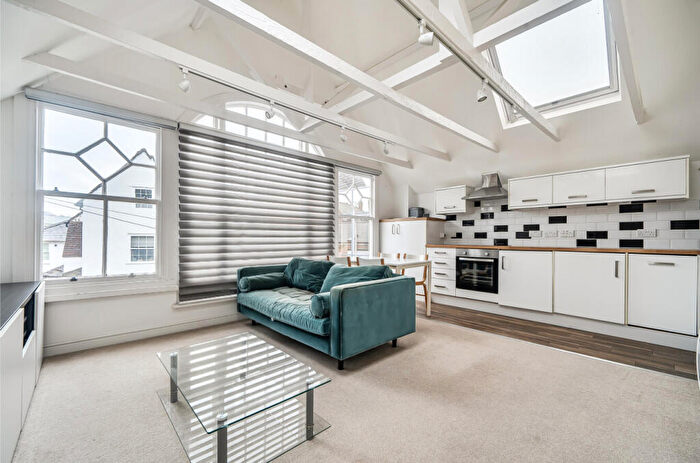
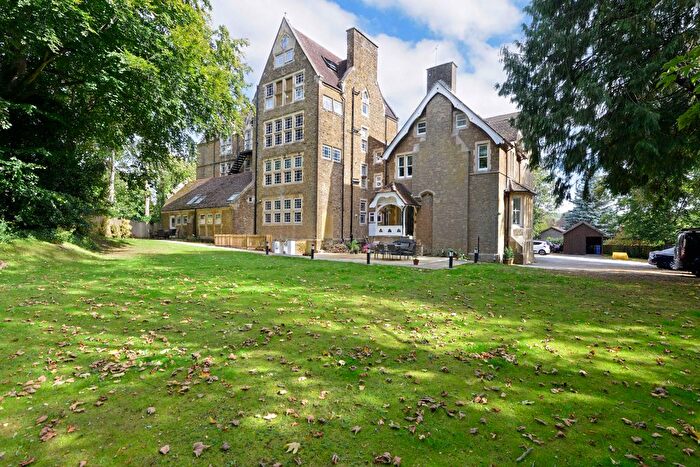
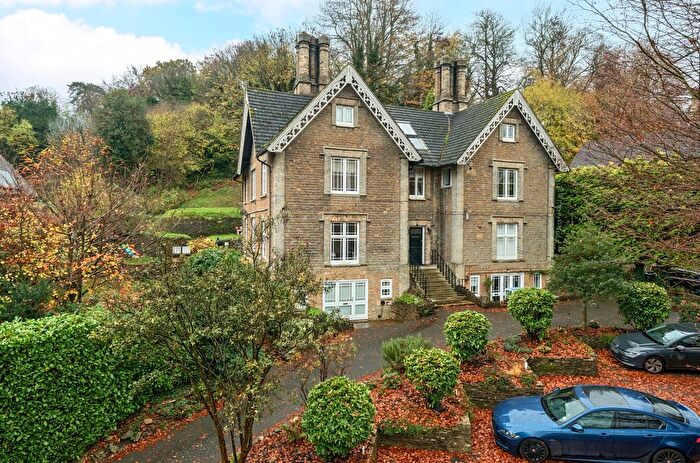
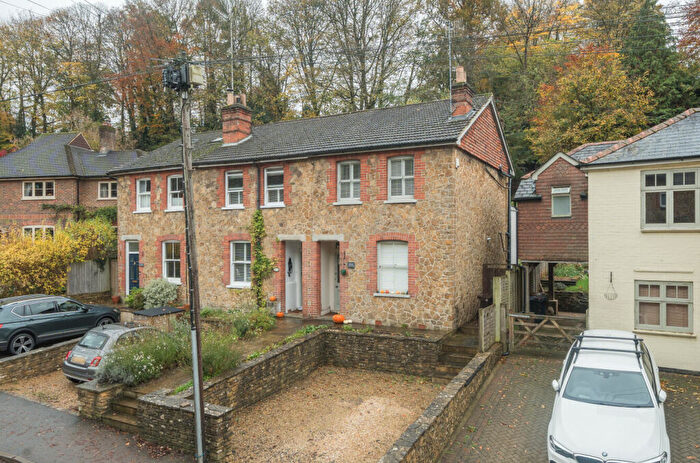
Houses for sale & to rent in Godalming Holloway, Godalming
House Prices in Godalming Holloway
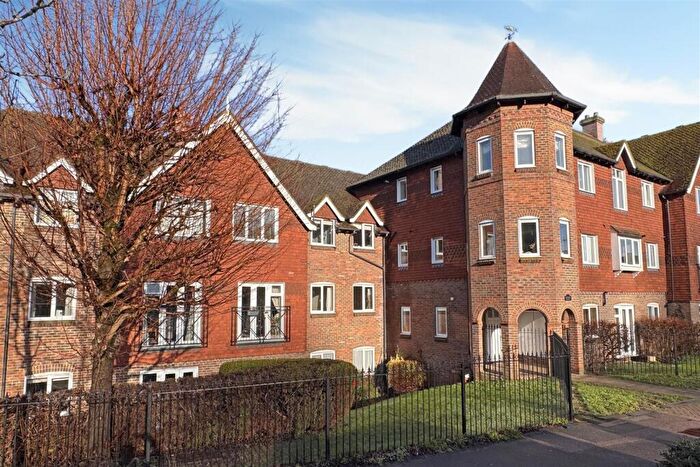
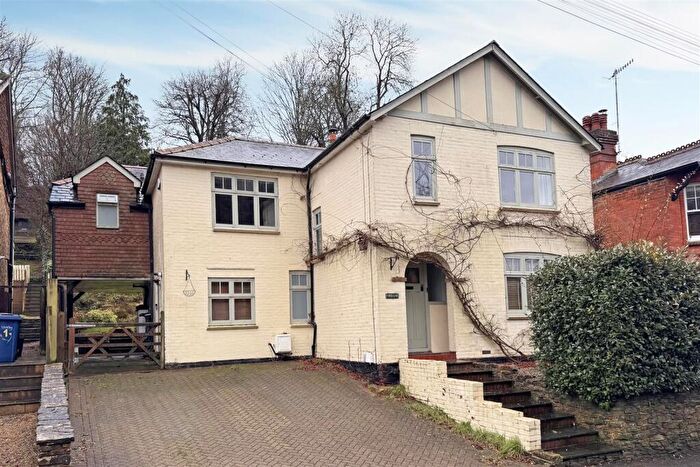
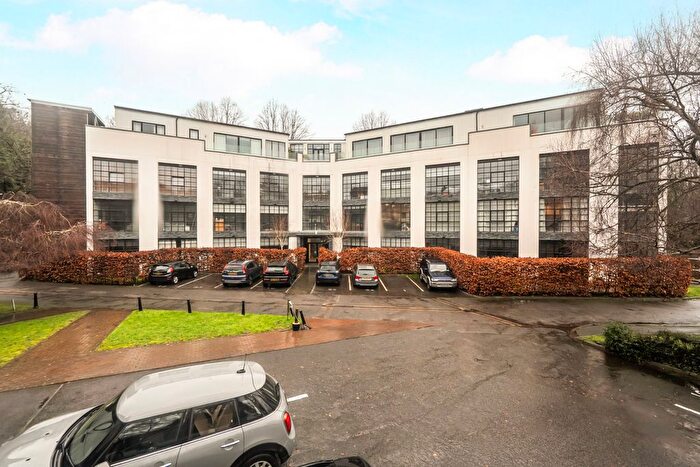
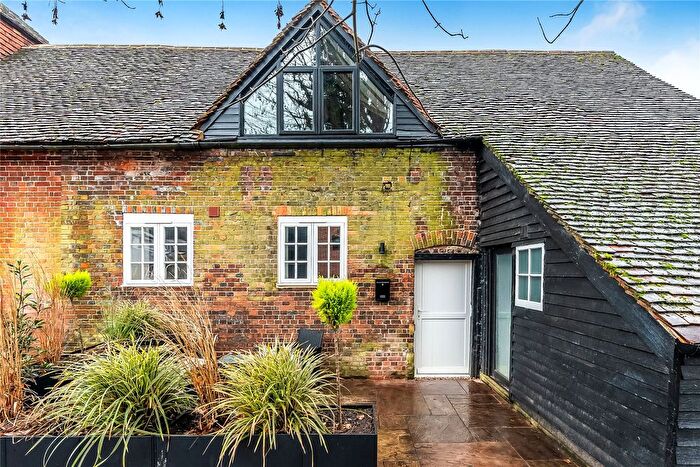
Properties in Godalming Holloway have an average house price of £741,387.00 and had 154 Property Transactions within the last 3 years¹.
Godalming Holloway is an area in Godalming, Surrey with 1,661 households², where the most expensive property was sold for £1,650,000.00.
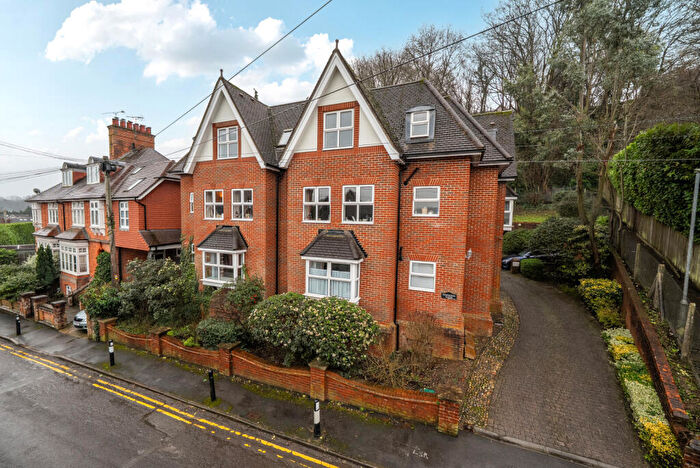
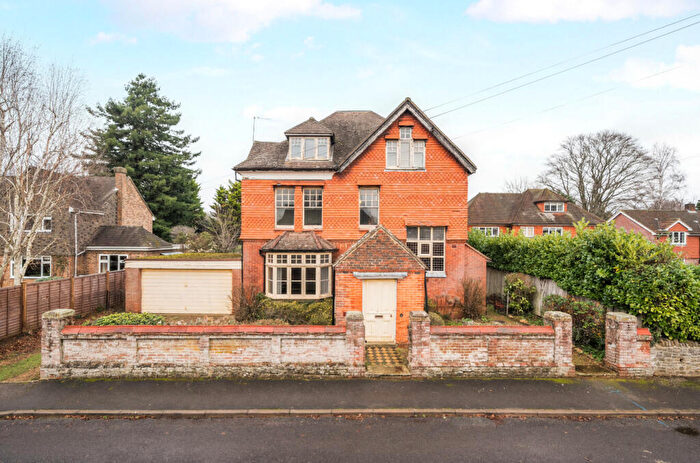
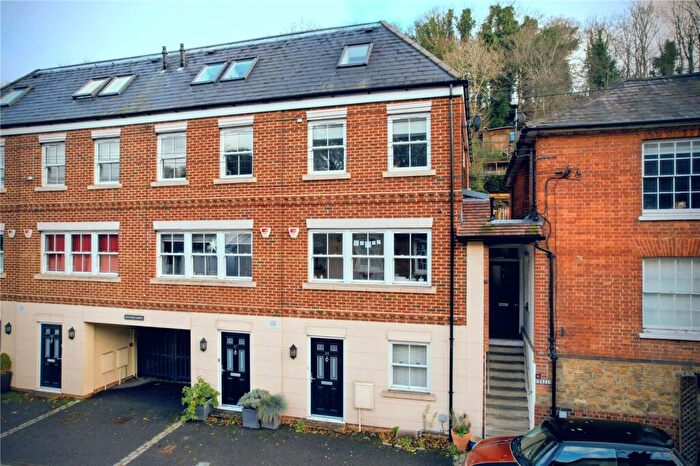
Properties for sale in Godalming Holloway
Roads and Postcodes in Godalming Holloway
Navigate through our locations to find the location of your next house in Godalming Holloway, Godalming for sale or to rent.
| Streets | Postcodes |
|---|---|
| Admiral Way | GU7 1QN |
| Alvernia Close | GU7 1YJ |
| Appletree Close | GU7 1TY |
| Ashstead Lane | GU7 1SU GU7 1SX GU7 1SY GU7 1SZ GU7 1ST |
| Beech Way | GU7 1QG |
| Birchanger | GU7 1PR |
| Blewfield | GU7 1TR |
| Braemar Close | GU7 1SA |
| Brighton Road | GU7 1NS GU7 1NT GU7 1NX GU7 1PL GU7 1PW GU7 1XA |
| Busbridge Lane | GU7 1PU GU7 1PX GU7 1QD GU7 1QH GU7 1QJ GU7 1QQ |
| Chestnut Way | GU7 1TN GU7 1TS |
| College Hill | GU7 1YA |
| Croft Road | GU7 1BS GU7 1DL GU7 1GU GU7 1HX |
| Crownpits Lane | GU7 1NY GU7 1PB |
| Duncombe Road | GU7 1SF |
| Edmunds Gate | GU7 1DH |
| Fox Dene | GU7 1YG GU7 1YQ |
| Grayling Close | GU7 1AG |
| Green Hill Close | GU7 1SD |
| Grosvenor Road | GU7 1NZ GU7 1PA |
| Hambledon Road | GU7 1PJ |
| Harvest Hill | GU7 1RU |
| Heathfield Close | GU7 1SL |
| High Ridge | GU7 1YE GU7 1YF |
| Holloway Hill | GU7 1QS GU7 1RZ |
| Home Farm Road | GU7 1TX GU7 1TU |
| Maple Hatch Close | GU7 1TH GU7 1TQ |
| Maryvale | GU7 1SW |
| Minster Road | GU7 1SP GU7 1SR |
| Oakdene Road | GU7 1QF |
| Ockford Road | GU7 1RH |
| Old Barn View | GU7 1YR |
| Old Rectory Gardens | GU7 1XB |
| Park Chase | GU7 1TL |
| Park Road | GU7 1SH GU7 1SQ |
| Parkfield | GU7 1TP |
| Phillips Close | GU7 1XZ |
| Portsmouth Road | GU7 2JP |
| Pound Lane | GU7 1BT |
| Pullman Lane | GU7 1XY GU7 1YB |
| Quartermile Road | GU7 1TG GU7 1TJ |
| Ramsden Road | GU7 1QE |
| Rectory Close | GU7 1TT |
| Shackstead Lane | GU7 1RL GU7 1RP GU7 1RW GU7 1RJ |
| Spring Copse Villas | GU7 1PN |
| Summerhouse Close | GU7 1PZ |
| Summerhouse Road | GU7 1PY GU7 1QA GU7 1QB GU7 1QL |
| The Avenue | GU7 1PE |
| The Close | GU7 1PQ |
| The Drive | GU7 1PD GU7 1PF GU7 1PH |
| The Fairway | GU7 1PG |
| The Paddock | GU7 1XD |
| Tuesley Corner | GU7 1TB |
| Tuesley Lane | GU7 1SB GU7 1SE GU7 1SG GU7 1SJ GU7 1SN GU7 1SS GU7 1RS |
| Underhill Close | GU7 1NU |
| Waterside Lane | GU7 1RN |
| Windy Wood | GU7 1XX |
Transport near Godalming Holloway
- FAQ
- Price Paid By Year
- Property Type Price
Frequently asked questions about Godalming Holloway
What is the average price for a property for sale in Godalming Holloway?
The average price for a property for sale in Godalming Holloway is £741,387. This amount is 16% higher than the average price in Godalming. There are 956 property listings for sale in Godalming Holloway.
What streets have the most expensive properties for sale in Godalming Holloway?
The streets with the most expensive properties for sale in Godalming Holloway are Oakdene Road at an average of £1,550,000, Crownpits Lane at an average of £1,230,000 and The Drive at an average of £1,227,500.
What streets have the most affordable properties for sale in Godalming Holloway?
The streets with the most affordable properties for sale in Godalming Holloway are Croft Road at an average of £365,833, Old Barn View at an average of £375,333 and High Ridge at an average of £446,694.
Which train stations are available in or near Godalming Holloway?
Some of the train stations available in or near Godalming Holloway are Godalming, Farncombe and Milford (Surrey).
Property Price Paid in Godalming Holloway by Year
The average sold property price by year was:
| Year | Average Sold Price | Price Change |
Sold Properties
|
|---|---|---|---|
| 2025 | £721,826 | 3% |
46 Properties |
| 2024 | £697,439 | -14% |
50 Properties |
| 2023 | £794,786 | 2% |
58 Properties |
| 2022 | £778,074 | 21% |
62 Properties |
| 2021 | £614,782 | 2% |
90 Properties |
| 2020 | £600,313 | -9% |
61 Properties |
| 2019 | £653,391 | -2% |
54 Properties |
| 2018 | £668,278 | 16% |
64 Properties |
| 2017 | £558,344 | -5% |
58 Properties |
| 2016 | £586,704 | -2% |
102 Properties |
| 2015 | £598,935 | 2% |
106 Properties |
| 2014 | £585,567 | 7% |
84 Properties |
| 2013 | £544,097 | 4% |
90 Properties |
| 2012 | £522,808 | 5% |
62 Properties |
| 2011 | £497,301 | 12% |
69 Properties |
| 2010 | £437,928 | 4% |
69 Properties |
| 2009 | £418,650 | -4% |
51 Properties |
| 2008 | £436,885 | -5% |
62 Properties |
| 2007 | £458,536 | 14% |
116 Properties |
| 2006 | £394,984 | 1% |
105 Properties |
| 2005 | £392,760 | 19% |
86 Properties |
| 2004 | £316,877 | -5% |
102 Properties |
| 2003 | £331,914 | 4% |
97 Properties |
| 2002 | £317,255 | 9% |
81 Properties |
| 2001 | £287,611 | 18% |
100 Properties |
| 2000 | £237,172 | 19% |
98 Properties |
| 1999 | £191,453 | 4% |
110 Properties |
| 1998 | £183,957 | 21% |
88 Properties |
| 1997 | £145,067 | 4% |
103 Properties |
| 1996 | £138,817 | 0,3% |
109 Properties |
| 1995 | £138,374 | - |
78 Properties |
Property Price per Property Type in Godalming Holloway
Here you can find historic sold price data in order to help with your property search.
The average Property Paid Price for specific property types in the last three years are:
| Property Type | Average Sold Price | Sold Properties |
|---|---|---|
| Semi Detached House | £807,778.00 | 21 Semi Detached Houses |
| Detached House | £953,154.00 | 78 Detached Houses |
| Terraced House | £466,665.00 | 36 Terraced Houses |
| Flat | £319,171.00 | 19 Flats |

