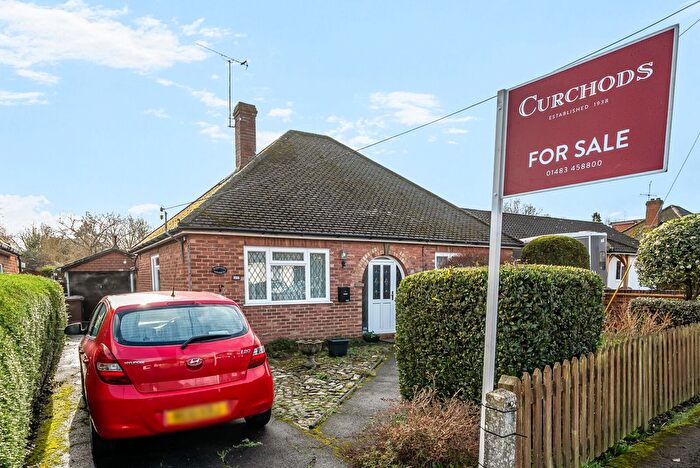
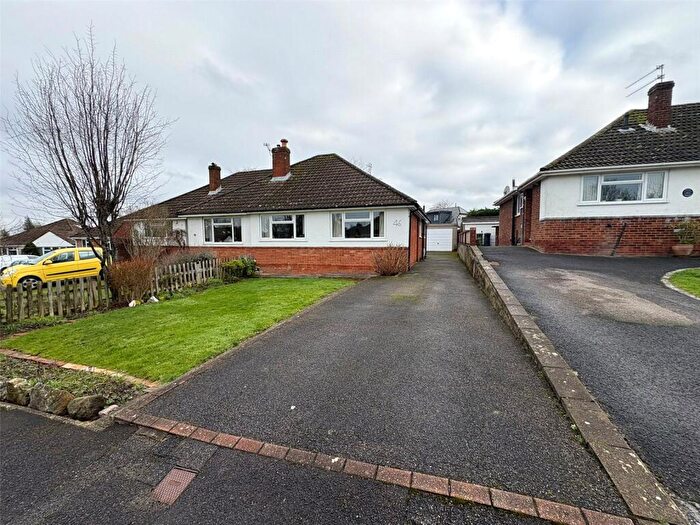
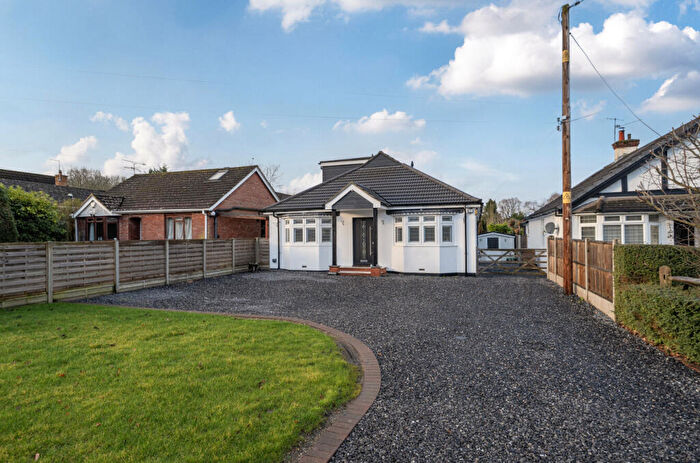
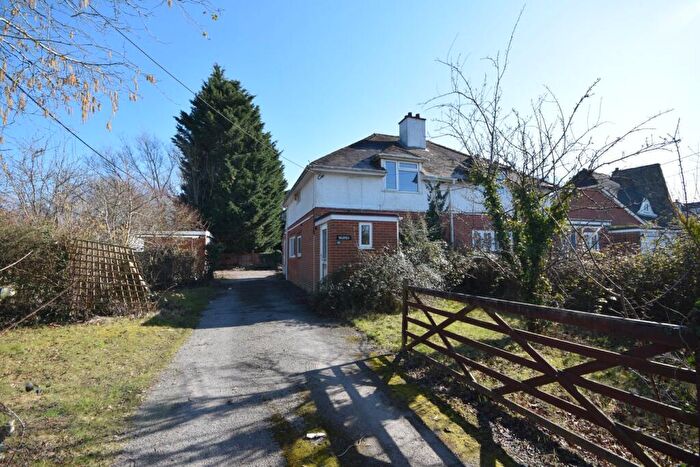
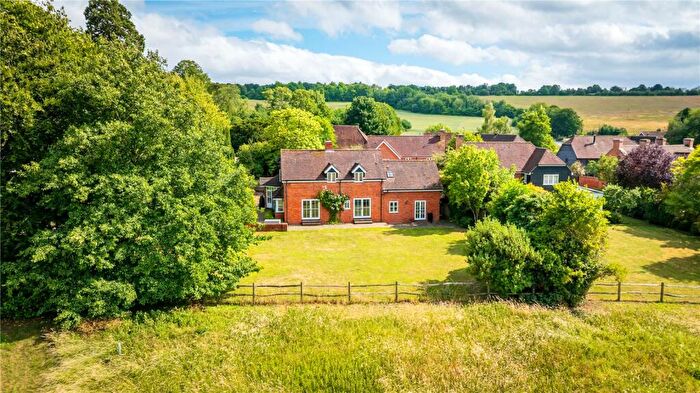
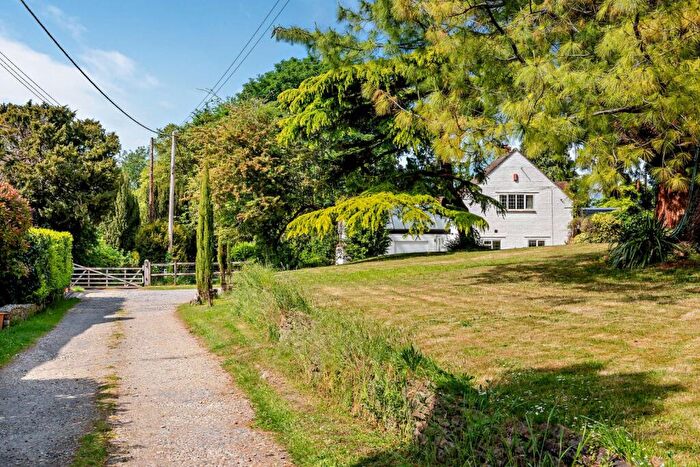
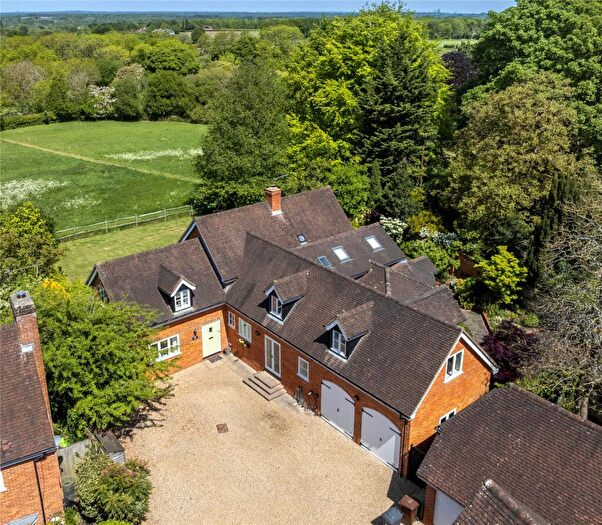
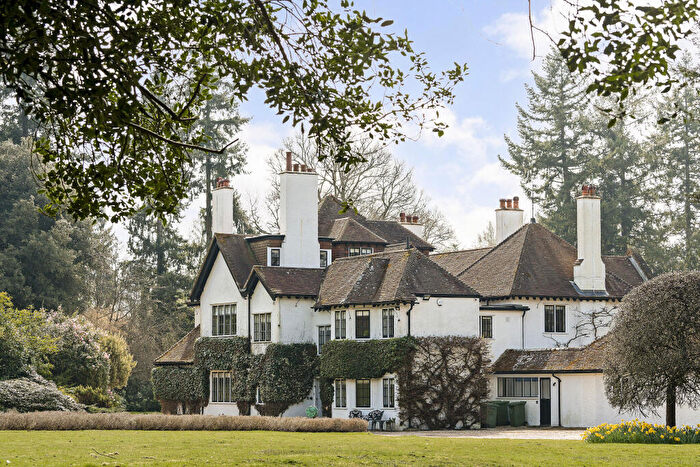
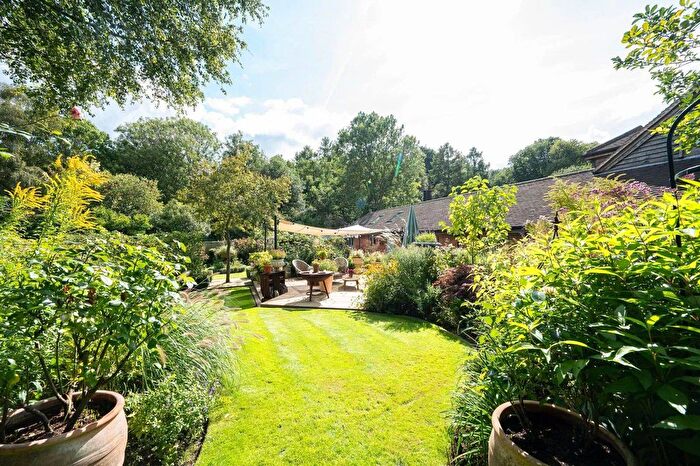
Houses for sale & to rent in Pilgrims, Guildford
House Prices in Pilgrims
Properties in Pilgrims have an average house price of £845,357.00 and had 14 Property Transactions within the last 3 years¹.
Pilgrims is an area in Guildford, Surrey with 337 households², where the most expensive property was sold for £1,930,000.00.
Properties for sale in Pilgrims
Previously listed properties in Pilgrims
Roads and Postcodes in Pilgrims
Navigate through our locations to find the location of your next house in Pilgrims, Guildford for sale or to rent.
| Streets | Postcodes |
|---|---|
| By Pass | GU3 1DT |
| Dark Lane | GU3 1AY |
| East Flexford Lane | GU3 2JP |
| Heyworth Business Park | GU3 1BL |
| Highfield Lane | GU3 1BB |
| Hogs Back | GU3 1AG GU3 1AQ |
| Hook Lane | GU3 1AN |
| Hops End | GU3 1AE |
| Lascombe Lane | GU3 1BA |
| Manor Cottages | GU3 1AW |
| Monks Grove | GU3 1DZ GU3 1EA |
| Mundays Boro Road | GU3 1AZ GU3 1BH |
| Old Portsmouth Road | GU3 1AF |
| Puttenham Heath Road | GU3 1AJ GU3 1AP GU3 1DU |
| Puttenham Hill | GU3 1AH |
| Rodsall Lane | GU3 1BE |
| School Lane | GU3 1AS |
| Seale Lane | GU3 1AX |
| Suffield Lane | GU3 1BD GU3 1BG GU3 1BQ |
| The Heath | GU3 1AL |
| The Street | GU3 1AR GU3 1AT GU3 1AU |
| Wanborough Business Centre | GU3 2JS |
| Wanborough Common | GU3 1DX |
| West Flexford Lane | GU3 2JW |
| Westwood Lane | GU3 2JN |
| GU3 2JR GU3 1AD |
Transport near Pilgrims
-
Wanborough Station
-
Ash Station
-
Farncombe Station
-
Godalming Station
-
Guildford Station
-
Milford (Surrey) Station
-
Ash Vale Station
-
Shalford Station
-
Aldershot Station
-
London Road Guildford Station
- FAQ
- Price Paid By Year
- Property Type Price
Frequently asked questions about Pilgrims
What is the average price for a property for sale in Pilgrims?
The average price for a property for sale in Pilgrims is £845,357. This amount is 37% higher than the average price in Guildford. There are 338 property listings for sale in Pilgrims.
What streets have the most expensive properties for sale in Pilgrims?
The streets with the most expensive properties for sale in Pilgrims are Westwood Lane at an average of £1,930,000, School Lane at an average of £1,290,000 and Hops End at an average of £720,000.
What streets have the most affordable properties for sale in Pilgrims?
The streets with the most affordable properties for sale in Pilgrims are Mundays Boro Road at an average of £543,000, The Street at an average of £557,333 and Lascombe Lane at an average of £630,000.
Which train stations are available in or near Pilgrims?
Some of the train stations available in or near Pilgrims are Wanborough, Ash and Farncombe.
Property Price Paid in Pilgrims by Year
The average sold property price by year was:
| Year | Average Sold Price | Price Change |
Sold Properties
|
|---|---|---|---|
| 2025 | £780,000 | -19% |
3 Properties |
| 2024 | £925,833 | 15% |
6 Properties |
| 2023 | £788,000 | 13% |
5 Properties |
| 2022 | £683,710 | -55% |
11 Properties |
| 2021 | £1,058,166 | 10% |
27 Properties |
| 2020 | £948,125 | 7% |
10 Properties |
| 2019 | £882,000 | 1% |
5 Properties |
| 2018 | £876,807 | 3% |
19 Properties |
| 2017 | £847,500 | 25% |
10 Properties |
| 2016 | £632,833 | -20% |
12 Properties |
| 2015 | £756,718 | -9% |
11 Properties |
| 2014 | £827,635 | 21% |
16 Properties |
| 2013 | £652,000 | -39% |
3 Properties |
| 2012 | £905,125 | 6% |
12 Properties |
| 2011 | £852,800 | 24% |
10 Properties |
| 2010 | £651,639 | -18% |
14 Properties |
| 2009 | £768,666 | -26% |
12 Properties |
| 2008 | £965,375 | 38% |
10 Properties |
| 2007 | £596,156 | -15% |
16 Properties |
| 2006 | £684,892 | 16% |
14 Properties |
| 2005 | £578,493 | 25% |
8 Properties |
| 2004 | £433,772 | -38% |
11 Properties |
| 2003 | £599,163 | 27% |
15 Properties |
| 2002 | £439,495 | 16% |
12 Properties |
| 2001 | £368,388 | -45% |
9 Properties |
| 2000 | £534,500 | 34% |
11 Properties |
| 1999 | £350,115 | 11% |
13 Properties |
| 1998 | £312,625 | 4% |
8 Properties |
| 1997 | £298,692 | 45% |
27 Properties |
| 1996 | £164,853 | -11% |
14 Properties |
| 1995 | £182,975 | - |
12 Properties |
Property Price per Property Type in Pilgrims
Here you can find historic sold price data in order to help with your property search.
The average Property Paid Price for specific property types in the last three years are:
| Property Type | Average Sold Price | Sold Properties |
|---|---|---|
| Semi Detached House | £648,250.00 | 4 Semi Detached Houses |
| Terraced House | £524,000.00 | 3 Terraced Houses |
| Detached House | £1,095,714.00 | 7 Detached Houses |

