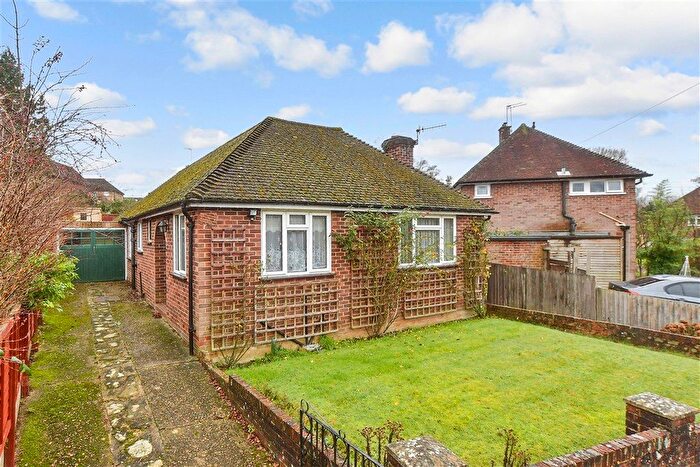
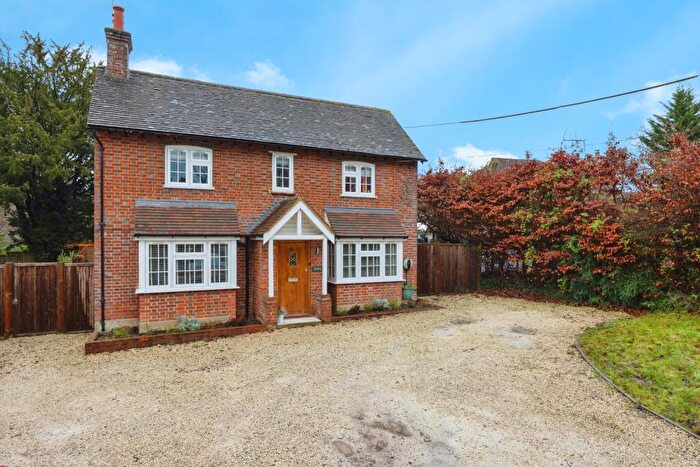
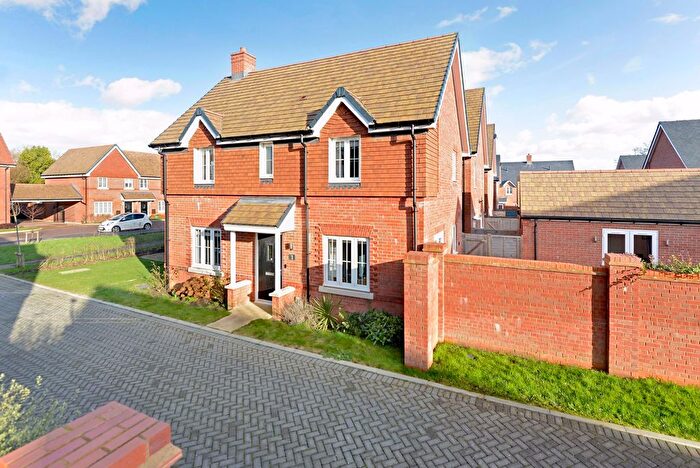
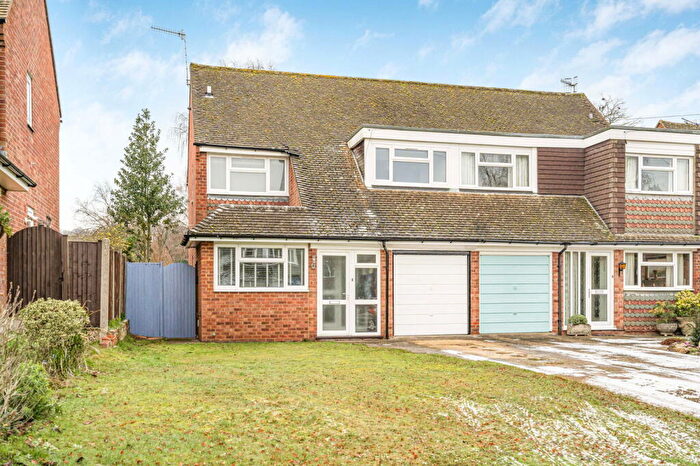
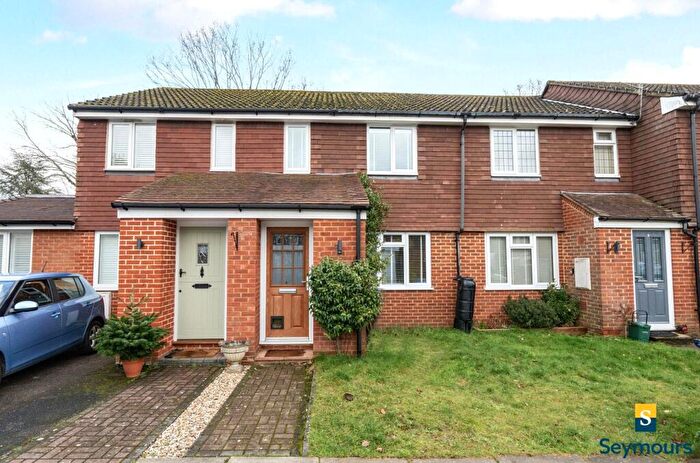
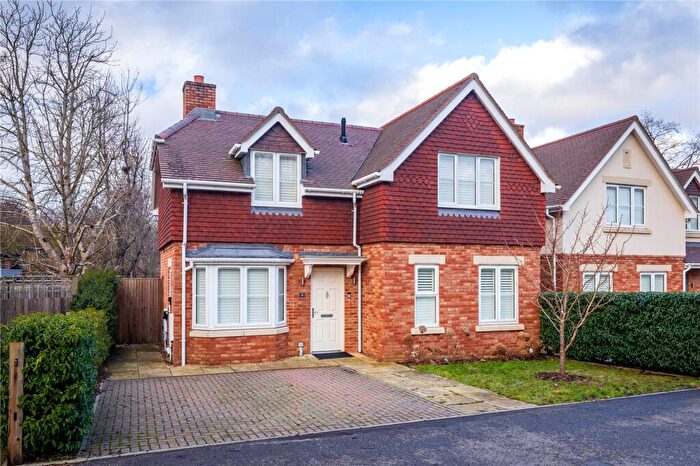
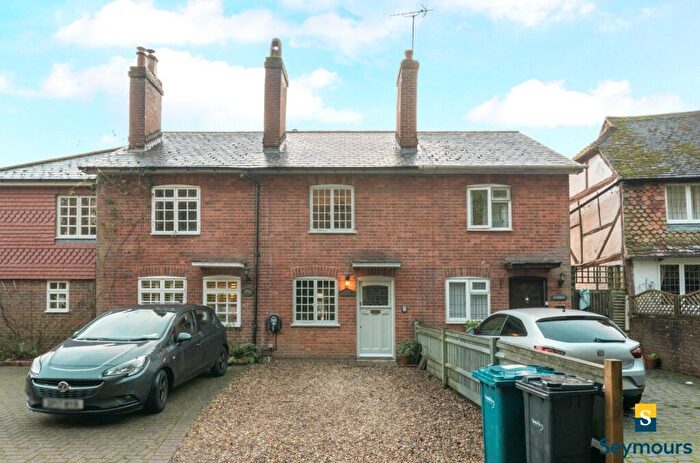
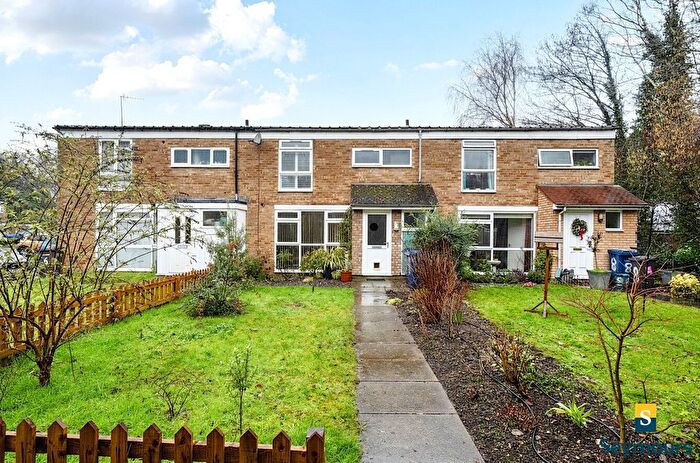
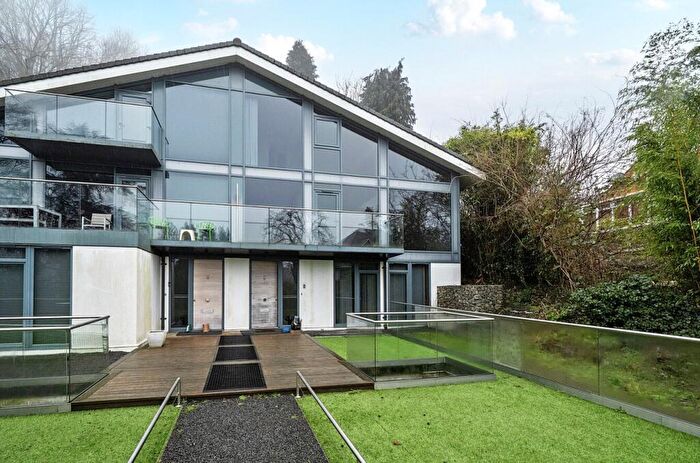
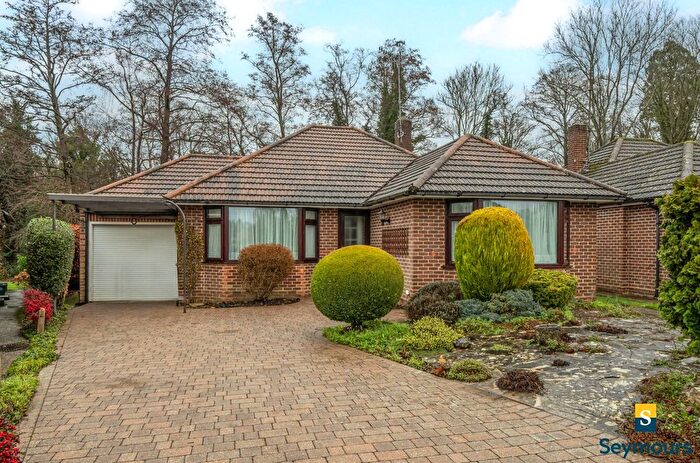
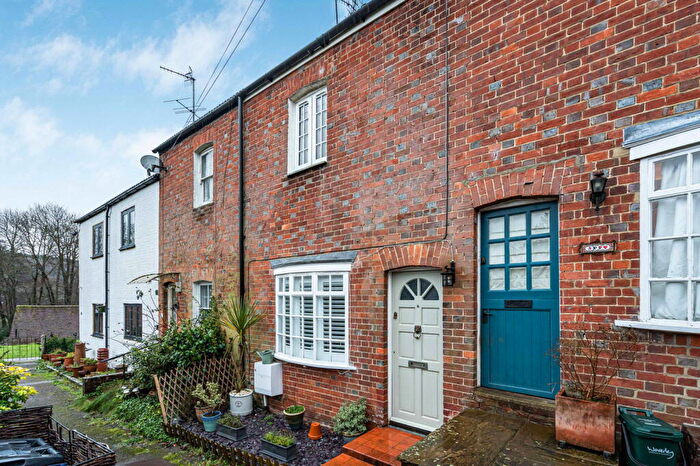
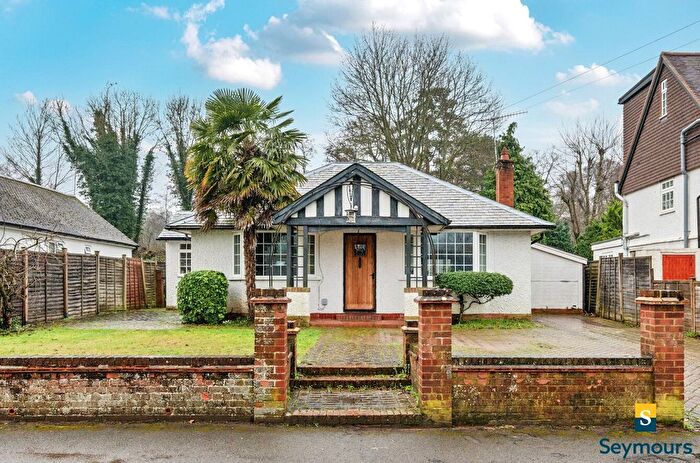
Houses for sale & to rent in Shamley Green And Cranleigh North, Guildford
House Prices in Shamley Green And Cranleigh North
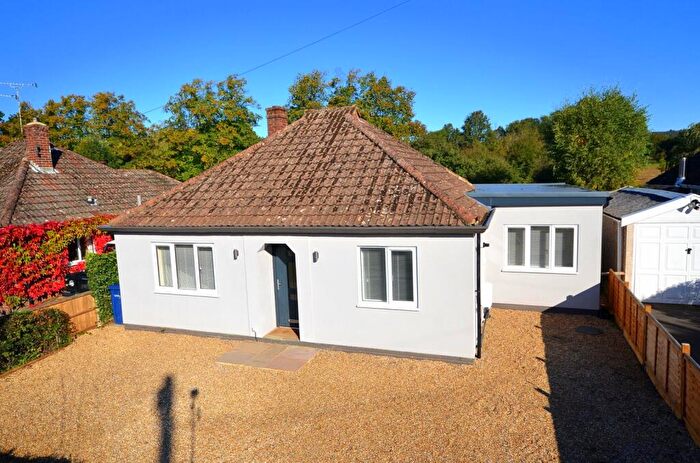
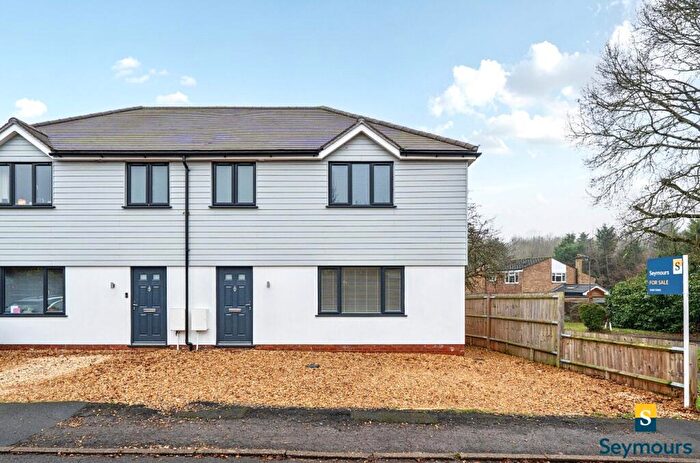
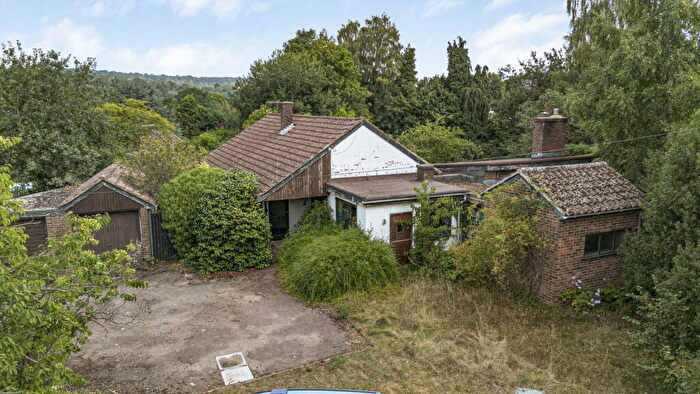
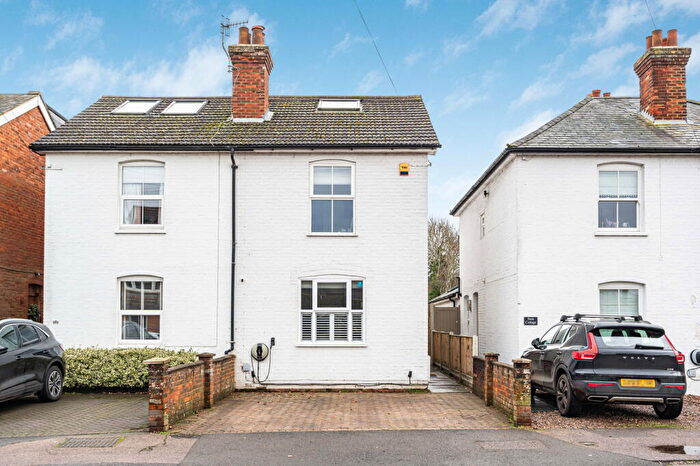
Properties in Shamley Green And Cranleigh North have an average house price of £855,170.00 and had 50 Property Transactions within the last 3 years¹.
Shamley Green And Cranleigh North is an area in Guildford, Surrey with 600 households², where the most expensive property was sold for £6,000,000.00.
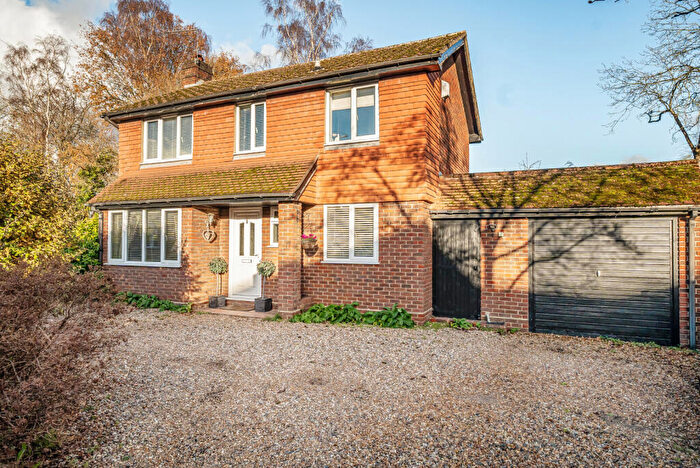
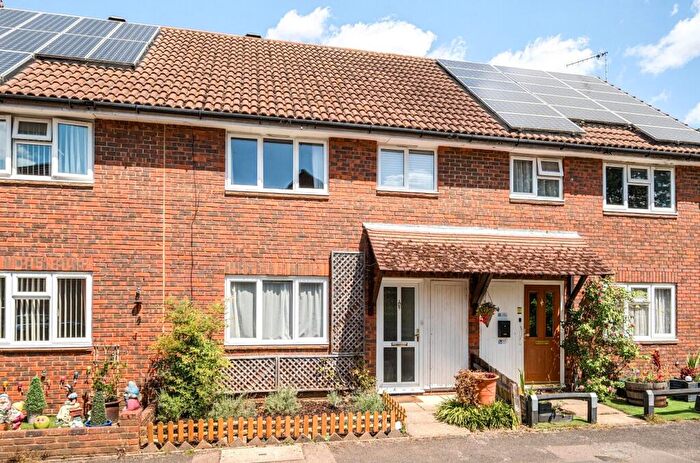
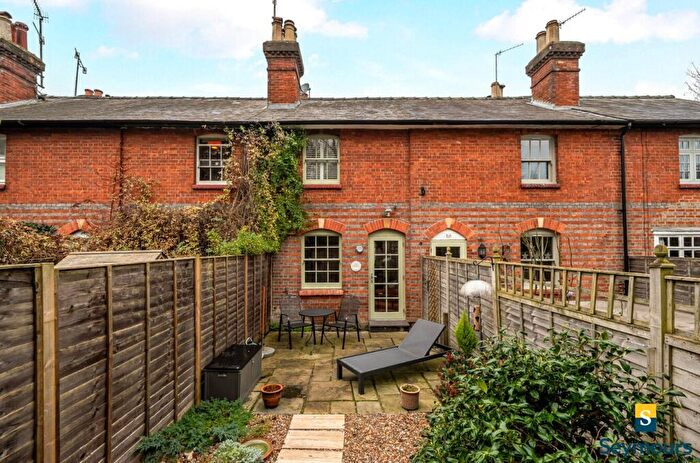
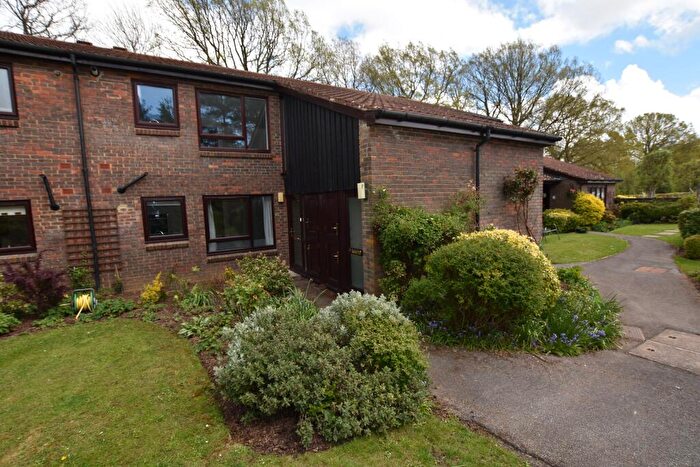
Properties for sale in Shamley Green And Cranleigh North
Roads and Postcodes in Shamley Green And Cranleigh North
Navigate through our locations to find the location of your next house in Shamley Green And Cranleigh North, Guildford for sale or to rent.
| Streets | Postcodes |
|---|---|
| Church Hill | GU5 0UD |
| East Whipley Lane | GU5 0TD |
| Firs Lane | GU5 0UU GU5 0UT |
| Garden Close | GU5 0UW |
| Guildford Road | GU5 0RS GU5 0RT GU5 0SQ |
| High Croft | GU5 0UE |
| Hullbrook Lane | GU5 0UQ GU5 0NQ |
| Hullmead | GU5 0UF GU5 0UG |
| Lake Cottages | GU5 0UJ |
| Long Common | GU5 0TF GU5 0TG |
| Lords Hill Common | GU5 0TJ GU5 0TL GU5 0UZ |
| Lords Hill Cottages | GU5 0TH |
| Madgehole Lane | GU5 0SS |
| New Cottages | GU5 0TA |
| Norley Common | GU5 0PD |
| Nursery Close | GU5 0AF |
| Nursery Hill | GU5 0UL GU5 0UN |
| Palmers Cross | GU5 0LL |
| Pepperbox Lane | GU5 0LW |
| Row Lane | GU5 9EN |
| Run Common | GU5 0SY |
| Shamley Green | GU5 0WR GU5 0XB GU5 0XD |
| Stonards Brow | GU5 0UX GU5 0UY |
| Stroud Common | GU5 0SZ GU5 0TB |
| Stroud Lane | GU5 0ST |
| Sweet Water Close | GU5 0UR |
| Sweetwater Lane | GU5 0UP |
| The Green | GU5 0UA GU5 0UB GU5 0UH |
| Upper House Lane | GU5 0SX |
| Willinghurst Estate | GU5 0SU |
| Woodhill Lane | GU5 0SP GU5 0SR |
Transport near Shamley Green And Cranleigh North
-
Chilworth Station
-
Shalford Station
-
Farncombe Station
-
Godalming Station
-
Gomshall Station
-
London Road Guildford Station
-
Guildford Station
- FAQ
- Price Paid By Year
- Property Type Price
Frequently asked questions about Shamley Green And Cranleigh North
What is the average price for a property for sale in Shamley Green And Cranleigh North?
The average price for a property for sale in Shamley Green And Cranleigh North is £855,170. This amount is 39% higher than the average price in Guildford. There are 1,278 property listings for sale in Shamley Green And Cranleigh North.
What streets have the most expensive properties for sale in Shamley Green And Cranleigh North?
The streets with the most expensive properties for sale in Shamley Green And Cranleigh North are Long Common at an average of £6,000,000, Norley Common at an average of £1,387,500 and Lords Hill Common at an average of £1,088,750.
What streets have the most affordable properties for sale in Shamley Green And Cranleigh North?
The streets with the most affordable properties for sale in Shamley Green And Cranleigh North are Garden Close at an average of £377,333, Hullmead at an average of £510,388 and Nursery Hill at an average of £572,500.
Which train stations are available in or near Shamley Green And Cranleigh North?
Some of the train stations available in or near Shamley Green And Cranleigh North are Chilworth, Shalford and Farncombe.
Property Price Paid in Shamley Green And Cranleigh North by Year
The average sold property price by year was:
| Year | Average Sold Price | Price Change |
Sold Properties
|
|---|---|---|---|
| 2025 | £741,375 | -37% |
16 Properties |
| 2024 | £1,017,552 | 24% |
19 Properties |
| 2023 | £770,866 | -35% |
15 Properties |
| 2022 | £1,040,312 | -34% |
16 Properties |
| 2021 | £1,398,791 | 37% |
24 Properties |
| 2020 | £879,797 | 21% |
13 Properties |
| 2019 | £698,535 | -38% |
14 Properties |
| 2018 | £960,775 | 5% |
26 Properties |
| 2017 | £910,384 | 47% |
13 Properties |
| 2016 | £479,071 | -44% |
14 Properties |
| 2015 | £688,312 | 12% |
24 Properties |
| 2014 | £603,575 | -7% |
10 Properties |
| 2013 | £646,571 | 2% |
21 Properties |
| 2012 | £633,086 | 4% |
23 Properties |
| 2011 | £606,864 | -75% |
18 Properties |
| 2010 | £1,060,147 | 59% |
20 Properties |
| 2009 | £431,205 | -51% |
20 Properties |
| 2008 | £650,100 | 10% |
15 Properties |
| 2007 | £585,352 | 35% |
38 Properties |
| 2006 | £380,881 | 7% |
22 Properties |
| 2005 | £354,496 | -50% |
15 Properties |
| 2004 | £533,305 | 25% |
17 Properties |
| 2003 | £398,695 | 15% |
24 Properties |
| 2002 | £337,214 | 6% |
21 Properties |
| 2001 | £318,249 | -18% |
18 Properties |
| 2000 | £374,492 | 22% |
21 Properties |
| 1999 | £292,814 | 24% |
41 Properties |
| 1998 | £222,286 | 15% |
19 Properties |
| 1997 | £188,423 | 7% |
23 Properties |
| 1996 | £175,822 | 13% |
22 Properties |
| 1995 | £153,807 | - |
13 Properties |
Property Price per Property Type in Shamley Green And Cranleigh North
Here you can find historic sold price data in order to help with your property search.
The average Property Paid Price for specific property types in the last three years are:
| Property Type | Average Sold Price | Sold Properties |
|---|---|---|
| Semi Detached House | £647,522.00 | 22 Semi Detached Houses |
| Detached House | £1,188,550.00 | 20 Detached Houses |
| Terraced House | £592,750.00 | 8 Terraced Houses |

