
Houses for sale & to rent in GU27 3RY, Upper School Drive, Fernhurst, Haslemere
House Prices in GU27 3RY, Upper School Drive, Fernhurst
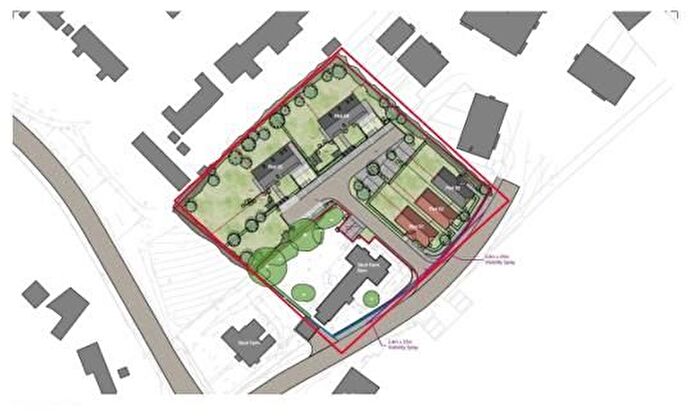
Properties in GU27 3RY have no sales history available within the last 3 years. GU27 3RY is a postcode in Upper School Drive located in Fernhurst, an area in Haslemere, Surrey, with 4 households².
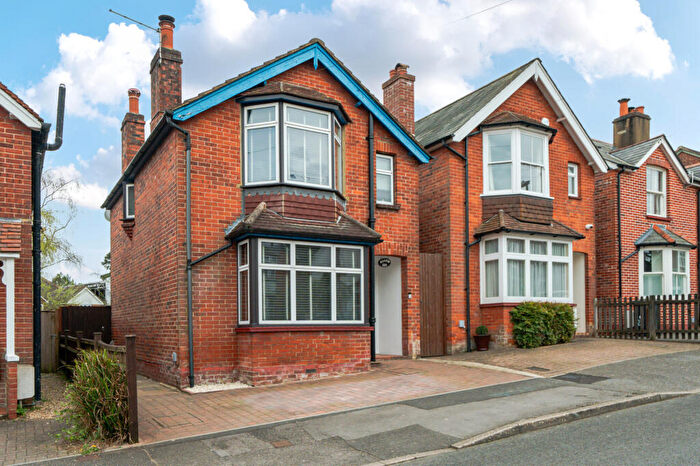
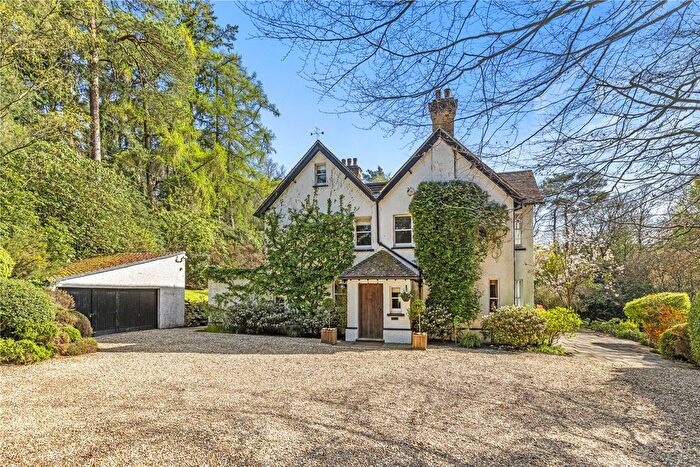
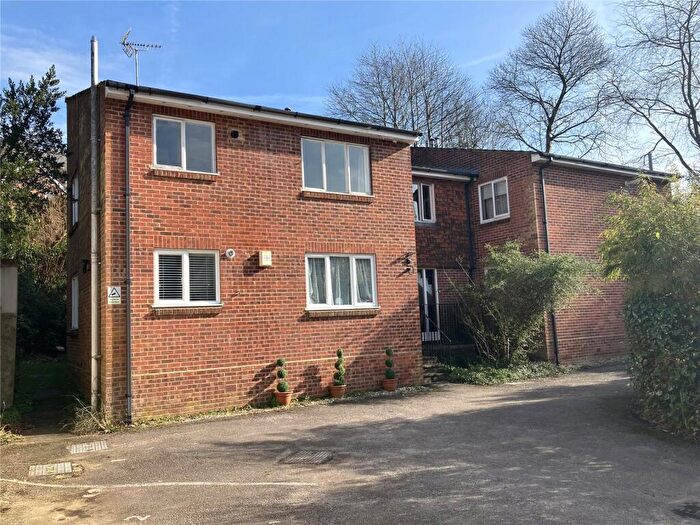
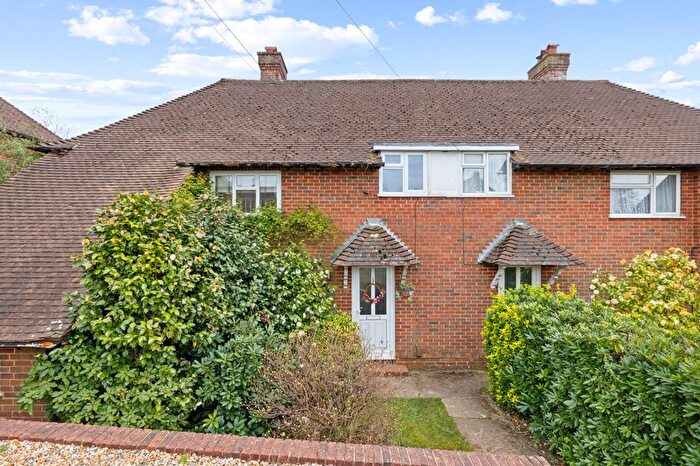
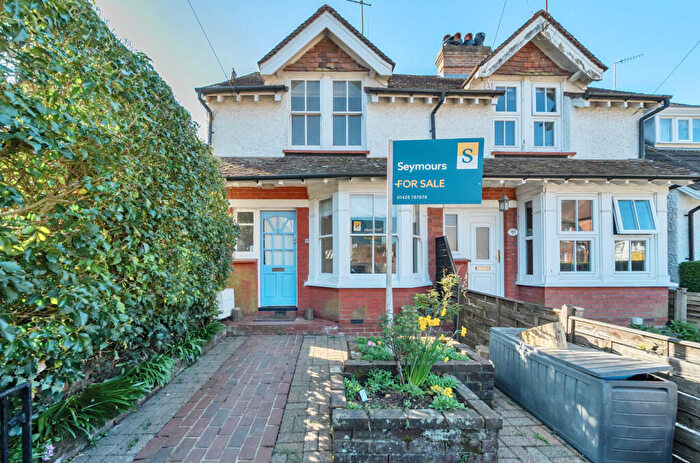
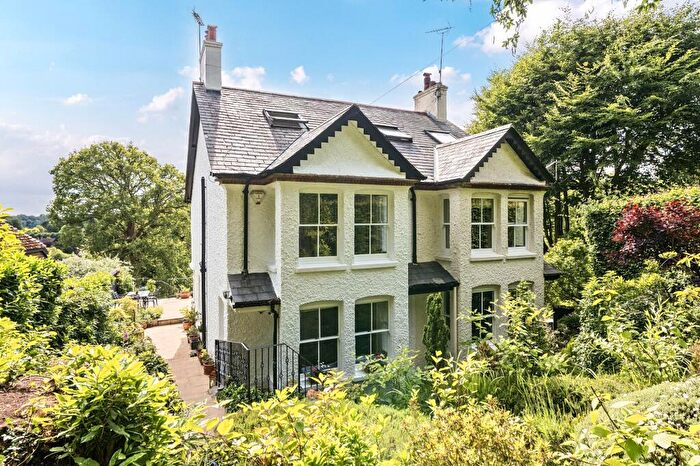
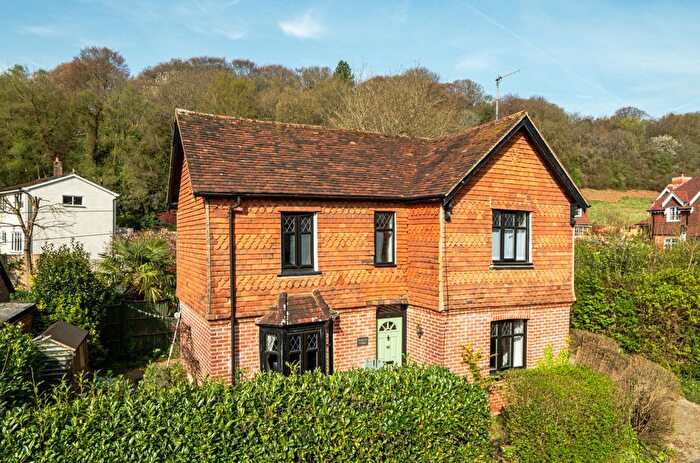
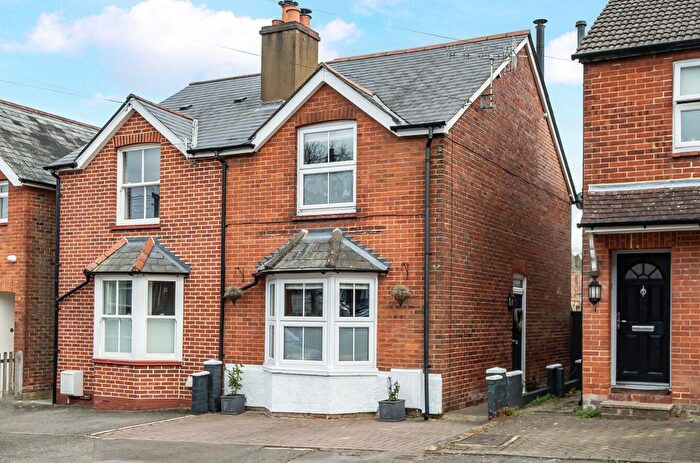
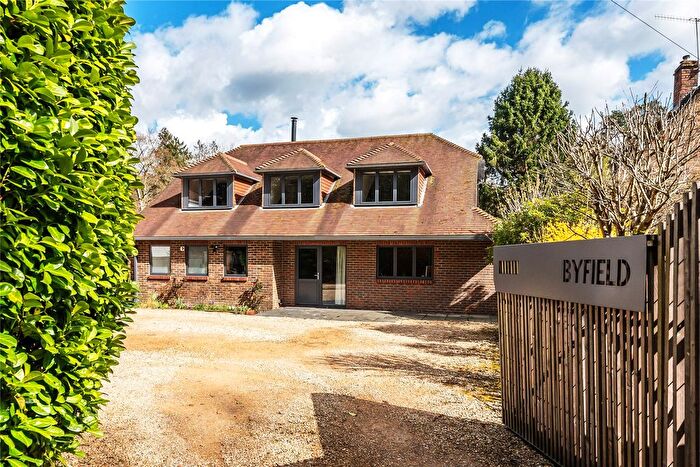
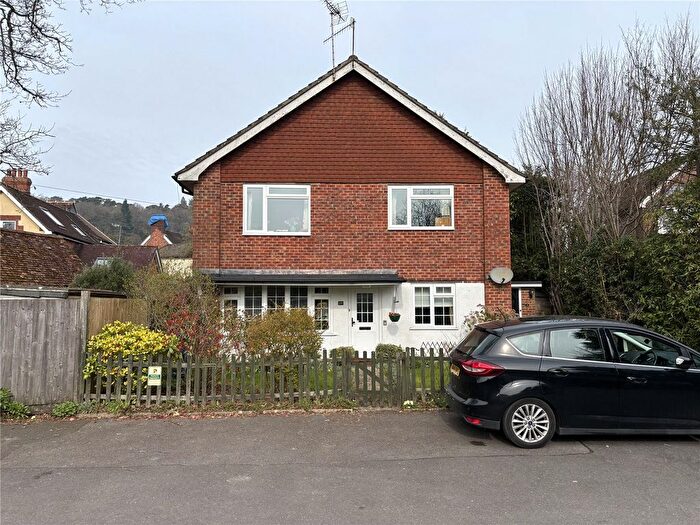
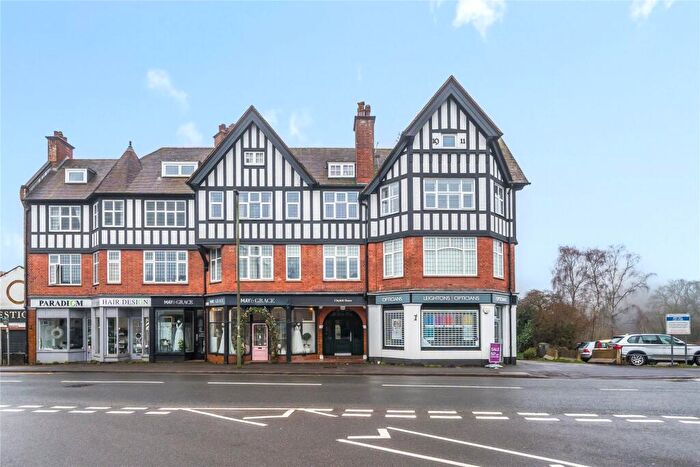
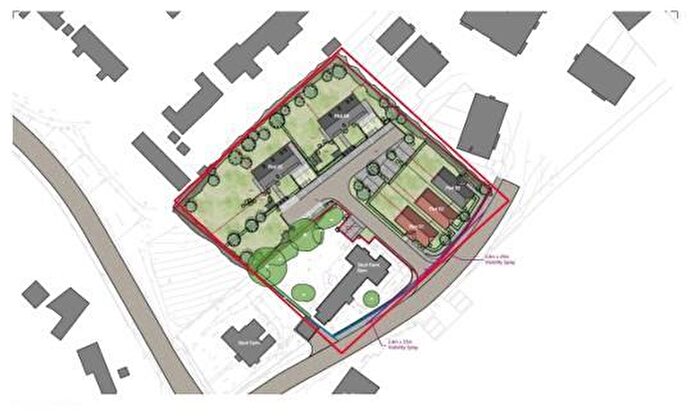
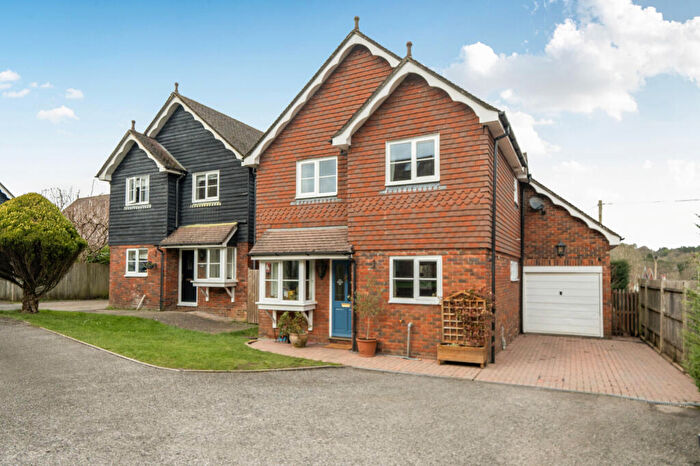
Properties for sale near GU27 3RY, Upper School Drive


![]()
If you are looking to sell your house, let it out, or receive a property valuation, an expert can help you.
Click the button below to get started.


Price Paid in Upper School Drive, GU27 3RY, Fernhurst
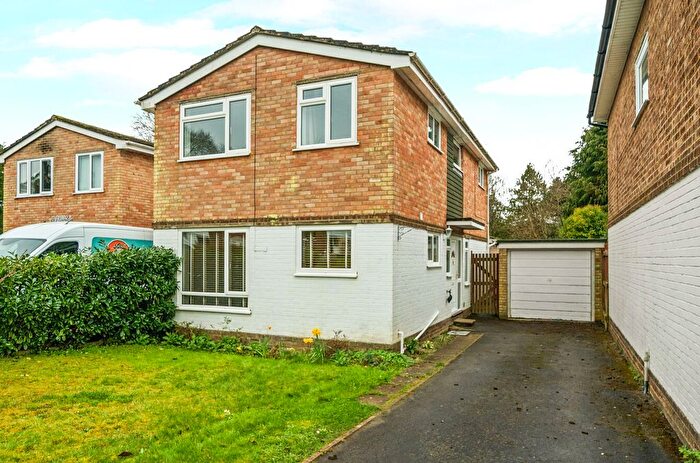
4 Upper School Drive, GU27 3RY, Fernhurst Haslemere
Property 4 has been sold 3 times. The last time it was sold was in 01/03/2021 and the sold price was £720,000.00.
This detached house, sold as a freehold on 01/03/2021, is a 141 sqm detached house with an EPC rating of C.
| Date | Price | Property Type | Tenure | Classification |
|---|---|---|---|---|
| 01/03/2021 | £720,000.00 | Detached House | freehold | Established Building |
| 06/10/2015 | £500,000.00 | Detached House | freehold | Established Building |
| 28/05/1997 | £141,000.00 | Detached House | freehold | Established Building |
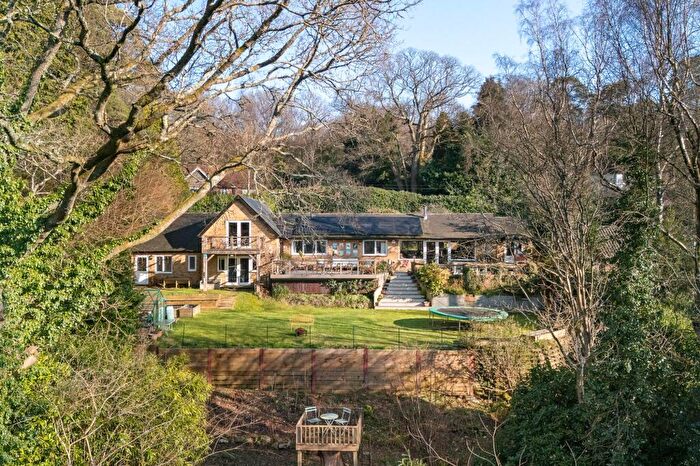
3 Upper School Drive, GU27 3RY, Fernhurst Haslemere
Property 3 has been sold 2 times. The last time it was sold was in 30/06/2016 and the sold price was £650,000.00.
This detached house, sold as a freehold on 30/06/2016, is a 138 sqm detached house with an EPC rating of E.
| Date | Price | Property Type | Tenure | Classification |
|---|---|---|---|---|
| 30/06/2016 | £650,000.00 | Detached House | freehold | Established Building |
| 05/11/2010 | £440,000.00 | Detached House | freehold | Established Building |
Transport near GU27 3RY, Upper School Drive
-
 Haslemere Station
 -
Liphook Station
-
Witley Station
-
Milford (Surrey) Station
-
Liss Station
-
Godalming Station
-
Bentley Station
-
Farnham Station
-
Farncombe Station
House price paid reports for GU27 3RY, Upper School Drive
Click on the buttons below to see price paid reports by year or property price:
- Price Paid By Year
Property Price Paid in GU27 3RY, Upper School Drive by Year
The average sold property price by year was:
| Year | Average Sold Price | Price Change |
Sold Properties
|
|---|---|---|---|
| 2021 | £720,000 | 10% |
1 Property |
| 2016 | £650,000 | 23% |
1 Property |
| 2015 | £500,000 | 12% |
1 Property |
| 2010 | £440,000 | 68% |
1 Property |
| 1997 | £141,000 | - |
1 Property |