
Houses for sale & to rent in Plaistow, Haslemere
House Prices in Plaistow
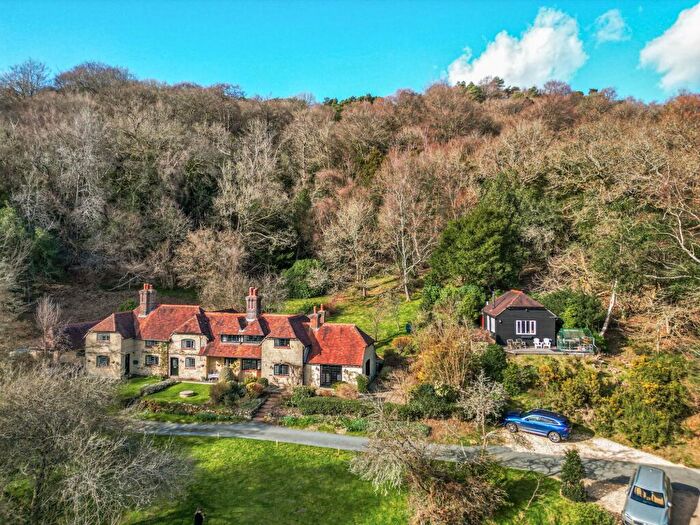
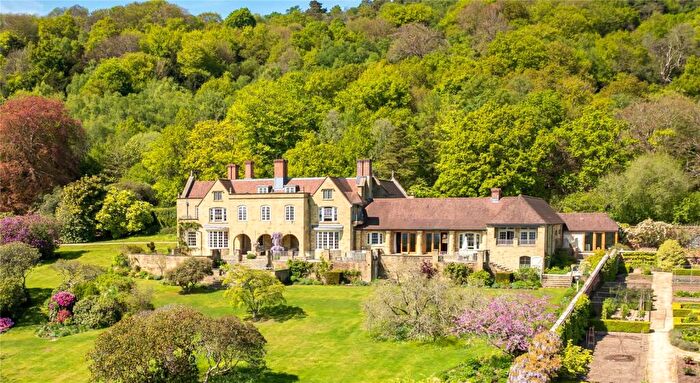
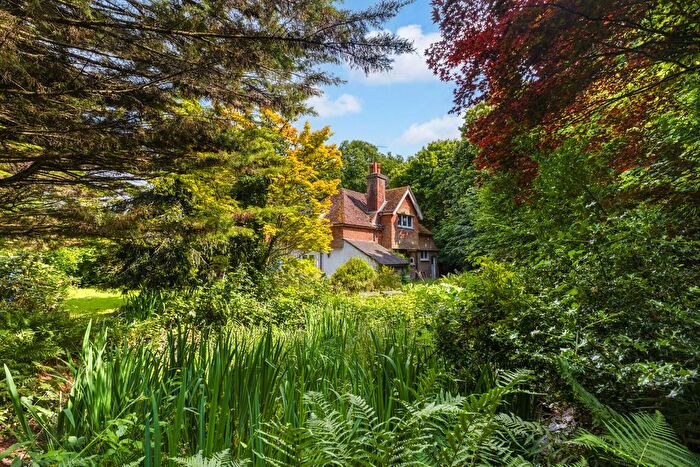
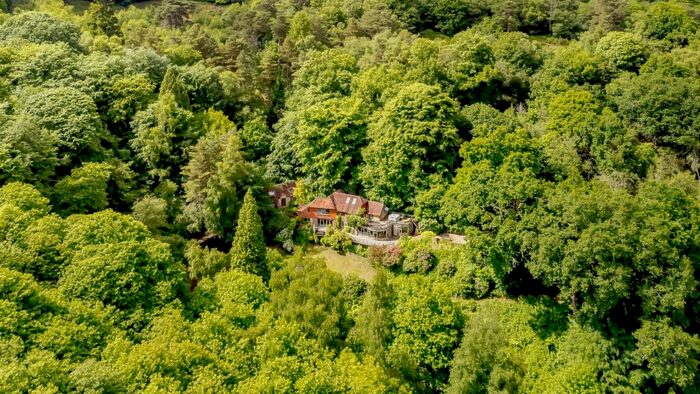
Properties in Plaistow have an average house price of £1.44M and had 3 Property Transactions within the last 3 years¹.
Plaistow is an area in Haslemere, Surrey with 68 households², where the most expensive property was sold for £2.01M.
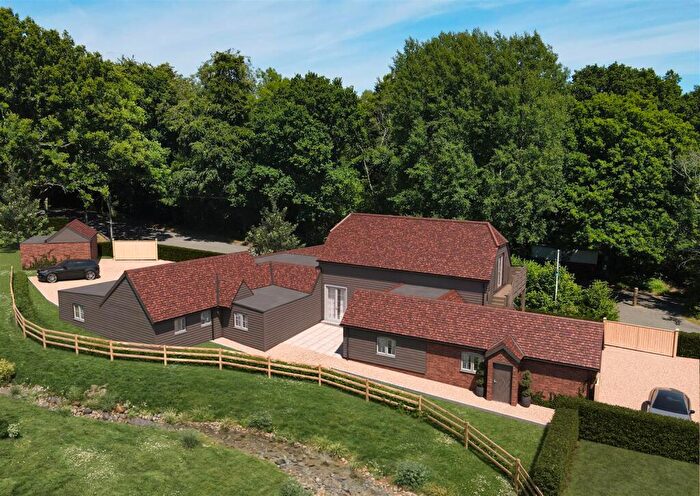
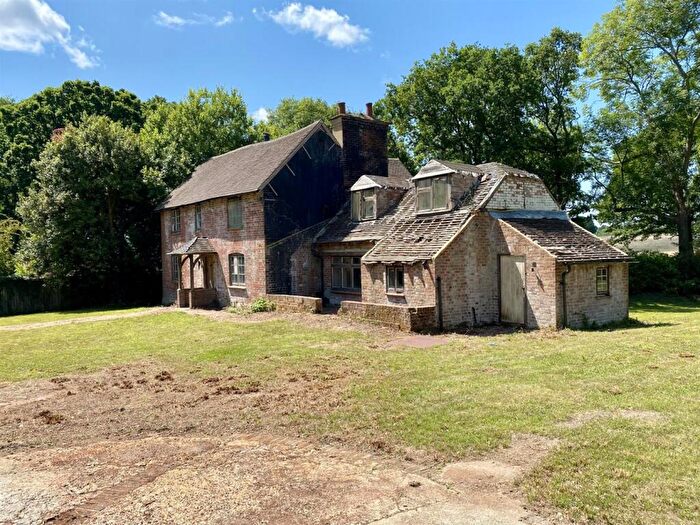
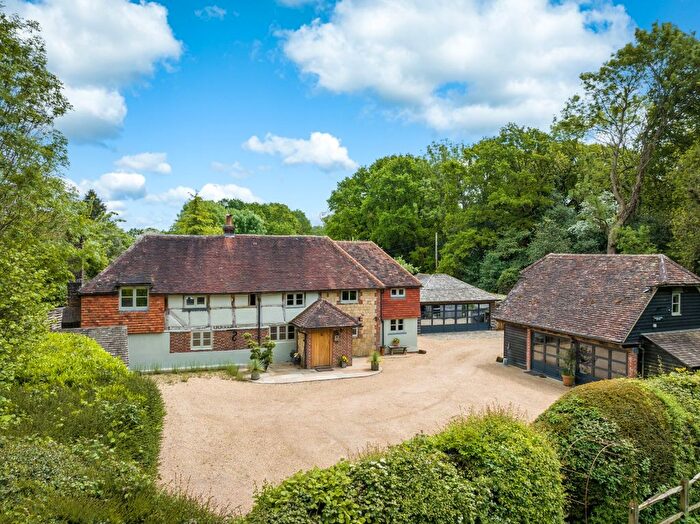
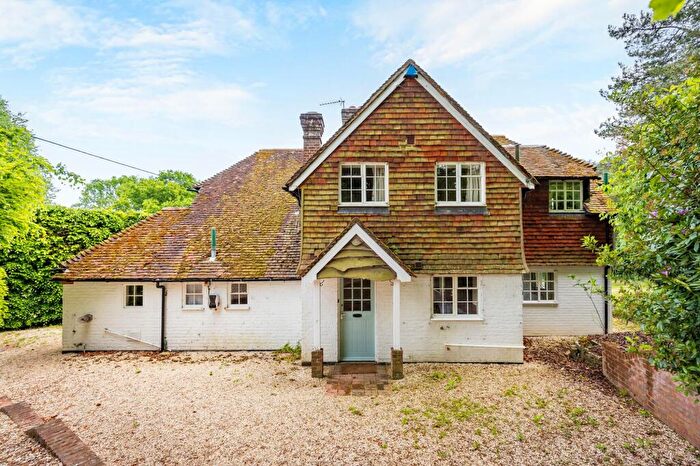
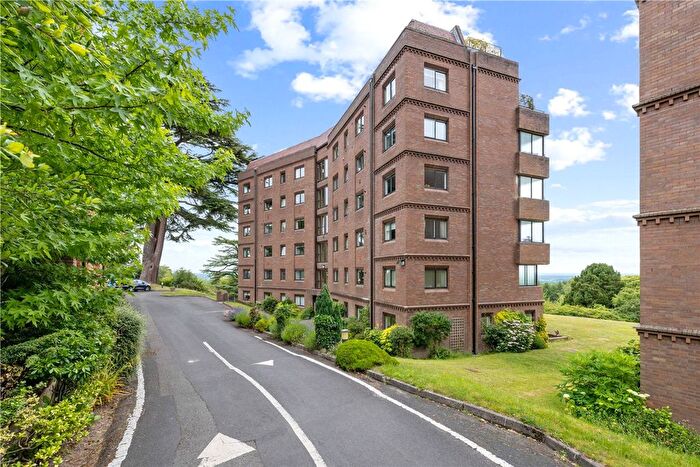
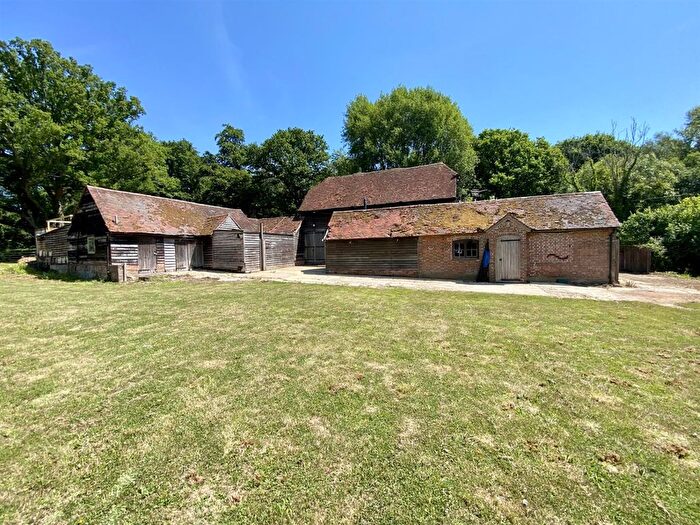
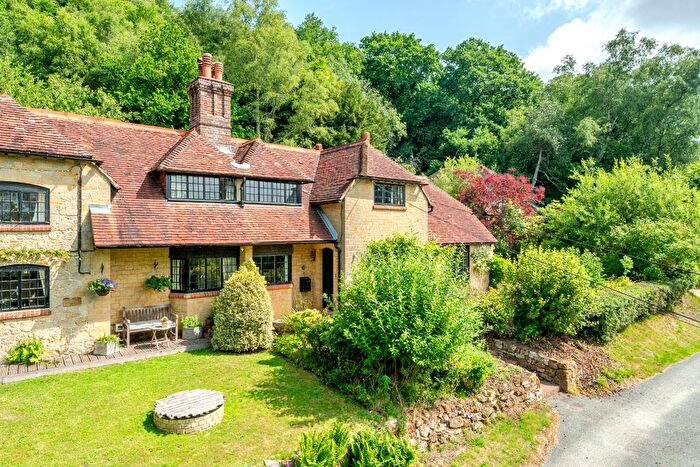
Properties for sale in Plaistow

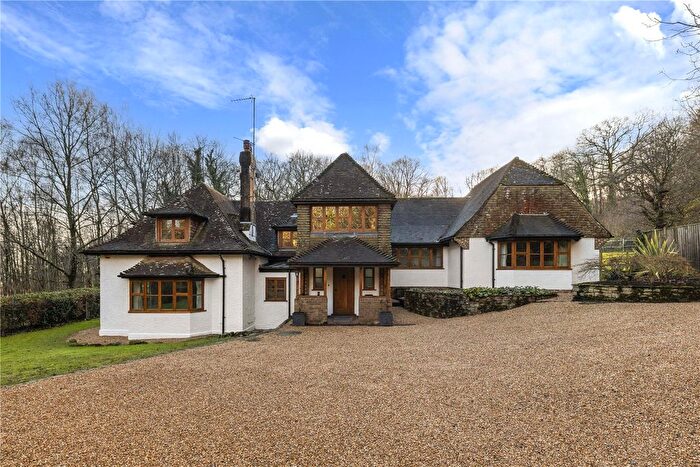
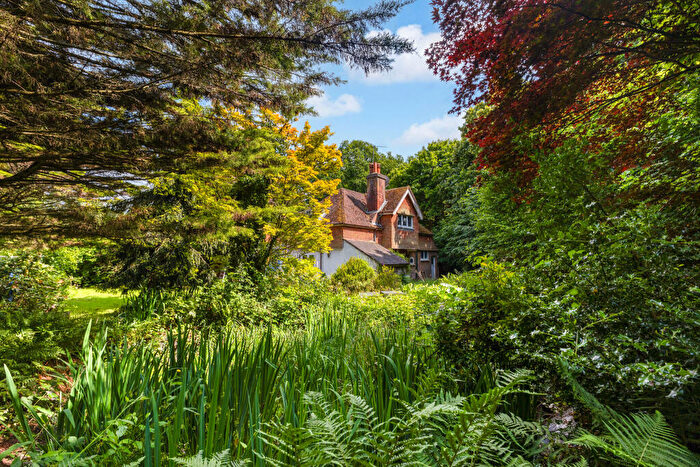
Previously listed properties in Plaistow
![]()
If you are looking to sell your house, let it out, or receive a property valuation, an expert can help you.
Click the button below to get started.


Roads and Postcodes in Plaistow
Navigate through our locations to find the location of your next house in Plaistow, Haslemere for sale or to rent.
| Streets | Postcodes |
|---|---|
| Blackdown | GU27 3BS GU27 3BU |
| Cripplecrutch Hill | GU27 2FG |
| Jays Lane | GU27 3BL |
| Jobsons Lane | GU27 3BY |
| Quell Lane | GU27 3BW |
| Roundhurst | GU27 3BN |
| Tennysons Lane | GU27 3BJ |
| West Street | GU27 2EP |
| Windfall Wood Common | GU27 3BX |
Transport near Plaistow
-
 Haslemere Station
 -
Witley Station
-
Liphook Station
-
Milford (Surrey) Station
-
Godalming Station
-
Liss Station
-
Farncombe Station
-
Pulborough Station
- FAQ
- Price Paid By Year
- Property Type Price
Frequently asked questions about Plaistow
What is the average price for a property for sale in Plaistow?
The average price for a property for sale in Plaistow is £1,435,850. This amount is 108% higher than the average price in Haslemere. There are 81 property listings for sale in Plaistow.
Which train stations are available in or near Plaistow?
Some of the train stations available in or near Plaistow are Haslemere, Witley and Liphook.
Property Price Paid in Plaistow by Year
The average sold property price by year was:
| Year | Average Sold Price | Price Change |
Sold Properties
|
|---|---|---|---|
| 2025 | £1,500,000 | 6% |
1 Property |
| 2023 | £1,403,775 | 26% |
2 Properties |
| 2022 | £1,032,657 | 18% |
4 Properties |
| 2021 | £842,000 | -23% |
1 Property |
| 2020 | £1,033,750 | -46% |
2 Properties |
| 2019 | £1,512,250 | -2% |
4 Properties |
| 2018 | £1,550,000 | -148% |
2 Properties |
| 2017 | £3,850,000 | 94% |
1 Property |
| 2016 | £224,000 | -200% |
1 Property |
| 2015 | £671,666 | -38% |
3 Properties |
| 2014 | £930,000 | 47% |
2 Properties |
| 2013 | £496,500 | -20% |
2 Properties |
| 2012 | £597,514 | 10% |
3 Properties |
| 2011 | £538,500 | -218% |
2 Properties |
| 2010 | £1,714,275 | 75% |
5 Properties |
| 2009 | £420,000 | 65% |
1 Property |
| 2008 | £145,000 | -28% |
1 Property |
| 2007 | £185,000 | -55% |
1 Property |
| 2006 | £286,983 | -44% |
3 Properties |
| 2005 | £412,000 | -106% |
4 Properties |
| 2004 | £850,000 | 56% |
2 Properties |
| 2003 | £376,225 | -17% |
2 Properties |
| 2002 | £438,327 | -81% |
9 Properties |
| 2001 | £795,000 | 45% |
1 Property |
| 2000 | £436,666 | -4% |
3 Properties |
| 1999 | £453,325 | 0,3% |
4 Properties |
| 1998 | £451,992 | 17% |
3 Properties |
| 1996 | £376,750 | -12% |
4 Properties |
| 1995 | £421,250 | - |
2 Properties |
Property Price per Property Type in Plaistow
Here you can find historic sold price data in order to help with your property search.
The average Property Paid Price for specific property types in the last three years are:
| Property Type | Average Sold Price | Sold Properties |
|---|---|---|
| Terraced House | £800,000.00 | 1 Terraced House |
| Detached House | £1,753,775.00 | 2 Detached Houses |