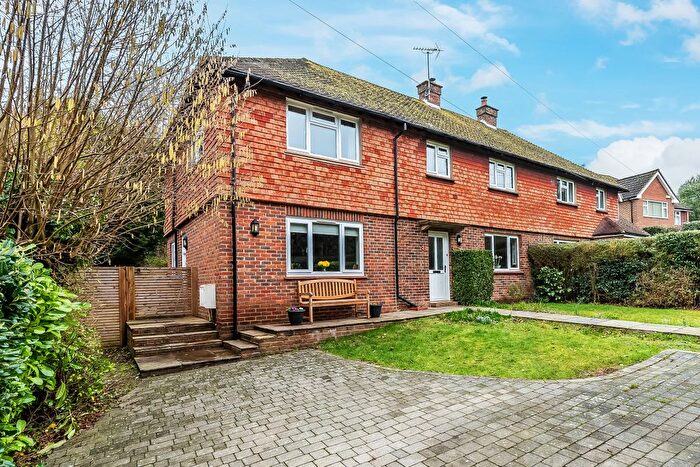
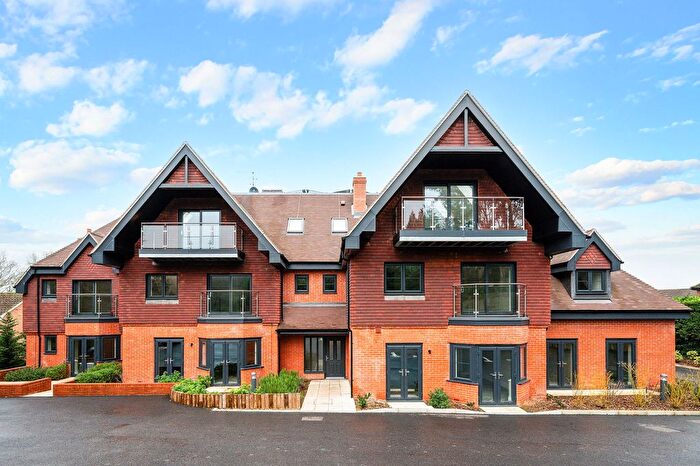
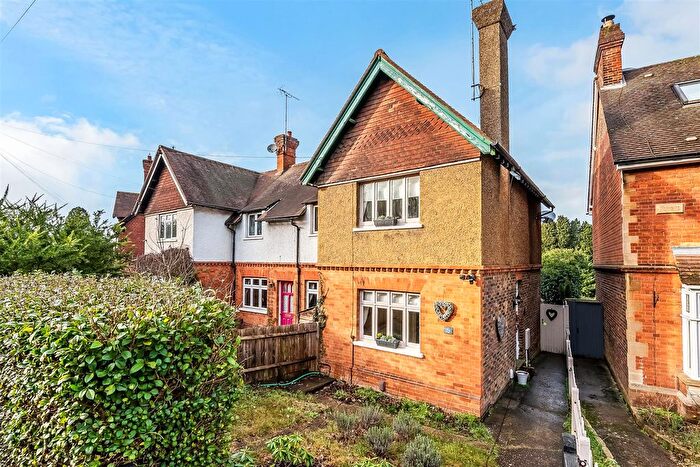
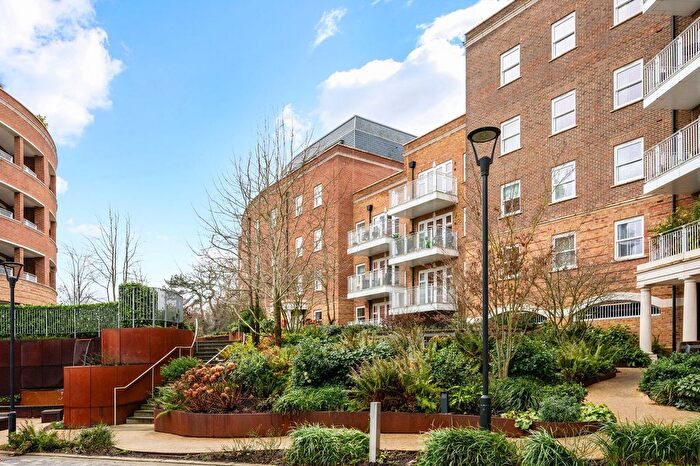
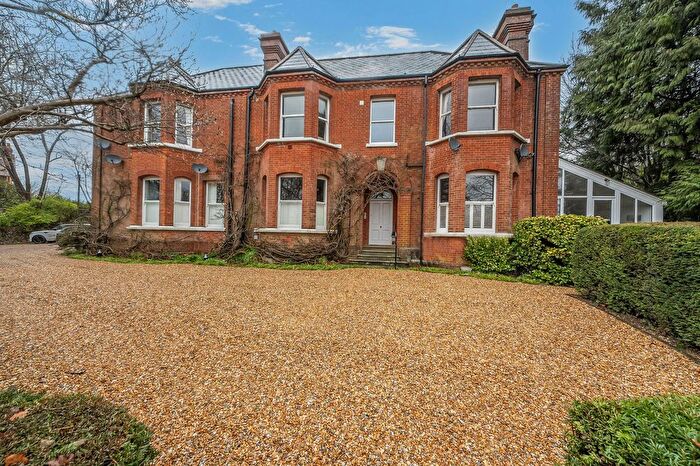
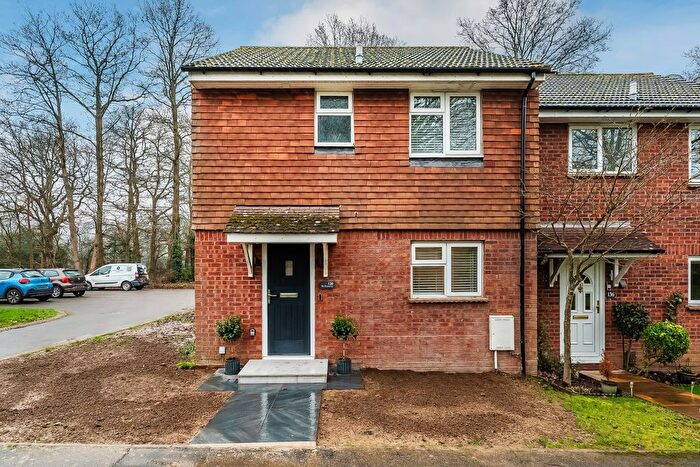
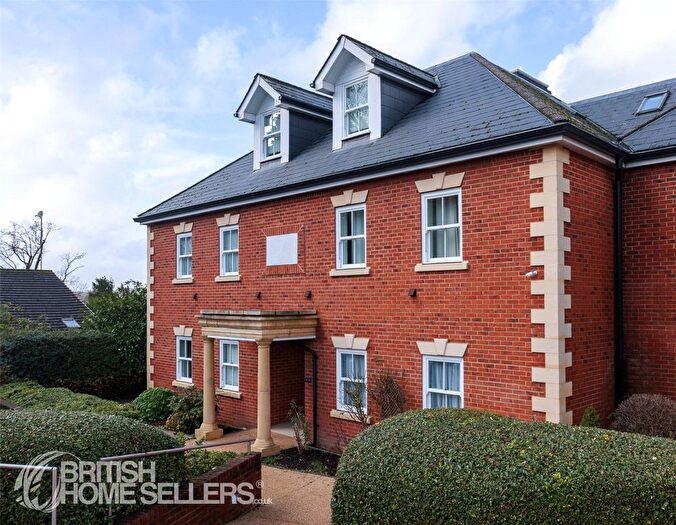
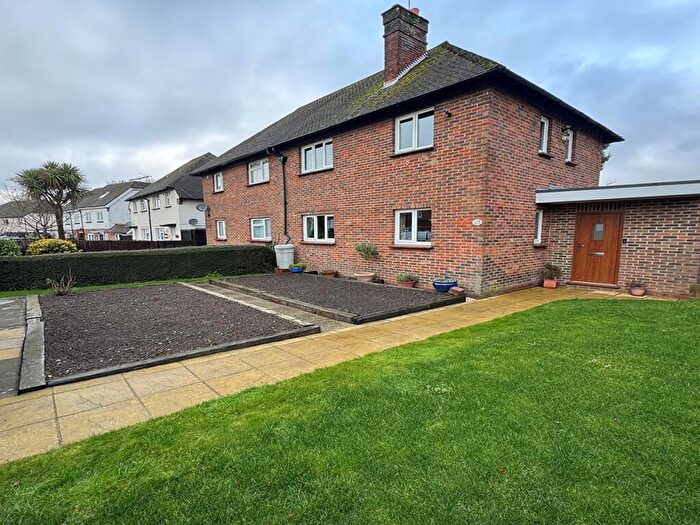
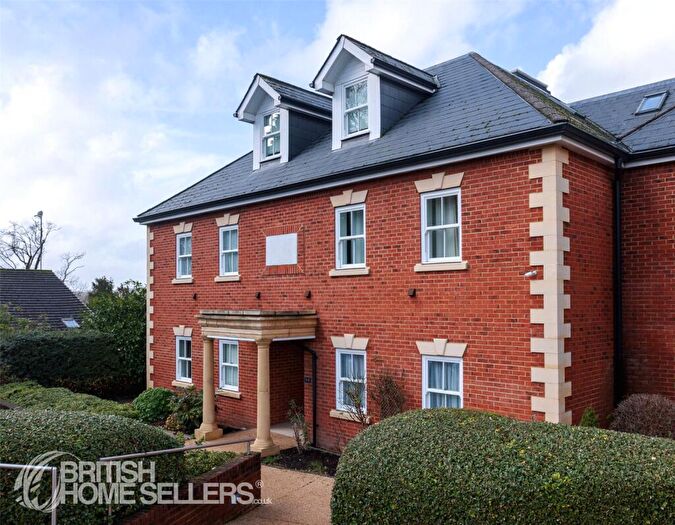
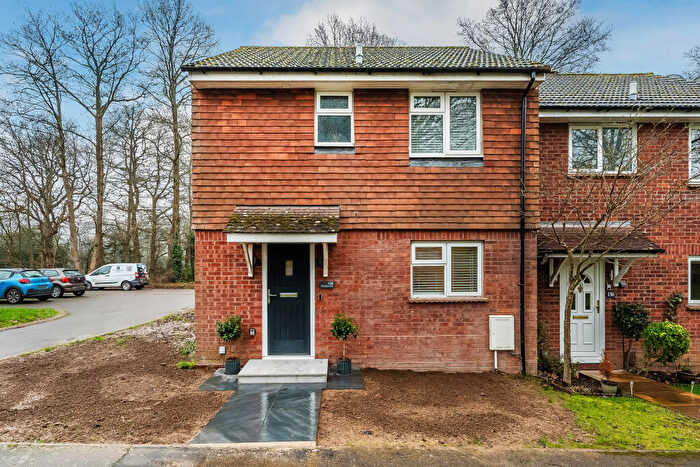
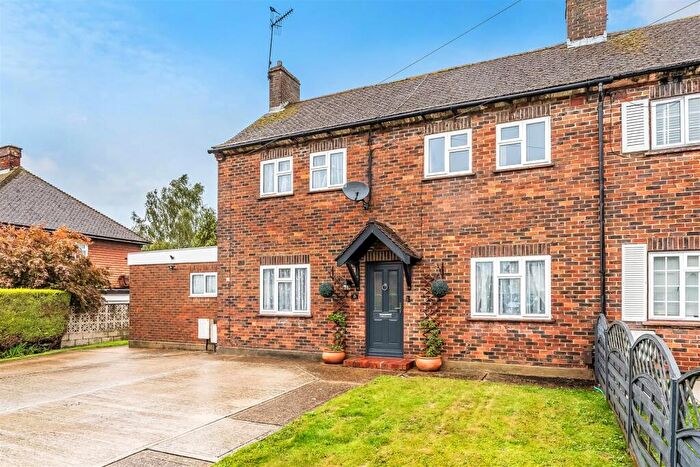
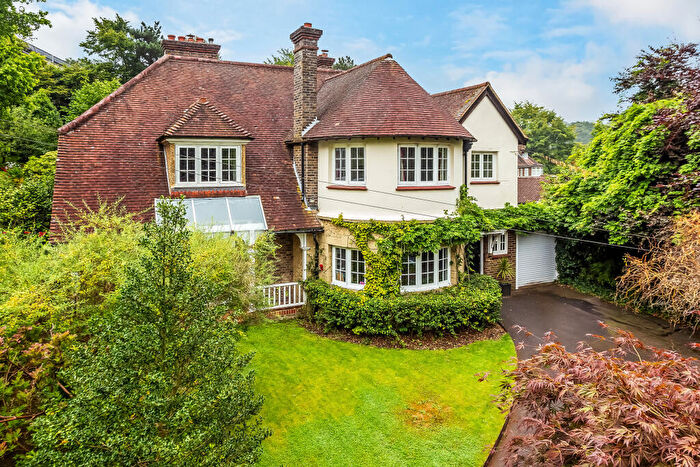
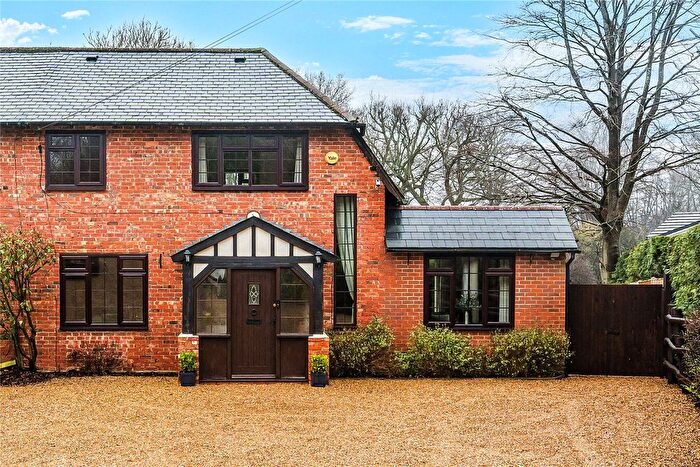
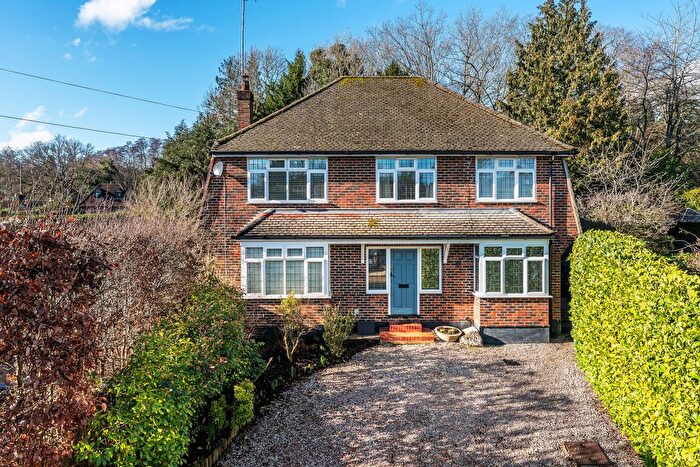
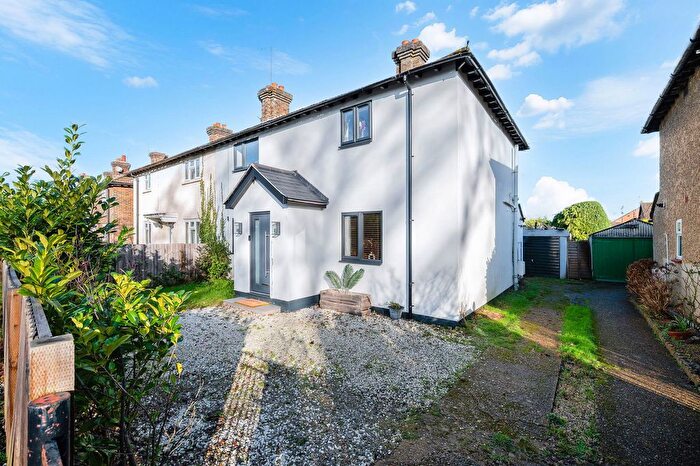
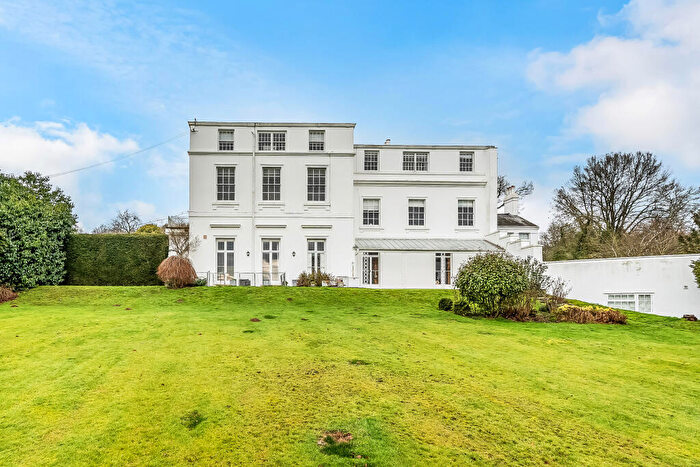
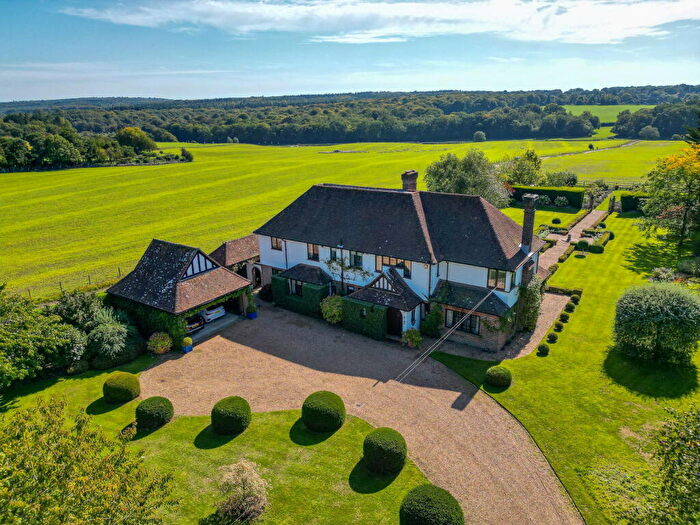
Houses for sale & to rent in Limpsfield, Oxted
House Prices in Limpsfield
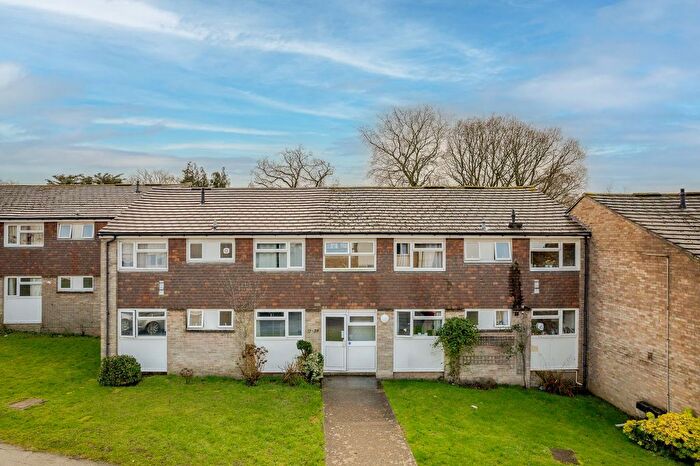
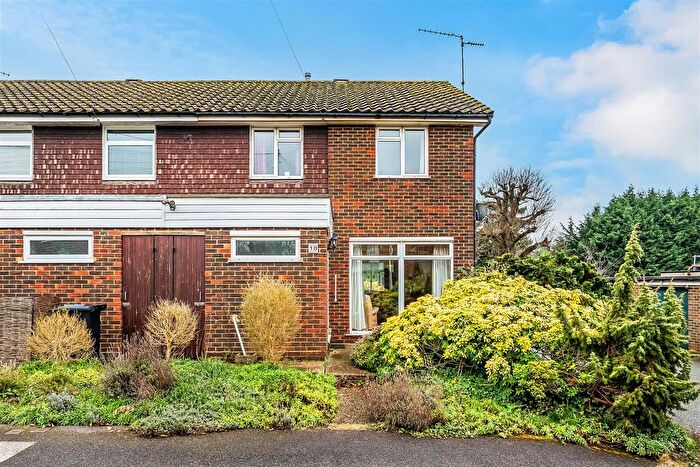
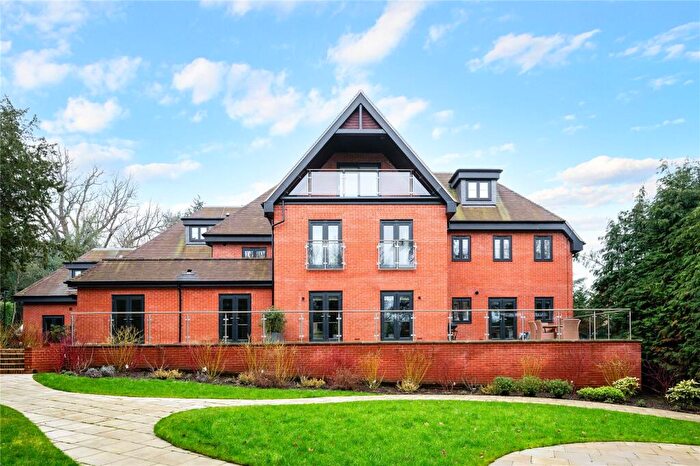
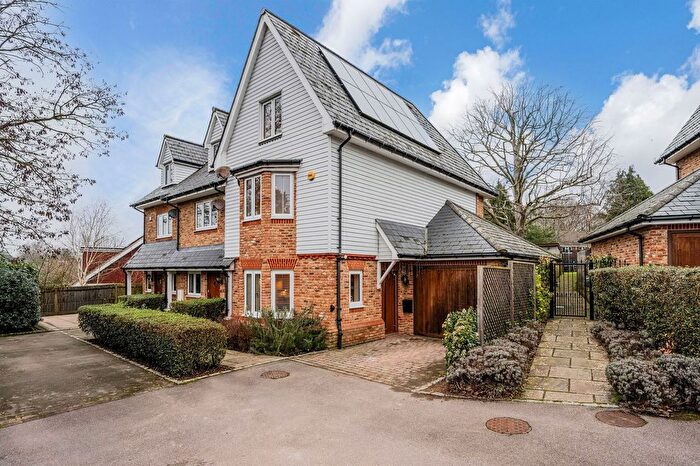
Properties in Limpsfield have an average house price of £1,004,450.00 and had 118 Property Transactions within the last 3 years¹.
Limpsfield is an area in Oxted, Surrey with 1,388 households², where the most expensive property was sold for £5,175,000.00.
Properties for sale in Limpsfield
Roads and Postcodes in Limpsfield
Navigate through our locations to find the location of your next house in Limpsfield, Oxted for sale or to rent.
| Streets | Postcodes |
|---|---|
| Ballards Lane | RH8 0SN |
| Bluehouse Gardens | RH8 0AU |
| Bluehouse Lane | RH8 0AJ RH8 0AP RH8 0AR RH8 0DE RH8 0RZ |
| Brassey Close | RH8 0EX |
| Brassey Hill | RH8 0ES |
| Brassey Road | RH8 0ET RH8 0EU |
| Brick Kiln Lane | RH8 0QG RH8 0QZ |
| Caxton Lane | RH8 0TD RH8 0TE |
| Chapel Road | RH8 0SX |
| Detillens Lane | RH8 0DH RH8 0DJ RH8 0DP |
| East Hill | RH8 0EH |
| Grants Lane | RH8 0RH RH8 0RQ |
| Granville Road | RH8 0BX RH8 0BY RH8 0BZ RH8 0DA |
| Gresham Close | RH8 0BH |
| Gresham Road | RH8 0BS RH8 0BU RH8 0BQ RH8 0GP |
| Grub Street | RH8 0SH |
| High Street | RH8 0DG RH8 0DR RH8 0DT RH8 0DY RH8 0DS |
| Hookwood Corner | RH8 0DL |
| Hookwood Park | RH8 0DU RH8 0SG RH8 0SQ |
| Itchingwood Common Road | RH8 0RJ RH8 0RL |
| Kent Hatch Road | RH8 0SZ RH8 0TA RH8 0TB |
| Marjory Pease Cottages | RH8 0SS |
| Mill Lane | RH8 0TJ |
| Moorhouse Road | RH8 0SR |
| New Lodge Drive | RH8 0AS |
| New Road | RH8 0UD |
| Padbrook | RH8 0DW RH8 0DZ |
| Padbrook Close | RH8 0DQ |
| Pains Hill | RH8 0RB RH8 0RF RH8 0RG |
| Park Close | RH8 0AH |
| Park Mews | RH8 0AQ |
| Park Road | RH8 0AL RH8 0AN RH8 0AW |
| Pastens Road | RH8 0RE RH8 0RD |
| Pollards Wood Hill | RH8 0QX |
| Post Office Row | RH8 0TH RH8 0TQ |
| Red Lane | RH8 0RT |
| Ridlands Grove | RH8 0ST |
| Ridlands Lane | RH8 0SY RH8 0TU |
| Ridlands Rise | RH8 0TF RH8 0TS RH8 0TT |
| Snatts Hill | RH8 0BL RH8 0BN |
| St Andrews Way | RH8 0TN |
| Staffhurst Wood Road | RH8 0GH |
| Stanhopes | RH8 0TY |
| Station Road East | RH8 0BD RH8 0BT RH8 0PR RH8 0ZT RH8 8SA RH8 8SE RH8 8SF RH8 8SG RH8 8SH RH8 8SJ RH8 8SL RH8 8SN RH8 8SP RH8 8SQ RH8 8SR RH8 8SS RH8 8ST RH8 8SU RH8 8SW |
| Stoneleigh Road | RH8 0TP RH8 0TR RH8 0TW |
| Stoneswood Road | RH8 0QY |
| Sylvan Close | RH8 0DX |
| Tally Road | RH8 0TG |
| Titsey Road | RH8 0DF |
| Trevereux Hill | RH8 0TL |
| Uvedale Road | RH8 0EN RH8 0EW |
| Water Lane | RH8 0SA |
| West Heath | RH8 0QS |
| Westerham Road | RH8 0EA RH8 0ED RH8 0EE RH8 0EP RH8 0ER RH8 0SW RH8 0SJ RH8 0SL |
| Wolfs Hill | RH8 0QU |
| Wolfs Row | RH8 0EB RH8 0QL |
Transport near Limpsfield
-
Hurst Green Station
-
Oxted Station
-
Edenbridge Station
-
Godstone Station
-
Woldingham Station
-
Edenbridge Town Station
-
Caterham Station
- FAQ
- Price Paid By Year
- Property Type Price
Frequently asked questions about Limpsfield
What is the average price for a property for sale in Limpsfield?
The average price for a property for sale in Limpsfield is £1,004,450. This amount is 42% higher than the average price in Oxted. There are 1,382 property listings for sale in Limpsfield.
What streets have the most expensive properties for sale in Limpsfield?
The streets with the most expensive properties for sale in Limpsfield are Detillens Lane at an average of £2,450,000, West Heath at an average of £2,137,500 and Chapel Road at an average of £1,950,000.
What streets have the most affordable properties for sale in Limpsfield?
The streets with the most affordable properties for sale in Limpsfield are Station Road East at an average of £265,000, Caxton Lane at an average of £392,487 and St Andrews Way at an average of £485,000.
Which train stations are available in or near Limpsfield?
Some of the train stations available in or near Limpsfield are Hurst Green, Oxted and Edenbridge.
Property Price Paid in Limpsfield by Year
The average sold property price by year was:
| Year | Average Sold Price | Price Change |
Sold Properties
|
|---|---|---|---|
| 2025 | £1,008,694 | 6% |
44 Properties |
| 2024 | £951,267 | -10% |
36 Properties |
| 2023 | £1,049,919 | -17% |
38 Properties |
| 2022 | £1,223,679 | 20% |
41 Properties |
| 2021 | £980,034 | -5% |
58 Properties |
| 2020 | £1,026,786 | 17% |
60 Properties |
| 2019 | £852,470 | -4% |
57 Properties |
| 2018 | £890,184 | 4% |
49 Properties |
| 2017 | £855,397 | 17% |
39 Properties |
| 2016 | £713,622 | -12% |
49 Properties |
| 2015 | £801,611 | -3% |
75 Properties |
| 2014 | £825,011 | 21% |
58 Properties |
| 2013 | £654,119 | -7% |
57 Properties |
| 2012 | £701,362 | 2% |
62 Properties |
| 2011 | £687,226 | 8% |
42 Properties |
| 2010 | £631,139 | -13% |
39 Properties |
| 2009 | £715,944 | 1% |
39 Properties |
| 2008 | £705,678 | 21% |
21 Properties |
| 2007 | £555,912 | 2% |
77 Properties |
| 2006 | £544,669 | 3% |
82 Properties |
| 2005 | £527,065 | 11% |
60 Properties |
| 2004 | £468,263 | 16% |
71 Properties |
| 2003 | £392,999 | -11% |
60 Properties |
| 2002 | £437,716 | 14% |
62 Properties |
| 2001 | £377,053 | -2% |
57 Properties |
| 2000 | £386,046 | 15% |
67 Properties |
| 1999 | £329,042 | 17% |
84 Properties |
| 1998 | £272,440 | 12% |
73 Properties |
| 1997 | £240,710 | 18% |
67 Properties |
| 1996 | £196,836 | -2% |
79 Properties |
| 1995 | £201,620 | - |
54 Properties |
Property Price per Property Type in Limpsfield
Here you can find historic sold price data in order to help with your property search.
The average Property Paid Price for specific property types in the last three years are:
| Property Type | Average Sold Price | Sold Properties |
|---|---|---|
| Semi Detached House | £708,159.00 | 22 Semi Detached Houses |
| Detached House | £1,393,828.00 | 60 Detached Houses |
| Terraced House | £499,086.00 | 11 Terraced Houses |
| Flat | £553,038.00 | 25 Flats |

