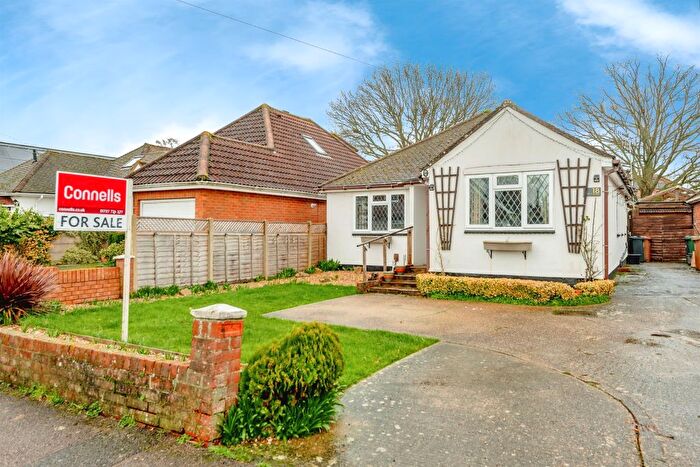
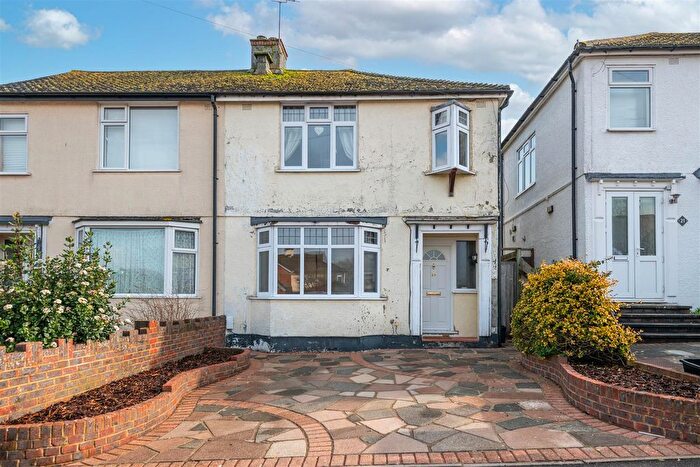
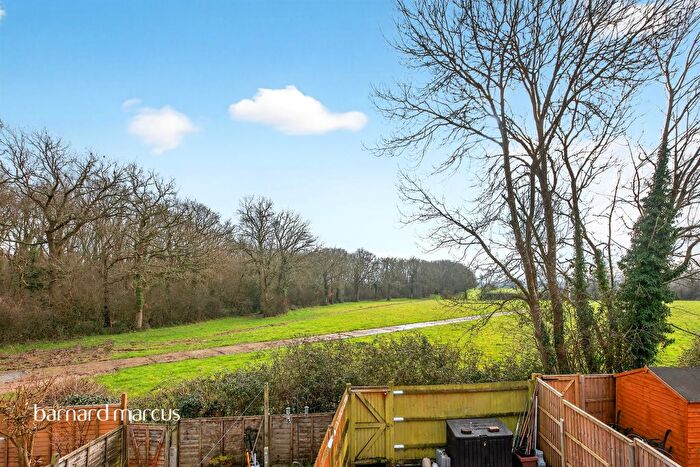
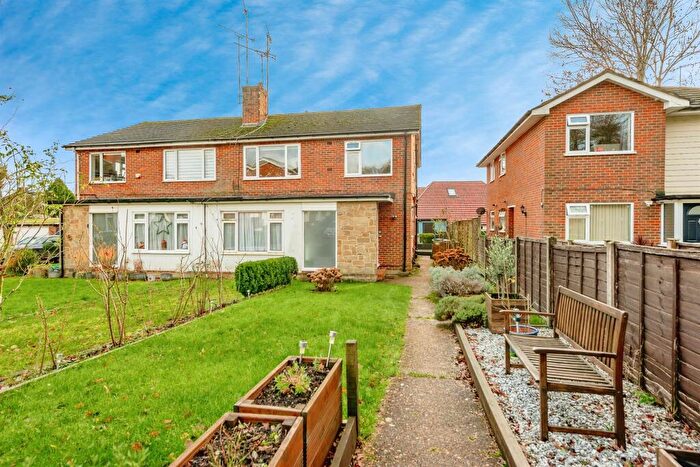
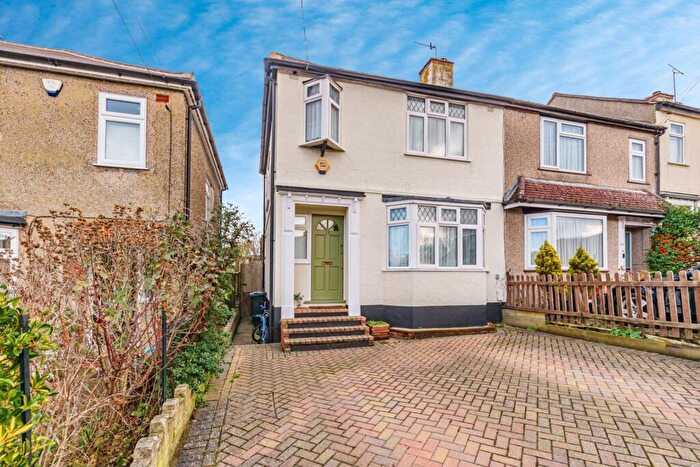
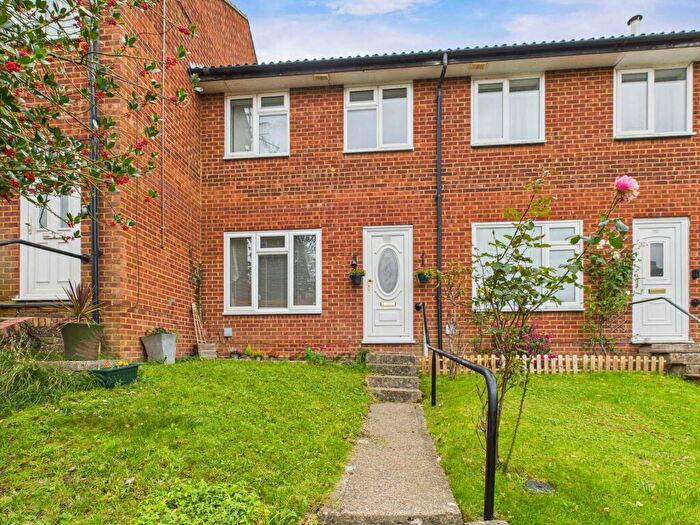
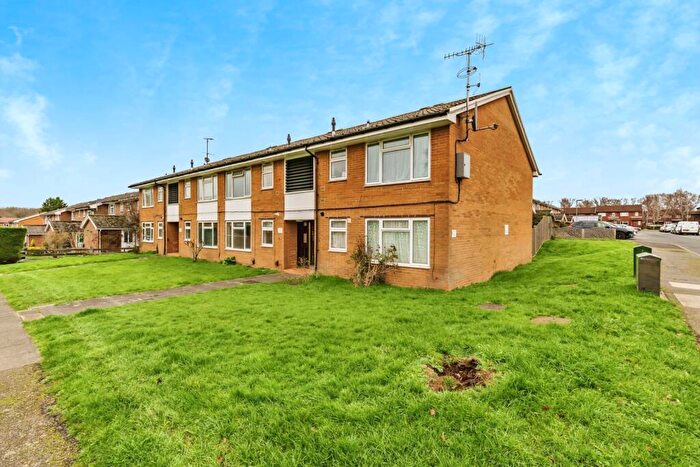
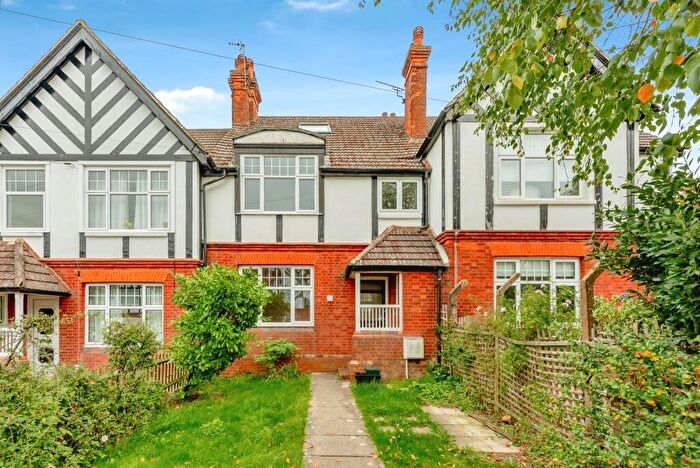
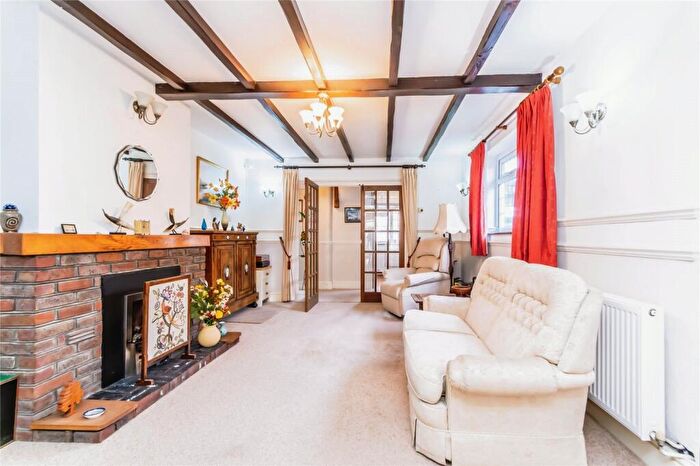
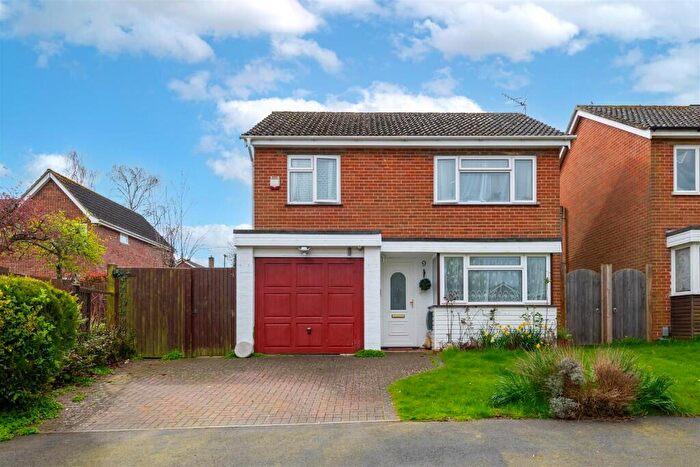
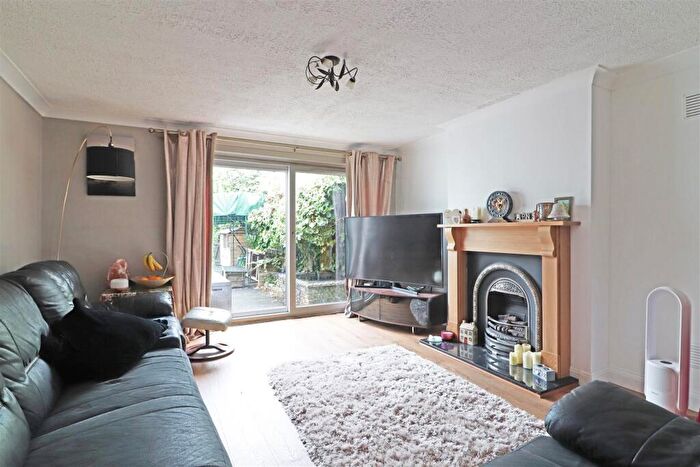
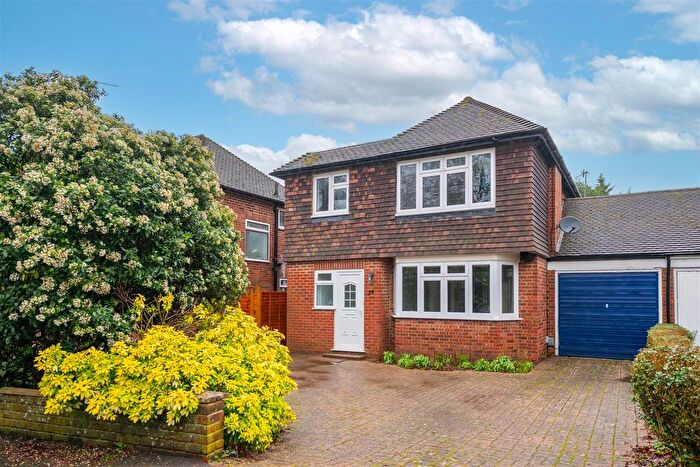
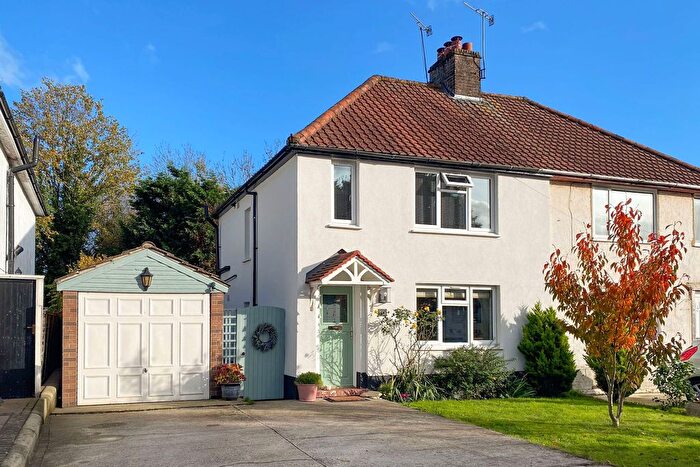
Houses for sale & to rent in Salfords And Sidlow, Redhill
House Prices in Salfords And Sidlow
Properties in Salfords And Sidlow have an average house price of £569,951.00 and had 72 Property Transactions within the last 3 years¹.
Salfords And Sidlow is an area in Redhill, Surrey with 761 households², where the most expensive property was sold for £1,150,000.00.
Properties for sale in Salfords And Sidlow
Previously listed properties in Salfords And Sidlow
Roads and Postcodes in Salfords And Sidlow
Navigate through our locations to find the location of your next house in Salfords And Sidlow, Redhill for sale or to rent.
| Streets | Postcodes |
|---|---|
| Axes Lane | RH1 5QL |
| Beaumonts | RH1 5DT |
| Beechwood Villas | RH1 5EY |
| Bonehurst Road | RH1 5ED |
| Brighton Road | RH1 5BT RH1 5BU RH1 5BX RH1 5BZ RH1 5DA RH1 5TW |
| Cross Oak Lane | RH1 5RF |
| Dunraven Avenue | RH1 5HN RH1 5JW |
| Empire Villas | RH1 5EZ |
| Harwood Park | RH1 5EJ |
| Honeycrock Lane | RH1 5DF RH1 5DG RH1 5JN RH1 5JR |
| Horley Lodge Lane | RH1 5EA |
| June Lane | RH1 5JS |
| Lodge Lane | RH1 5DH RH1 5DJ RH1 5DS |
| Masons Bridge Road | RH1 5JU |
| Mead Avenue | RH1 5DD |
| Montfort Rise | RH1 5DU |
| Napier Close | RH1 5GR |
| New House Lane | RH1 5RA RH1 5RE |
| Oak Lodge Drive | RH1 5EB |
| Park Avenue | RH1 5DP RH1 5DR |
| Park View Road | RH1 5DN RH1 5DW |
| Pear Tree Hill | RH1 5EG |
| Petridge Wood Common | RH1 5JJ |
| Picketts Lane | RH1 5RG |
| Southern Avenue | RH1 5DE |
| St Georges Road | RH1 5RD |
| Westmead Drive | RH1 5DB |
| White Lodge Gardens | RH1 5DL |
| Wood Close | RH1 5EE |
Transport near Salfords And Sidlow
- FAQ
- Price Paid By Year
- Property Type Price
Frequently asked questions about Salfords And Sidlow
What is the average price for a property for sale in Salfords And Sidlow?
The average price for a property for sale in Salfords And Sidlow is £569,951. This amount is 24% higher than the average price in Redhill. There are 336 property listings for sale in Salfords And Sidlow.
What streets have the most expensive properties for sale in Salfords And Sidlow?
The streets with the most expensive properties for sale in Salfords And Sidlow are Horley Lodge Lane at an average of £965,833, Axes Lane at an average of £932,500 and Oak Lodge Drive at an average of £897,500.
What streets have the most affordable properties for sale in Salfords And Sidlow?
The streets with the most affordable properties for sale in Salfords And Sidlow are Dunraven Avenue at an average of £338,333, Brighton Road at an average of £401,666 and Park View Road at an average of £421,812.
Which train stations are available in or near Salfords And Sidlow?
Some of the train stations available in or near Salfords And Sidlow are Salfords, Earlswood (Surrey) and Nutfield.
Property Price Paid in Salfords And Sidlow by Year
The average sold property price by year was:
| Year | Average Sold Price | Price Change |
Sold Properties
|
|---|---|---|---|
| 2025 | £604,937 | -2% |
24 Properties |
| 2024 | £616,527 | 17% |
18 Properties |
| 2023 | £514,016 | 2% |
30 Properties |
| 2022 | £505,859 | -1% |
34 Properties |
| 2021 | £513,155 | 10% |
45 Properties |
| 2020 | £462,568 | 6% |
30 Properties |
| 2019 | £434,054 | -24% |
34 Properties |
| 2018 | £537,666 | 22% |
34 Properties |
| 2017 | £417,340 | 1% |
44 Properties |
| 2016 | £411,256 | 5% |
40 Properties |
| 2015 | £389,775 | -5% |
56 Properties |
| 2014 | £408,224 | 24% |
30 Properties |
| 2013 | £309,048 | 5% |
30 Properties |
| 2012 | £294,421 | -14% |
37 Properties |
| 2011 | £337,072 | -2% |
33 Properties |
| 2010 | £343,886 | -7% |
22 Properties |
| 2009 | £368,167 | 15% |
28 Properties |
| 2008 | £312,102 | -19% |
33 Properties |
| 2007 | £372,728 | 31% |
37 Properties |
| 2006 | £257,512 | -14% |
51 Properties |
| 2005 | £293,122 | 7% |
29 Properties |
| 2004 | £272,275 | 13% |
54 Properties |
| 2003 | £236,105 | 24% |
45 Properties |
| 2002 | £178,892 | 4% |
48 Properties |
| 2001 | £171,481 | -14% |
44 Properties |
| 2000 | £195,730 | 25% |
45 Properties |
| 1999 | £146,626 | 23% |
49 Properties |
| 1998 | £112,341 | -21% |
39 Properties |
| 1997 | £135,376 | 22% |
32 Properties |
| 1996 | £105,352 | -10% |
32 Properties |
| 1995 | £116,058 | - |
23 Properties |
Property Price per Property Type in Salfords And Sidlow
Here you can find historic sold price data in order to help with your property search.
The average Property Paid Price for specific property types in the last three years are:
| Property Type | Average Sold Price | Sold Properties |
|---|---|---|
| Semi Detached House | £504,568.00 | 29 Semi Detached Houses |
| Detached House | £724,564.00 | 31 Detached Houses |
| Terraced House | £417,916.00 | 6 Terraced Houses |
| Flat | £239,166.00 | 6 Flats |

