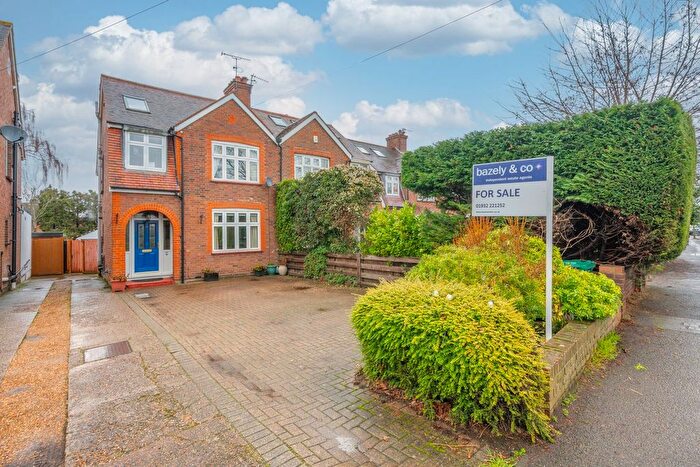
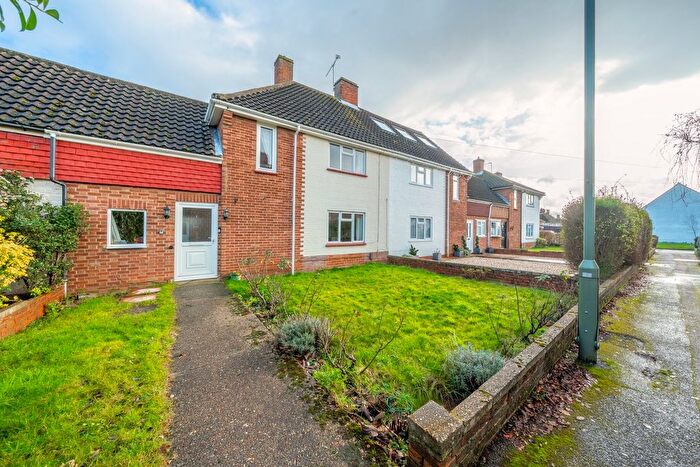
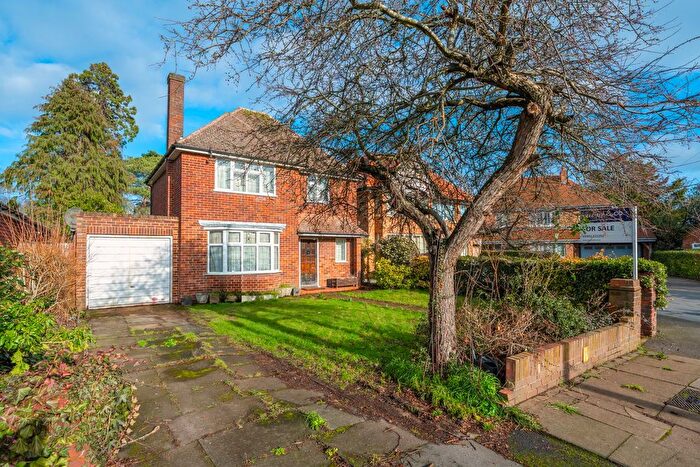
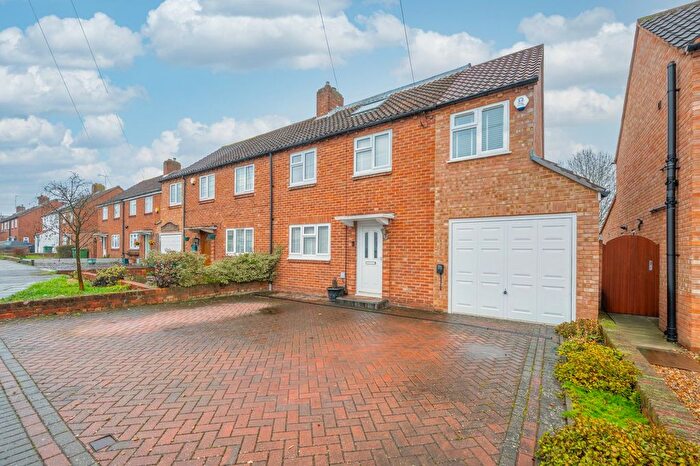
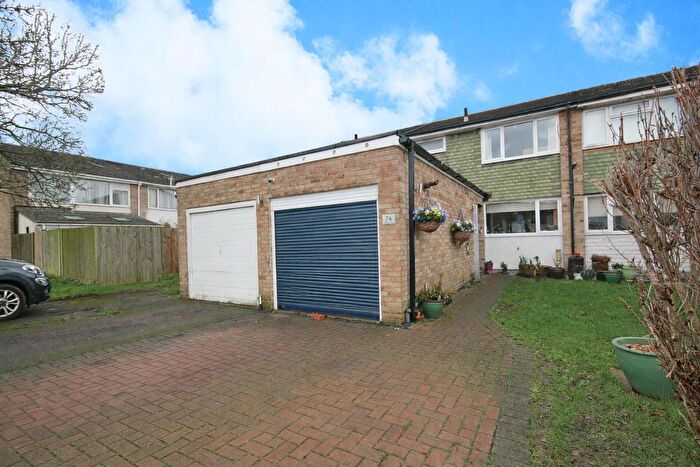
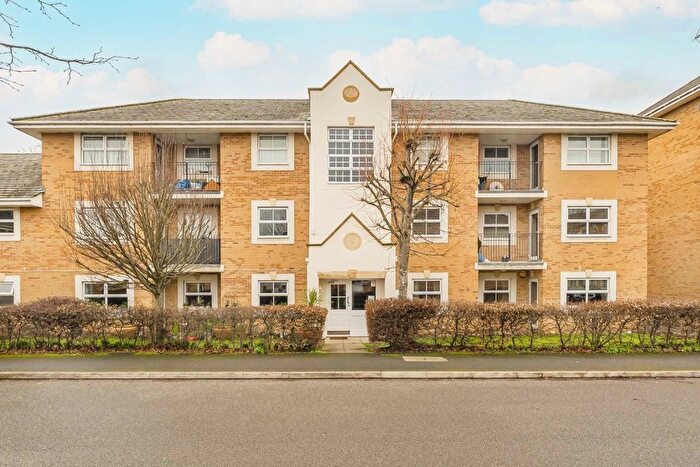
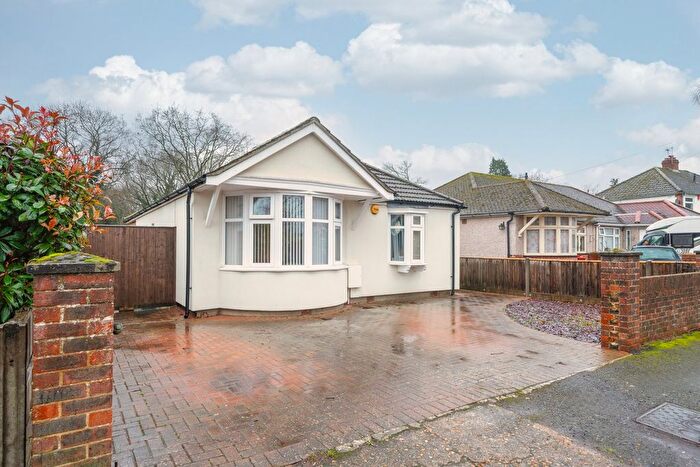
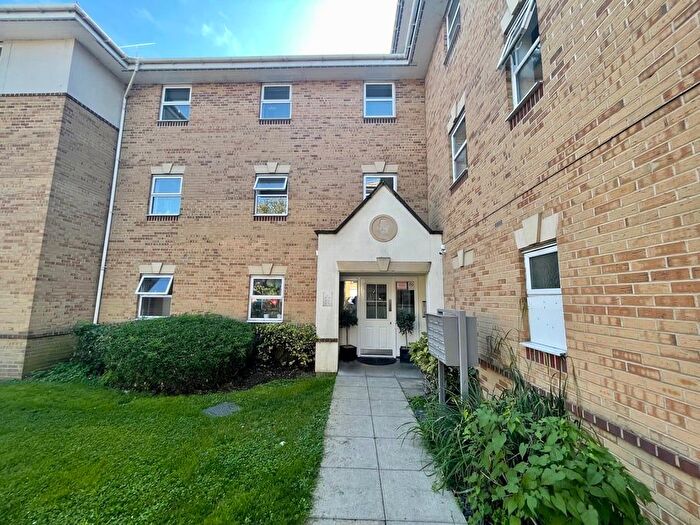
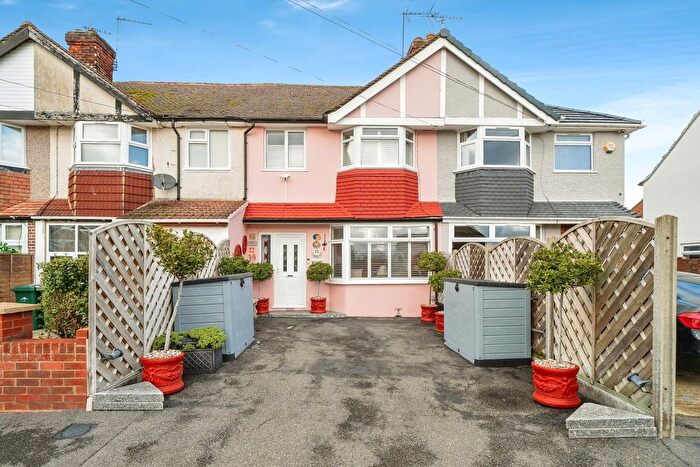
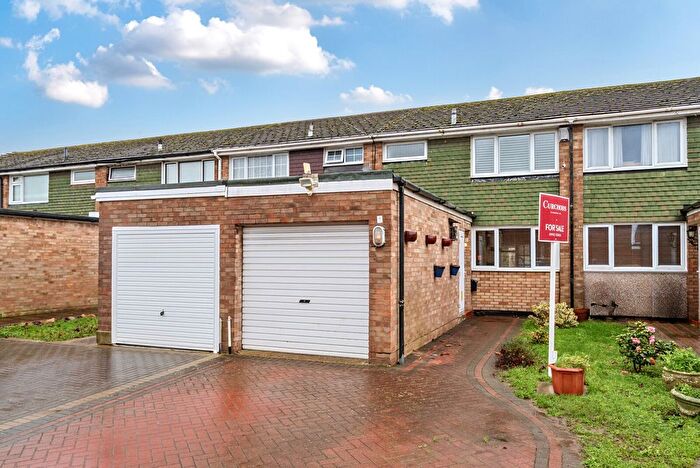
Houses for sale & to rent in Halliford And Sunbury West, Shepperton
House Prices in Halliford And Sunbury West
Properties in Halliford And Sunbury West have an average house price of £507,462.00 and had 64 Property Transactions within the last 3 years¹.
Halliford And Sunbury West is an area in Shepperton, Surrey with 949 households², where the most expensive property was sold for £1,750,000.00.
Properties for sale in Halliford And Sunbury West
Roads and Postcodes in Halliford And Sunbury West
Navigate through our locations to find the location of your next house in Halliford And Sunbury West, Shepperton for sale or to rent.
| Streets | Postcodes |
|---|---|
| Allington Avenue | TW17 8TB |
| Annett Close | TW17 8SF |
| Birch Grove | TW17 8SR TW17 8SS |
| Blackberry Close | TW17 8QX |
| Bramble Close | TW17 8RR |
| Bramley Avenue | TW17 8TF |
| Charlton Lane | TW17 8QB TW17 8QL TW17 8QW TW17 8QA TW17 8QN |
| Cherry Way | TW17 8QF TW17 8QG TW17 8QQ |
| Chestnut Walk | TW17 8QP TW17 8QR |
| Coxes Avenue | TW17 8TE |
| Dorly Close | TW17 8RT |
| Freeman Close | TW17 8RH |
| Gaston Bridge Road | TW17 8HB TW17 8HD |
| Geneva Close | TW17 8RW |
| Halliford Close | TW17 8SL |
| Halliford Road | TW17 8RU TW17 8SG |
| Haslett Road | TW17 8SU |
| Hawthorn Way | TW17 8QD TW17 8QE TW17 8QH |
| Holmbank Drive | TW17 8RZ |
| Home Farm Close | TW17 8RP |
| Kelly Close | TW17 8RL |
| Keswick Avenue | TW17 8TA |
| Minsterley Avenue | TW17 8QS TW17 8QT TW17 8QU |
| Orchard Drive | TW17 8TQ |
| Park Avenue | TW17 8SZ |
| Pears Avenue | TW17 8TD |
| Roxford Close | TW17 8RS |
| Russet Avenue | TW17 8TG |
| St Andrews Close | TW17 8QJ |
| Stirling Avenue | TW17 8TH |
| The Crofts | TW17 8SD |
| The Green | TW17 8QZ TW17 8SA |
| Upper Halliford Green | TW17 8SB |
| Upper Halliford Road | TW17 8RJ TW17 8RX TW17 8RY TW17 8SE TW17 8SH TW17 8SN TW17 8SP TW17 8SQ TW17 8ST TW17 8SX TW17 8SY TW17 8SJ |
| Vincent Drive | TW17 8SW |
| Wallace Close | TW17 8QY |
Transport near Halliford And Sunbury West
-
Upper Halliford Station
-
Shepperton Station
-
Sunbury Station
-
Kempton Park Station
-
Walton-On-Thames Station
-
Hersham Station
-
Hampton Station
-
Ashford (Middlesex) Station
- FAQ
- Price Paid By Year
- Property Type Price
Frequently asked questions about Halliford And Sunbury West
What is the average price for a property for sale in Halliford And Sunbury West?
The average price for a property for sale in Halliford And Sunbury West is £507,462. This amount is 5% lower than the average price in Shepperton. There are 633 property listings for sale in Halliford And Sunbury West.
What streets have the most expensive properties for sale in Halliford And Sunbury West?
The streets with the most expensive properties for sale in Halliford And Sunbury West are Roxford Close at an average of £1,332,500, The Crofts at an average of £1,100,000 and Minsterley Avenue at an average of £706,333.
What streets have the most affordable properties for sale in Halliford And Sunbury West?
The streets with the most affordable properties for sale in Halliford And Sunbury West are Geneva Close at an average of £255,000, Kelly Close at an average of £270,498 and The Green at an average of £292,500.
Which train stations are available in or near Halliford And Sunbury West?
Some of the train stations available in or near Halliford And Sunbury West are Upper Halliford, Shepperton and Sunbury.
Property Price Paid in Halliford And Sunbury West by Year
The average sold property price by year was:
| Year | Average Sold Price | Price Change |
Sold Properties
|
|---|---|---|---|
| 2025 | £495,289 | 3% |
19 Properties |
| 2024 | £480,219 | -15% |
25 Properties |
| 2023 | £553,080 | 18% |
20 Properties |
| 2022 | £452,857 | -5% |
28 Properties |
| 2021 | £474,411 | 5% |
31 Properties |
| 2020 | £452,862 | 12% |
27 Properties |
| 2019 | £397,975 | -2% |
20 Properties |
| 2018 | £404,125 | -7% |
32 Properties |
| 2017 | £433,441 | 15% |
35 Properties |
| 2016 | £366,662 | -5% |
44 Properties |
| 2015 | £386,236 | 13% |
33 Properties |
| 2014 | £334,668 | 14% |
32 Properties |
| 2013 | £287,710 | -2% |
32 Properties |
| 2012 | £294,297 | 6% |
20 Properties |
| 2011 | £275,186 | -25% |
29 Properties |
| 2010 | £343,806 | 20% |
16 Properties |
| 2009 | £274,261 | 7% |
17 Properties |
| 2008 | £255,329 | 4% |
30 Properties |
| 2007 | £245,605 | -17% |
48 Properties |
| 2006 | £288,403 | 32% |
54 Properties |
| 2005 | £196,808 | -22% |
28 Properties |
| 2004 | £239,412 | 14% |
29 Properties |
| 2003 | £205,813 | -6% |
38 Properties |
| 2002 | £217,828 | 11% |
53 Properties |
| 2001 | £194,369 | 14% |
39 Properties |
| 2000 | £167,913 | 31% |
42 Properties |
| 1999 | £116,391 | -13% |
36 Properties |
| 1998 | £131,953 | 20% |
32 Properties |
| 1997 | £105,562 | 2% |
40 Properties |
| 1996 | £103,092 | 23% |
42 Properties |
| 1995 | £79,304 | - |
21 Properties |
Property Price per Property Type in Halliford And Sunbury West
Here you can find historic sold price data in order to help with your property search.
The average Property Paid Price for specific property types in the last three years are:
| Property Type | Average Sold Price | Sold Properties |
|---|---|---|
| Semi Detached House | £543,204.00 | 22 Semi Detached Houses |
| Detached House | £818,404.00 | 14 Detached Houses |
| Terraced House | £362,817.00 | 14 Terraced Houses |
| Flat | £285,000.00 | 14 Flats |

