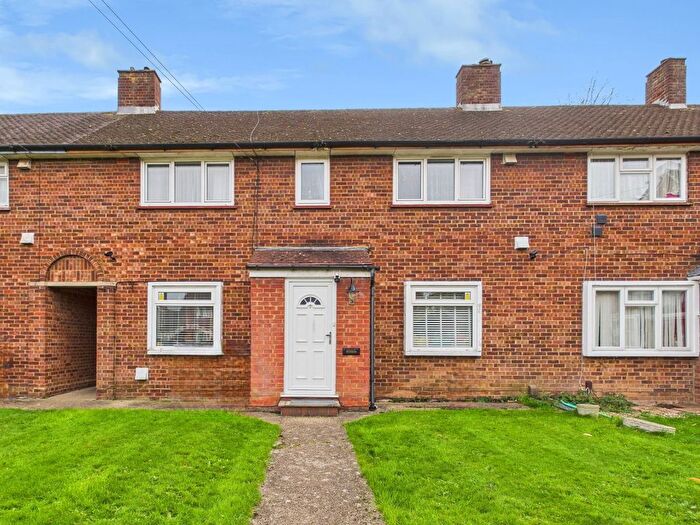
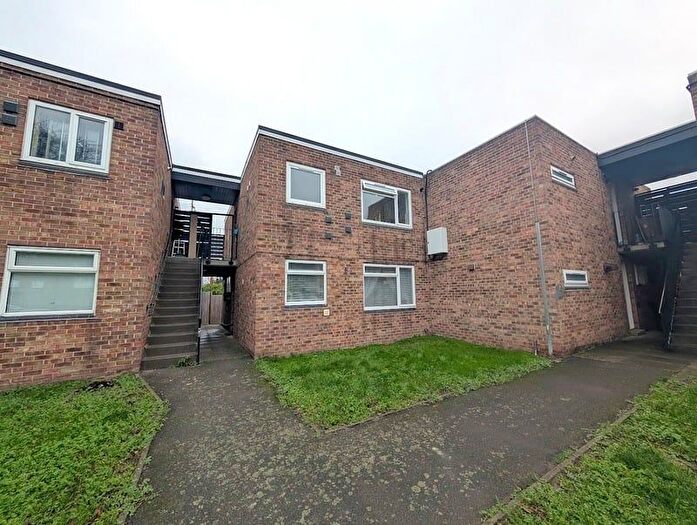
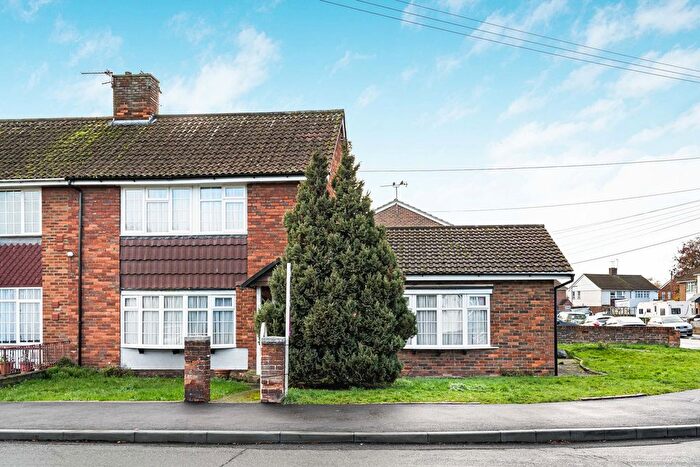
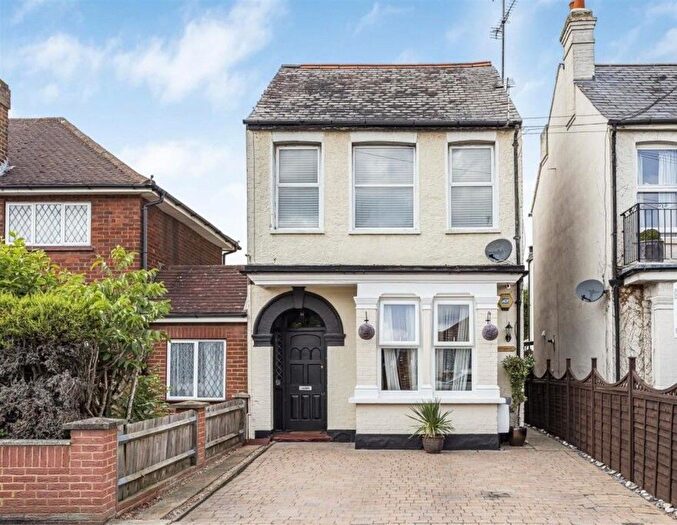
Houses for sale & to rent in Ashford North And Stanwell South, Staines-upon-thames
House Prices in Ashford North And Stanwell South
Properties in Ashford North And Stanwell South have an average house price of £305,530.00 and had 45 Property Transactions within the last 3 years¹.
Ashford North And Stanwell South is an area in Staines-upon-thames, Surrey with 176 households², where the most expensive property was sold for £546,000.00.
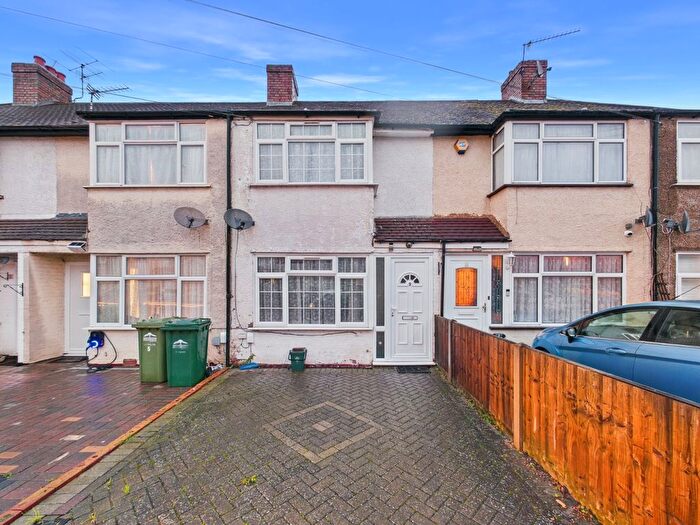
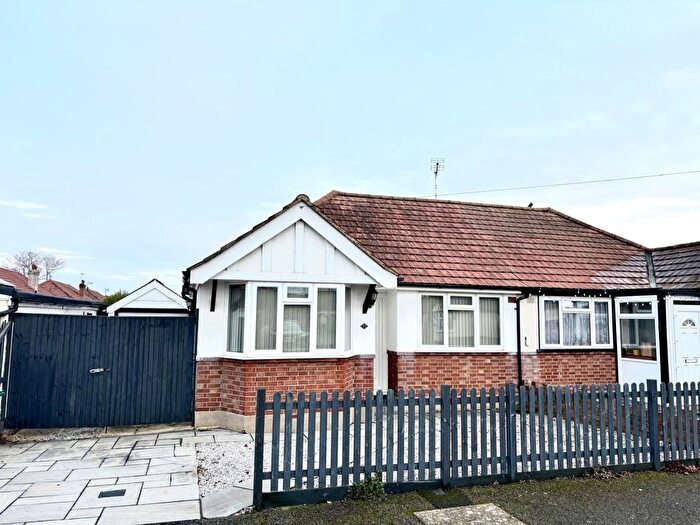
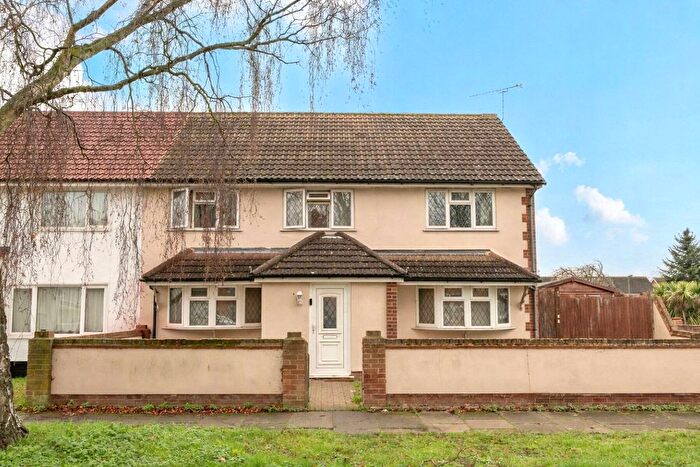
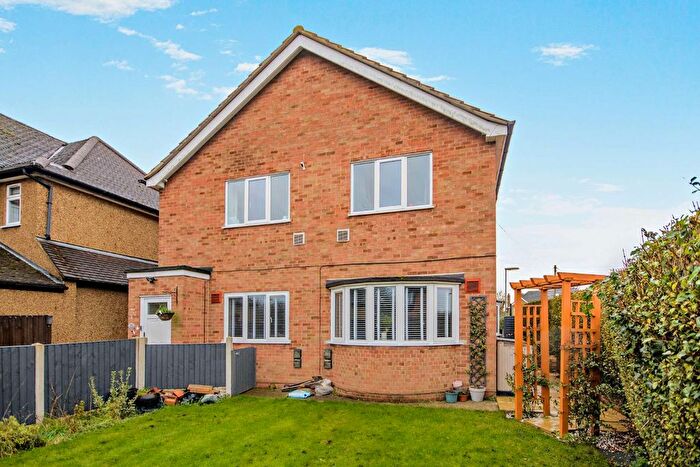
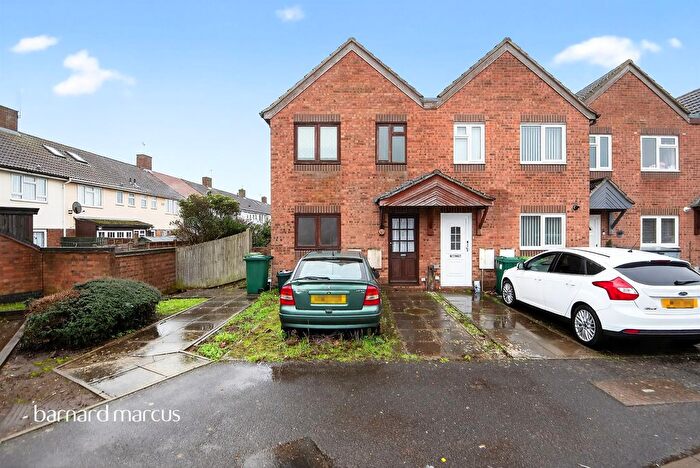
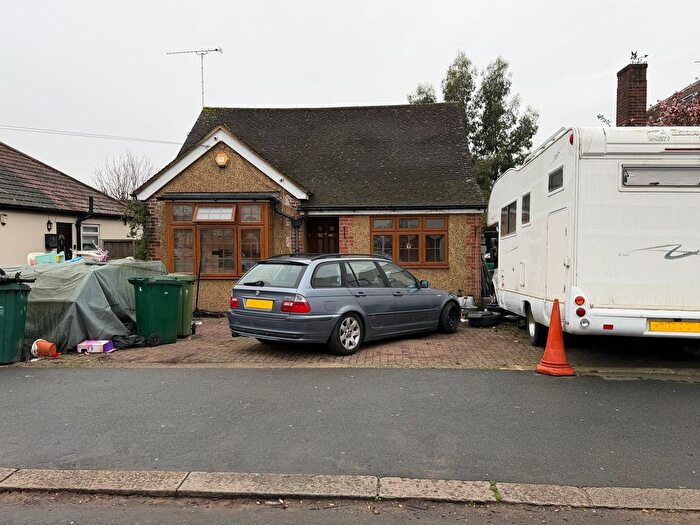
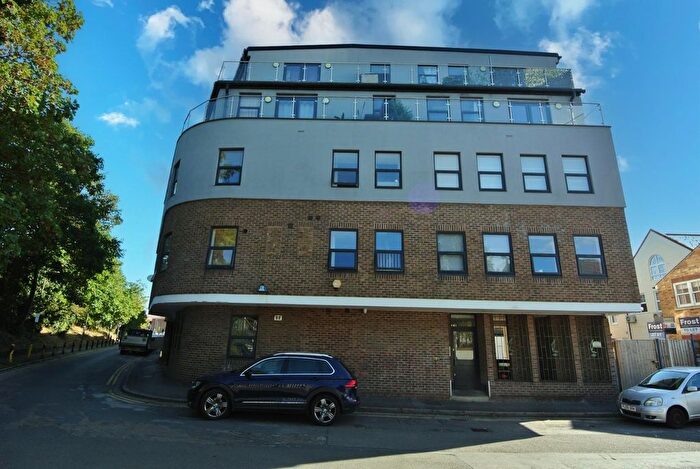
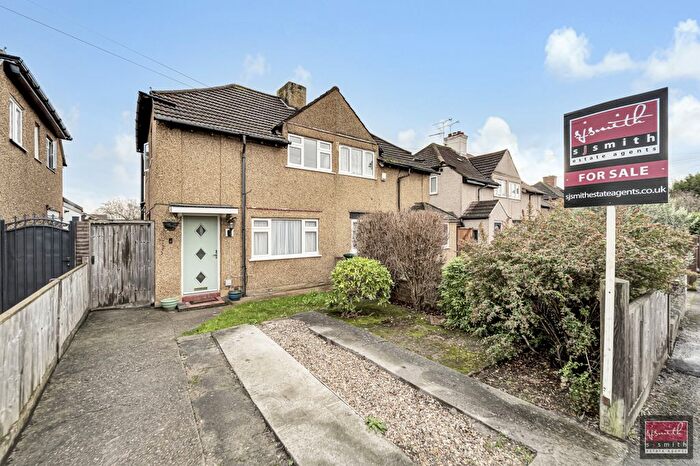
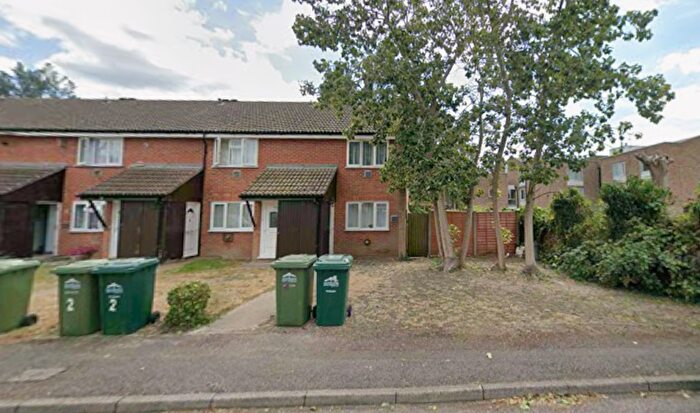
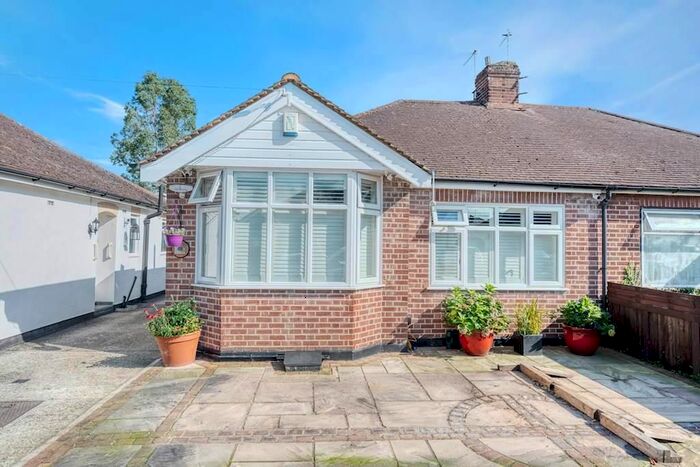
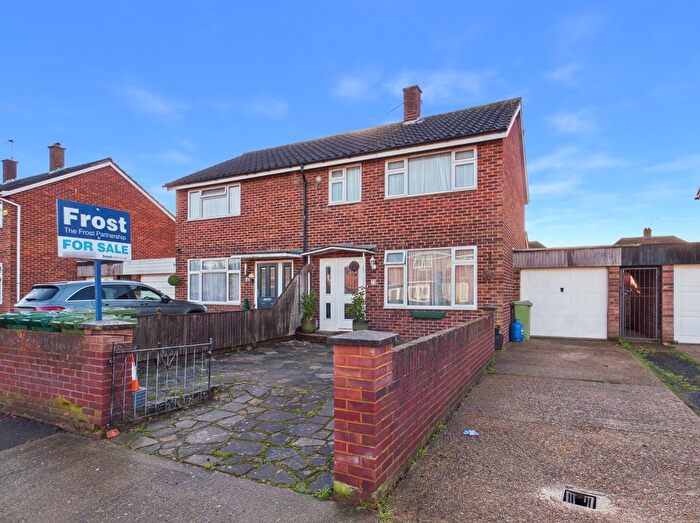
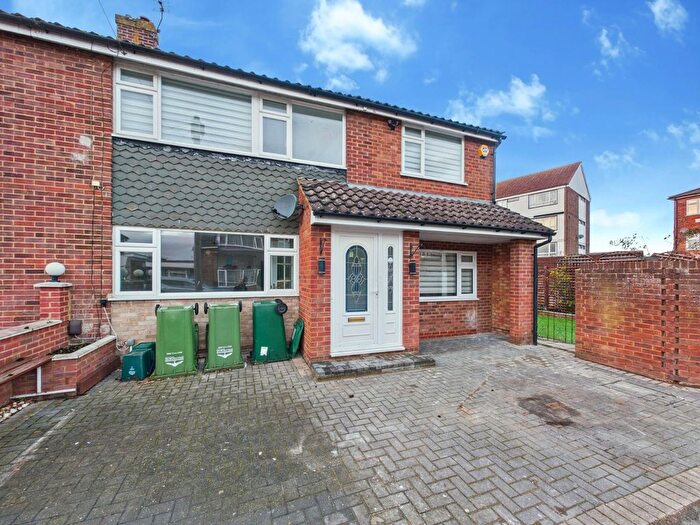
Properties for sale in Ashford North And Stanwell South
Previously listed properties in Ashford North And Stanwell South
Roads and Postcodes in Ashford North And Stanwell South
Navigate through our locations to find the location of your next house in Ashford North And Stanwell South, Staines-upon-thames for sale or to rent.
| Streets | Postcodes |
|---|---|
| Canopus Way | TW19 7TB |
| Clare Road | TW19 7QT TW19 7QU |
| Cranford Close | TW19 7SZ |
| Greenaway Terrace | TW19 7TT |
| Hadrian Way | TW19 7DJ TW19 7HT |
| Holywell Way | TW19 7SH |
| Long Lane | TW19 7AZ |
| Mulberry Avenue | TW19 7SF |
| Nares Close | TW19 7FB |
| Poole Lane | TW19 7DS TW19 7FJ |
| Short Lane | TW19 7BQ |
| Springs Close | TW19 7FE |
| Stone Well Road | TW19 7FF |
| Town Lane | TW19 7BZ TW19 7FG TW19 7FH TW19 7JP TW19 7PZ |
| Vernon Close | TW19 7TE |
| Victory Close | TW19 7RA TW19 7TF |
| Viscount Road | TW19 7RD |
| Yeoman Drive | TW19 7TJ |
Transport near Ashford North And Stanwell South
-
Ashford (Middlesex) Station
-
Heathrow Terminal 4 Station
-
Heathrow Terminal 5 Station
-
Staines Station
-
Heathrow Terminals 2 and 3 Station
-
Heathrow Terminals 1 2 3 Station
-
Hatton Cross Station
-
Feltham Station
- FAQ
- Price Paid By Year
- Property Type Price
Frequently asked questions about Ashford North And Stanwell South
What is the average price for a property for sale in Ashford North And Stanwell South?
The average price for a property for sale in Ashford North And Stanwell South is £305,530. This amount is 24% lower than the average price in Staines-upon-thames. There are 1,265 property listings for sale in Ashford North And Stanwell South.
What streets have the most expensive properties for sale in Ashford North And Stanwell South?
The streets with the most expensive properties for sale in Ashford North And Stanwell South are Short Lane at an average of £538,666, Poole Lane at an average of £450,000 and Holywell Way at an average of £359,888.
What streets have the most affordable properties for sale in Ashford North And Stanwell South?
The streets with the most affordable properties for sale in Ashford North And Stanwell South are Stone Well Road at an average of £224,531, Town Lane at an average of £262,218 and Viscount Road at an average of £292,000.
Which train stations are available in or near Ashford North And Stanwell South?
Some of the train stations available in or near Ashford North And Stanwell South are Ashford (Middlesex), Heathrow Terminal 4 and Heathrow Terminal 5.
Which tube stations are available in or near Ashford North And Stanwell South?
Some of the tube stations available in or near Ashford North And Stanwell South are Heathrow Terminal 4, Heathrow Terminal 5 and Heathrow Terminals 1 2 3.
Property Price Paid in Ashford North And Stanwell South by Year
The average sold property price by year was:
| Year | Average Sold Price | Price Change |
Sold Properties
|
|---|---|---|---|
| 2025 | £313,600 | -2% |
10 Properties |
| 2024 | £320,355 | 36% |
13 Properties |
| 2023 | £203,450 | -57% |
5 Properties |
| 2022 | £319,470 | 5% |
17 Properties |
| 2021 | £304,937 | -18% |
16 Properties |
| 2020 | £358,400 | 31% |
5 Properties |
| 2019 | £248,500 | -22% |
9 Properties |
| 2018 | £302,559 | -17% |
16 Properties |
| 2017 | £353,043 | 13% |
22 Properties |
| 2016 | £305,633 | 19% |
28 Properties |
| 2015 | £248,850 | 13% |
14 Properties |
| 2014 | £217,016 | -5% |
158 Properties |
| 2013 | £227,430 | -12% |
48 Properties |
| 2012 | £255,571 | -6% |
7 Properties |
| 2011 | £270,000 | 22% |
2 Properties |
| 2010 | £210,000 | -2% |
1 Property |
| 2009 | £215,000 | 3% |
1 Property |
| 2008 | £209,500 | -9% |
5 Properties |
| 2007 | £229,316 | 15% |
3 Properties |
| 2006 | £194,250 | 16% |
2 Properties |
| 2005 | £163,750 | 13% |
4 Properties |
| 2004 | £142,000 | 11% |
3 Properties |
| 2003 | £125,833 | 15% |
3 Properties |
| 2002 | £107,100 | 1% |
2 Properties |
| 2001 | £106,500 | 56% |
2 Properties |
| 2000 | £47,000 | -39% |
2 Properties |
| 1998 | £65,475 | 11% |
2 Properties |
| 1997 | £58,000 | -32% |
1 Property |
| 1996 | £76,598 | 24% |
5 Properties |
| 1995 | £58,000 | - |
1 Property |
Property Price per Property Type in Ashford North And Stanwell South
Here you can find historic sold price data in order to help with your property search.
The average Property Paid Price for specific property types in the last three years are:
| Property Type | Average Sold Price | Sold Properties |
|---|---|---|
| Semi Detached House | £475,250.00 | 4 Semi Detached Houses |
| Flat | £251,760.00 | 34 Flats |
| Detached House | £538,666.00 | 3 Detached Houses |
| Terraced House | £418,000.00 | 4 Terraced Houses |

