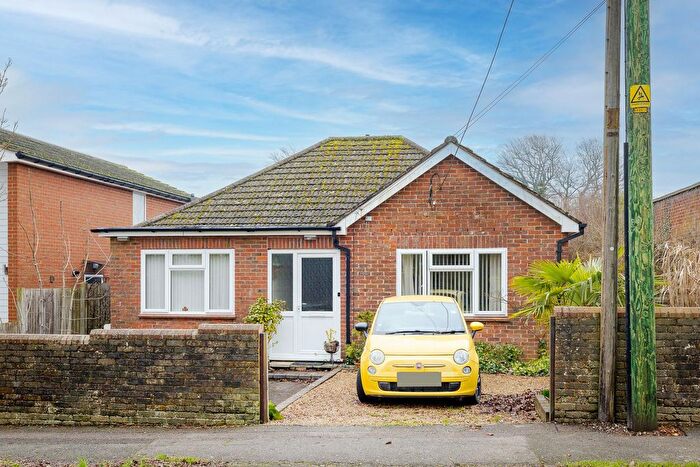
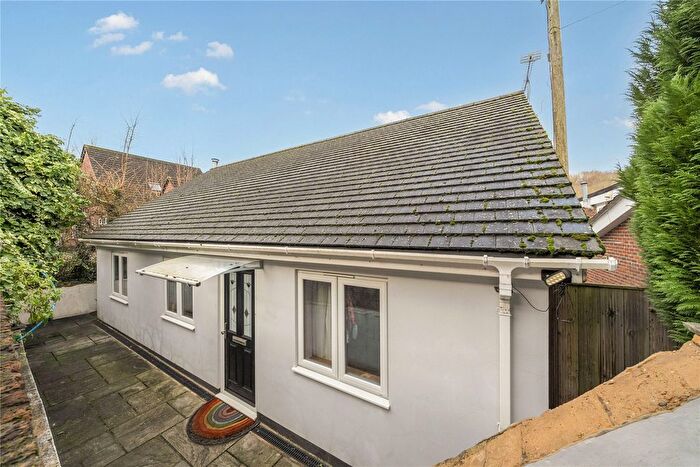
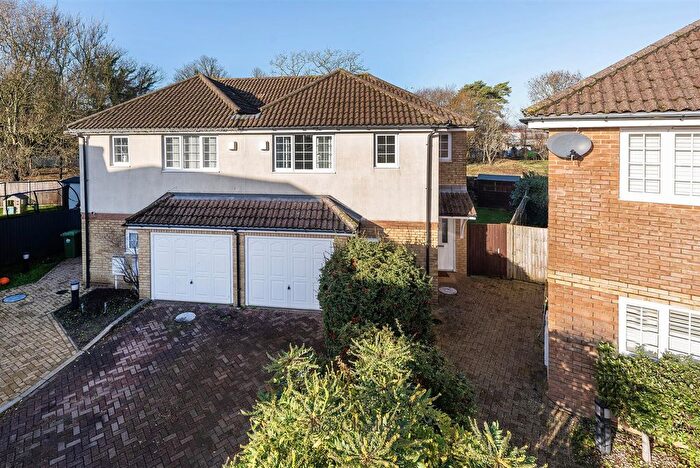
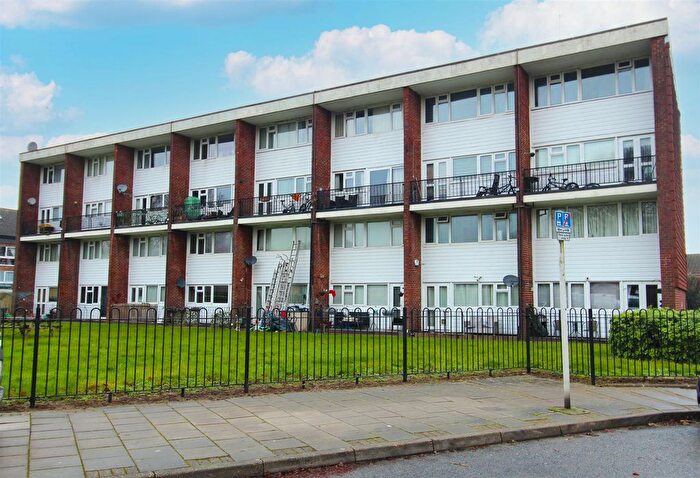
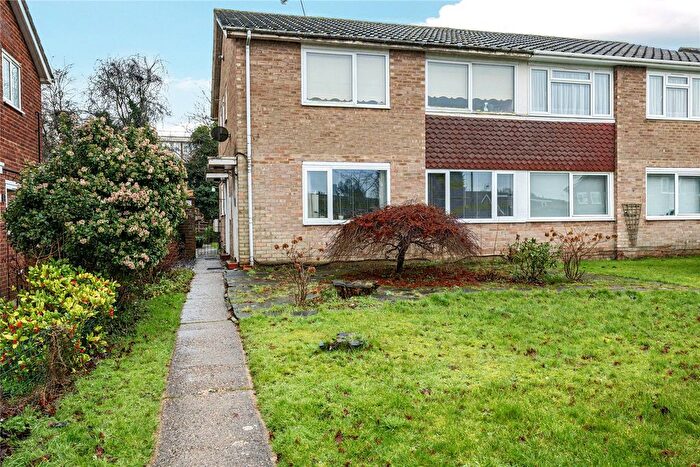
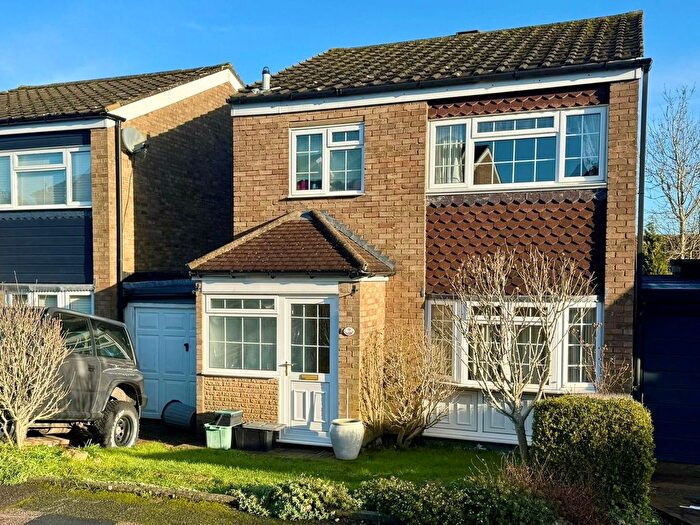
Houses for sale & to rent in Tatsfield And Titsey, Westerham
House Prices in Tatsfield And Titsey
Properties in Tatsfield And Titsey have an average house price of £611,356.00 and had 51 Property Transactions within the last 3 years¹.
Tatsfield And Titsey is an area in Westerham, Surrey with 695 households², where the most expensive property was sold for £1,200,000.00.
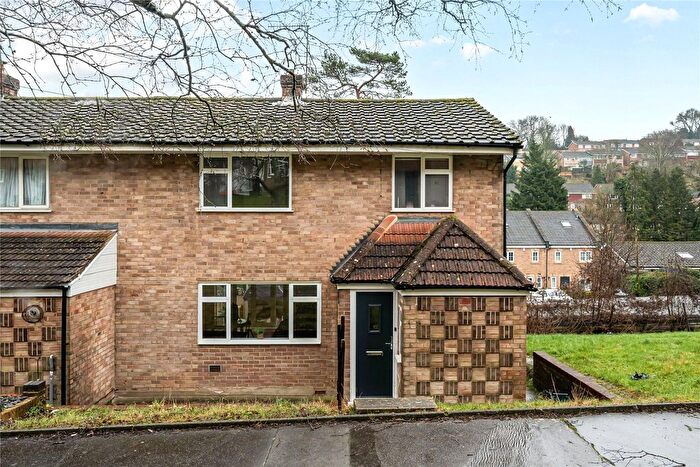
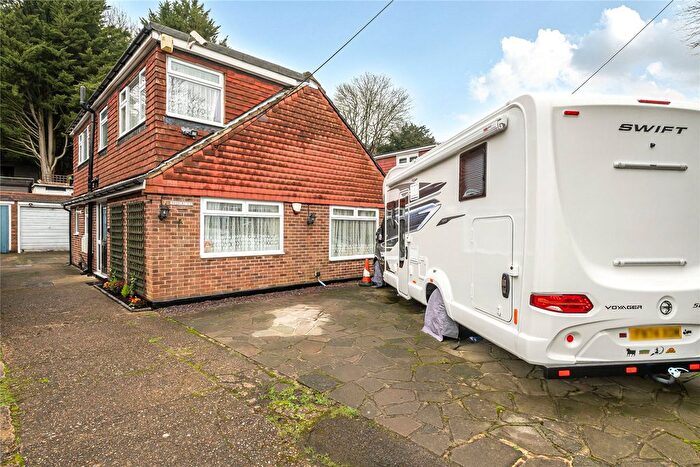
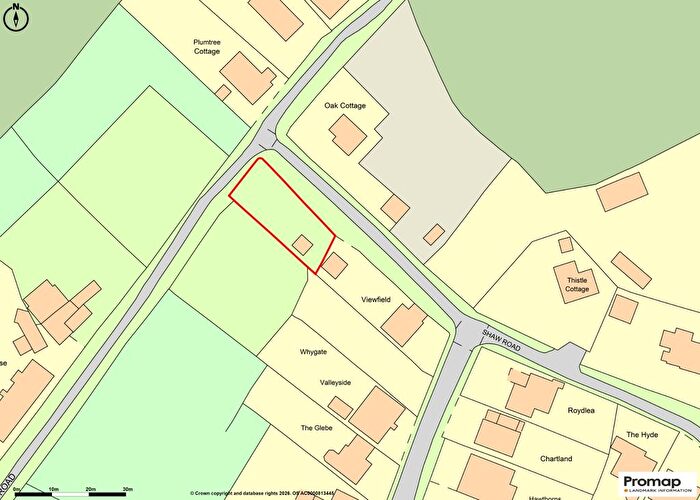
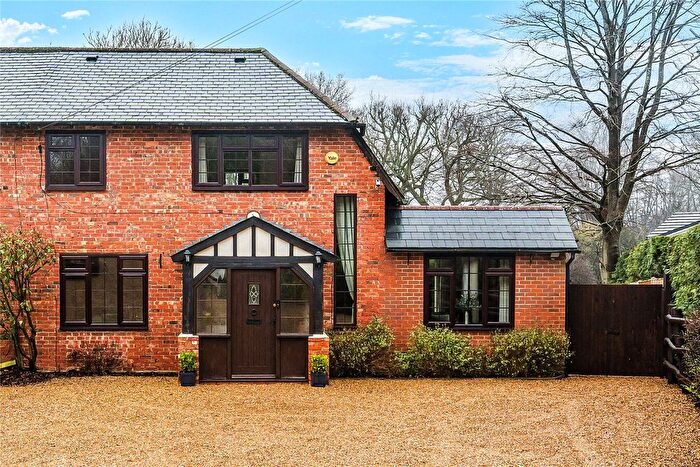
Properties for sale in Tatsfield And Titsey
Previously listed properties in Tatsfield And Titsey
Roads and Postcodes in Tatsfield And Titsey
Navigate through our locations to find the location of your next house in Tatsfield And Titsey, Westerham for sale or to rent.
| Streets | Postcodes |
|---|---|
| Barnfield Road | TN16 2LG |
| Bassetts | TN16 2DE |
| Borough Road | TN16 2LA |
| Chestnut Avenue | TN16 2EJ |
| Church Hill | TN16 2JX |
| Clacket Lane | TN16 2ER TN16 2EP |
| Clarks Lane | TN16 2EL TN16 2JU |
| Clontievey Cottages | TN16 2BA |
| Crossways | TN16 2BE TN16 2BL TN16 2BN TN16 2BW |
| Cudham Road | TN16 2NJ |
| Edgar Road | TN16 2LL |
| Georges Road | TN16 2AL |
| Goatsfield Road | TN16 2BU |
| Greenway | TN16 2BS TN16 2BT |
| Gresham Close | TN16 2DF |
| Grove Road | TN16 2BB |
| Gwynedd Close | TN16 2DG |
| Hillside Road | TN16 2NH |
| Johns Road | TN16 2AP |
| Kemsley Road | TN16 2BH |
| Kent Cottages | TN16 2EN |
| Lusted Hall Lane | TN16 2AE TN16 2NL |
| Maesmaur Road | TN16 2LD TN16 2LE |
| Manor Road | TN16 2ND TN16 2NT |
| Ninehams Road | TN16 2AJ TN16 2AN |
| Old Lane | TN16 2LH TN16 2LJ TN16 2LN |
| Parkside Cottages | TN16 2LP |
| Parkwood Road | TN16 2LT |
| Paynesfield Road | TN16 2AR TN16 2AT TN16 2BG TN16 2BQ |
| Rag Hill Close | TN16 2LR |
| Rag Hill Road | TN16 2LS TN16 2LU |
| Rectory Lane | TN16 2DA |
| Redhouse Road | TN16 2AB |
| Ricketts Hill Road | TN16 2NA TN16 2NB TN16 2NE TN16 2NF TN16 2NG |
| Shaw Road | TN16 2BX |
| Ship Hill | TN16 2AH TN16 2JY TN16 2LB |
| Shipfield Close | TN16 2AU |
| Tatsfield Approach Road | TN16 2JT |
| The Copse | TN16 2DB |
| The Parade | TN16 2AQ |
| The Square | TN16 2AS |
| Vern Place | TN16 2BF |
| Wedgwoods | TN16 2AF |
| Westerham Road | TN16 2EU |
| Westmore Green | TN16 2AD TN16 2AG TN16 2JS |
| Westmore Road | TN16 2AA TN16 2AX TN16 2AY TN16 2BD TN16 2BJ |
| Whitewood Cottages | TN16 2BP |
| TN16 2ET |
Transport near Tatsfield And Titsey
-
Oxted Station
-
Hurst Green Station
-
Woldingham Station
-
New Addington Station
-
King Henry's Drive Station
-
Fieldway Station
-
Whyteleafe South Station
-
Caterham Station
-
Upper Warlingham Station
- FAQ
- Price Paid By Year
- Property Type Price
Frequently asked questions about Tatsfield And Titsey
What is the average price for a property for sale in Tatsfield And Titsey?
The average price for a property for sale in Tatsfield And Titsey is £611,356. There are 680 property listings for sale in Tatsfield And Titsey.
What streets have the most expensive properties for sale in Tatsfield And Titsey?
The streets with the most expensive properties for sale in Tatsfield And Titsey are Parkwood Road at an average of £1,080,000, Rag Hill Close at an average of £940,000 and Redhouse Road at an average of £840,000.
What streets have the most affordable properties for sale in Tatsfield And Titsey?
The streets with the most affordable properties for sale in Tatsfield And Titsey are Wedgwoods at an average of £331,214, The Square at an average of £500,000 and Maesmaur Road at an average of £509,000.
Which train stations are available in or near Tatsfield And Titsey?
Some of the train stations available in or near Tatsfield And Titsey are Oxted, Hurst Green and Woldingham.
Property Price Paid in Tatsfield And Titsey by Year
The average sold property price by year was:
| Year | Average Sold Price | Price Change |
Sold Properties
|
|---|---|---|---|
| 2025 | £651,159 | 15% |
20 Properties |
| 2024 | £554,833 | -13% |
18 Properties |
| 2023 | £628,384 | -16% |
13 Properties |
| 2022 | £731,770 | 19% |
24 Properties |
| 2021 | £595,756 | 3% |
33 Properties |
| 2020 | £577,036 | 8% |
25 Properties |
| 2019 | £529,413 | -15% |
23 Properties |
| 2018 | £607,298 | -1% |
25 Properties |
| 2017 | £612,675 | 12% |
20 Properties |
| 2016 | £540,950 | -9% |
20 Properties |
| 2015 | £591,784 | 24% |
41 Properties |
| 2014 | £450,010 | 13% |
34 Properties |
| 2013 | £390,547 | 6% |
38 Properties |
| 2012 | £365,221 | -29% |
18 Properties |
| 2011 | £469,696 | 26% |
28 Properties |
| 2010 | £347,694 | -22% |
18 Properties |
| 2009 | £424,117 | 14% |
17 Properties |
| 2008 | £365,386 | 5% |
22 Properties |
| 2007 | £346,470 | -8% |
47 Properties |
| 2006 | £373,795 | 10% |
32 Properties |
| 2005 | £336,322 | 6% |
31 Properties |
| 2004 | £316,625 | 4% |
16 Properties |
| 2003 | £303,350 | 6% |
18 Properties |
| 2002 | £286,581 | 21% |
33 Properties |
| 2001 | £226,370 | 3% |
27 Properties |
| 2000 | £219,191 | 16% |
36 Properties |
| 1999 | £184,350 | -11% |
28 Properties |
| 1998 | £204,058 | 32% |
28 Properties |
| 1997 | £137,950 | 2% |
30 Properties |
| 1996 | £134,697 | -11% |
19 Properties |
| 1995 | £149,675 | - |
20 Properties |
Property Price per Property Type in Tatsfield And Titsey
Here you can find historic sold price data in order to help with your property search.
The average Property Paid Price for specific property types in the last three years are:
| Property Type | Average Sold Price | Sold Properties |
|---|---|---|
| Semi Detached House | £512,050.00 | 10 Semi Detached Houses |
| Detached House | £737,851.00 | 29 Detached Houses |
| Terraced House | £404,863.00 | 11 Terraced Houses |
| Flat | £207,500.00 | 1 Flat |

