Houses for sale & to rent in Windlesham, Windlesham
House Prices in Windlesham
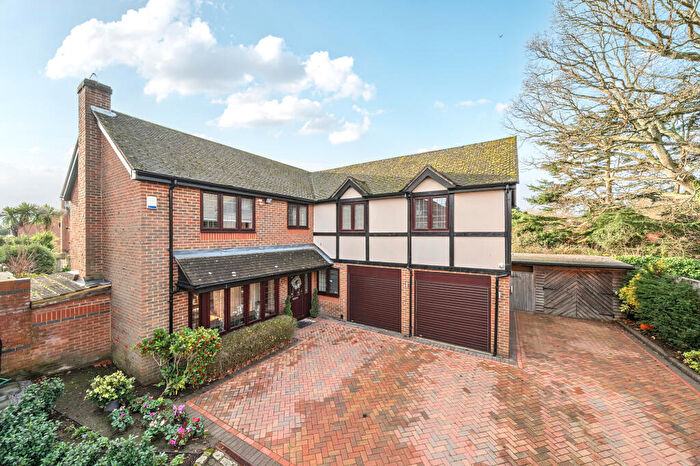
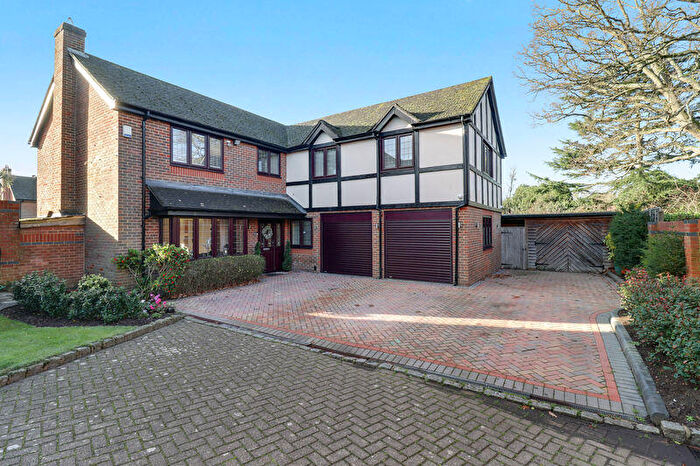
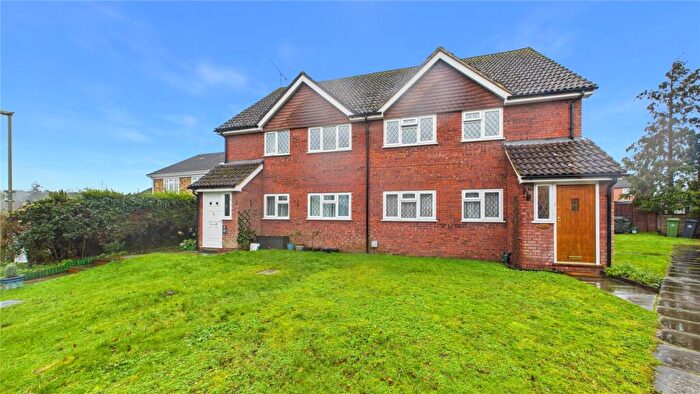
Properties in Windlesham have an average house price of £687,167.00 and had 154 Property Transactions within the last 3 years¹.
Windlesham is an area in Windlesham, Surrey with 1,728 households², where the most expensive property was sold for £3,650,000.00.
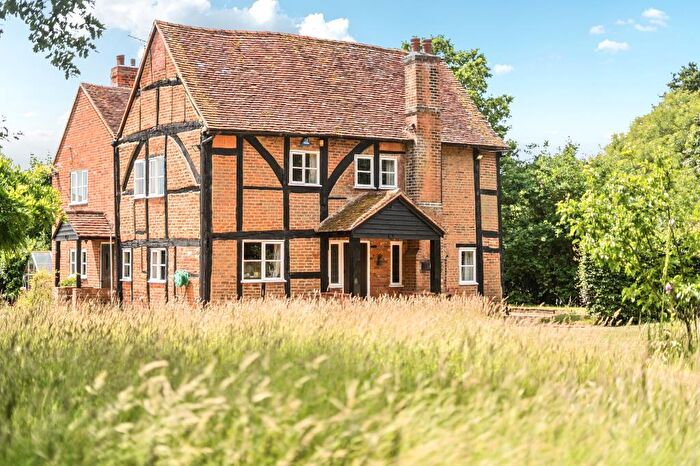
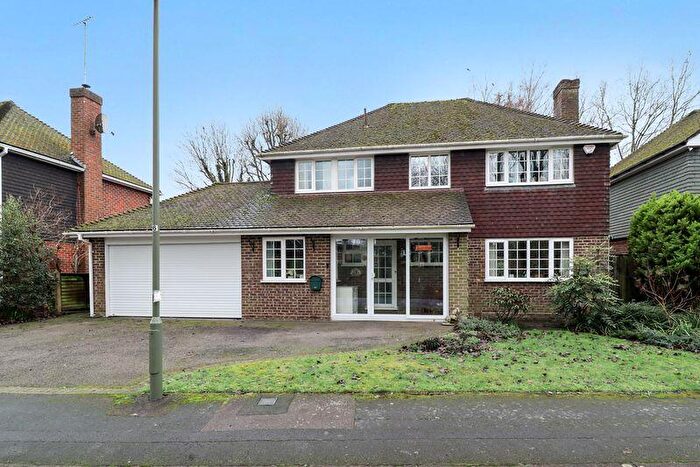
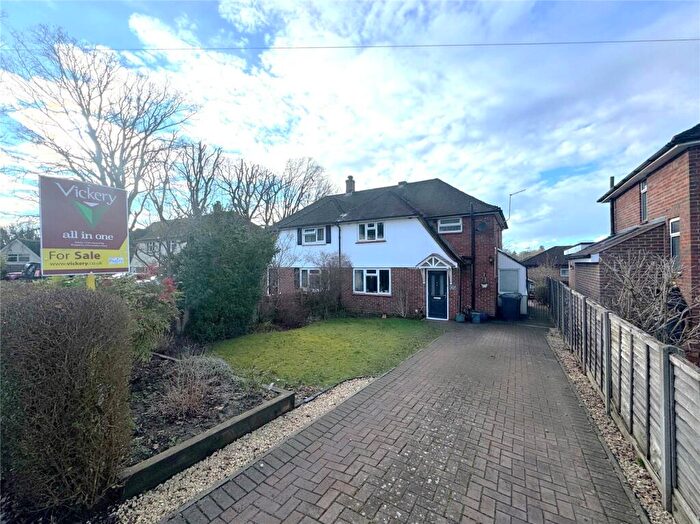
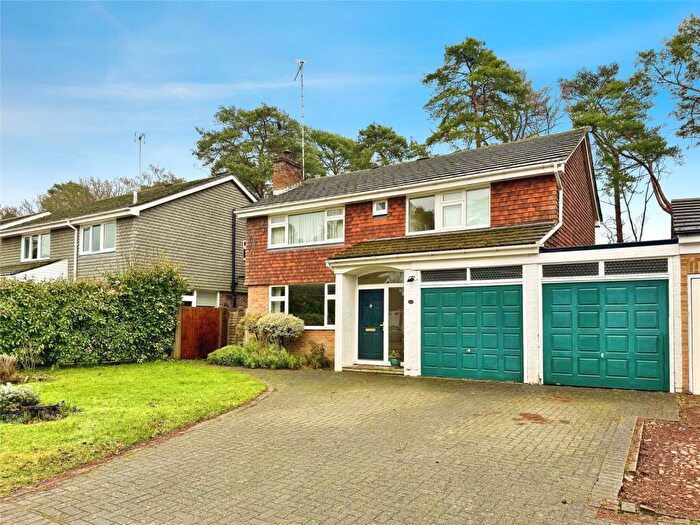
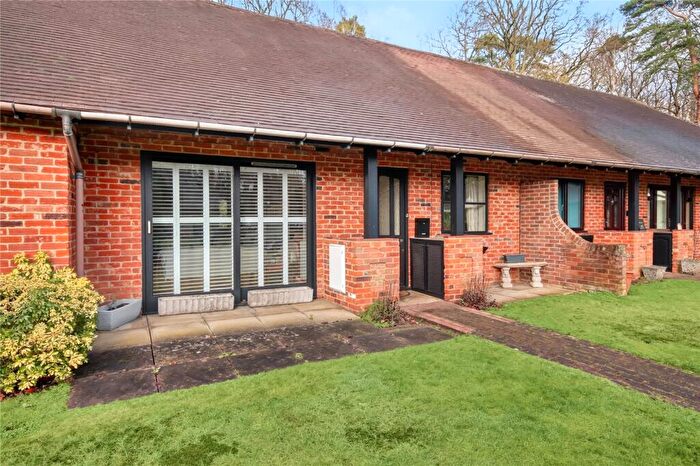
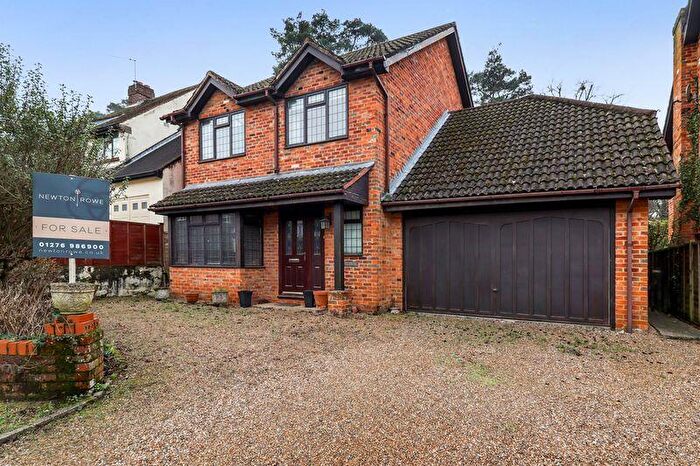
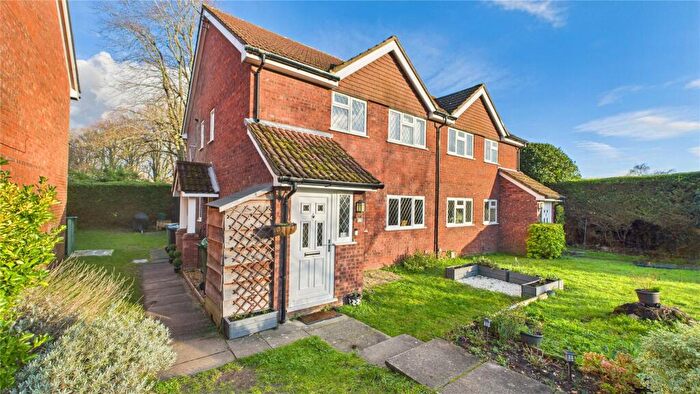
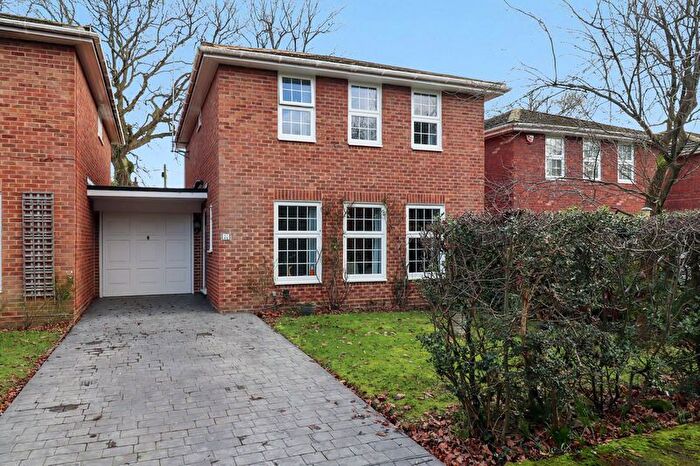
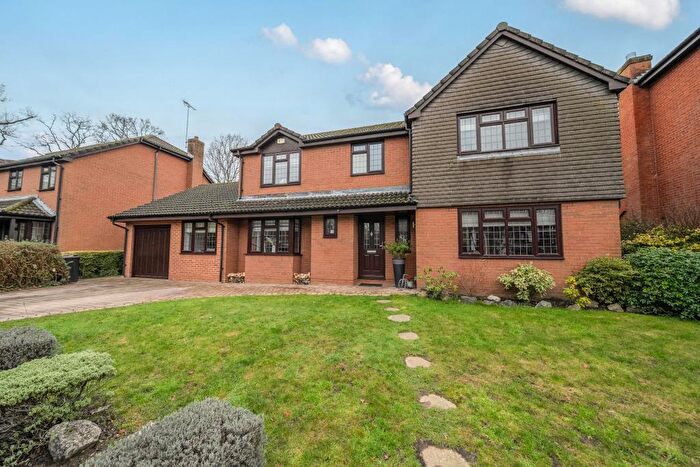
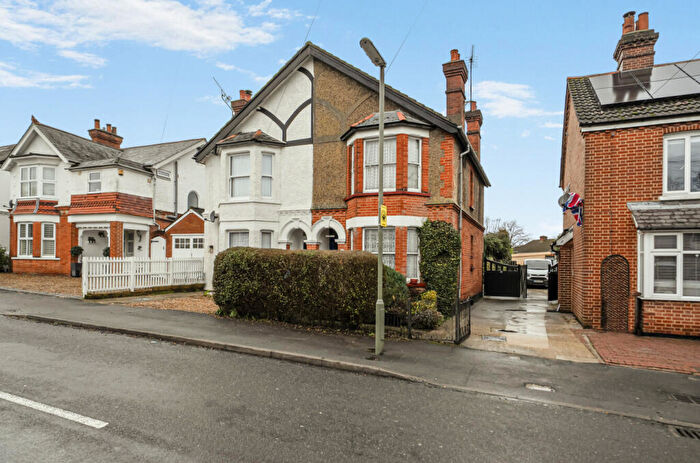
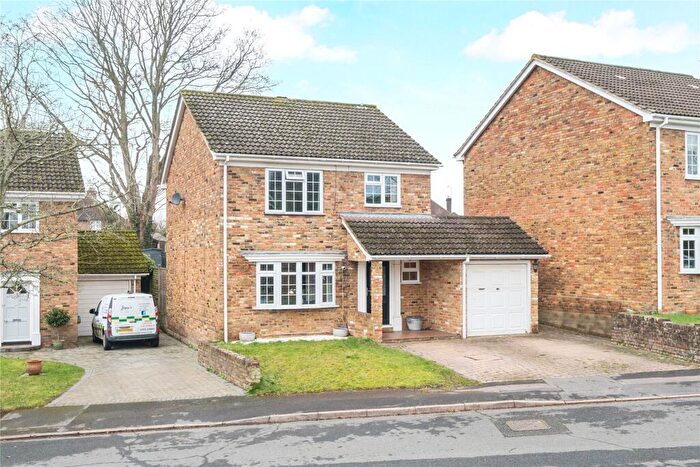
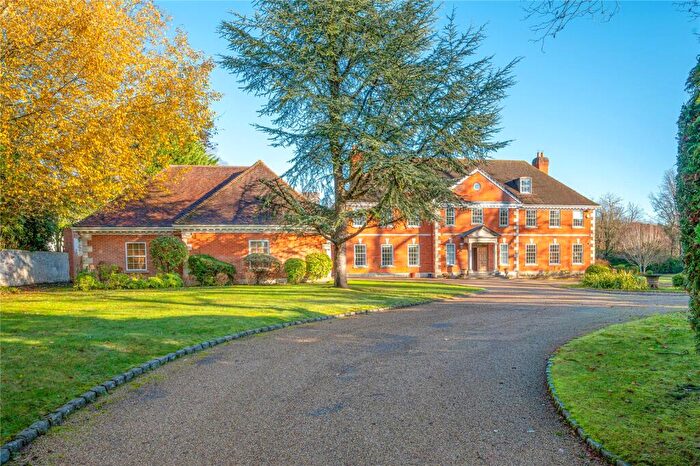
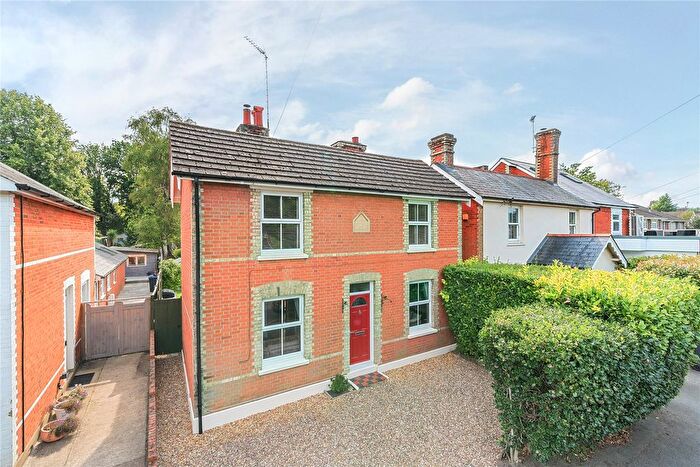
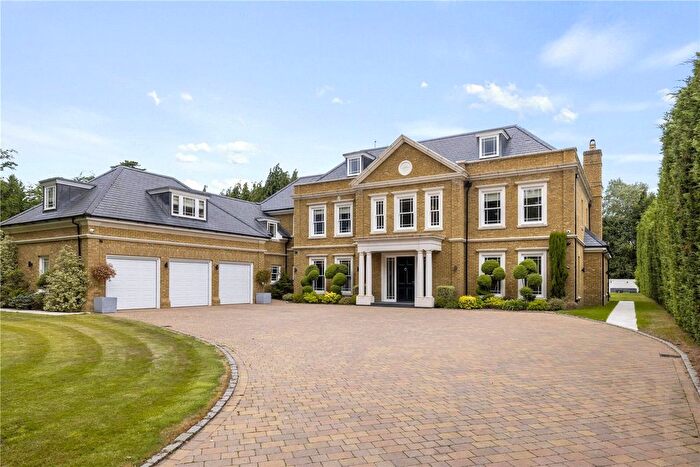
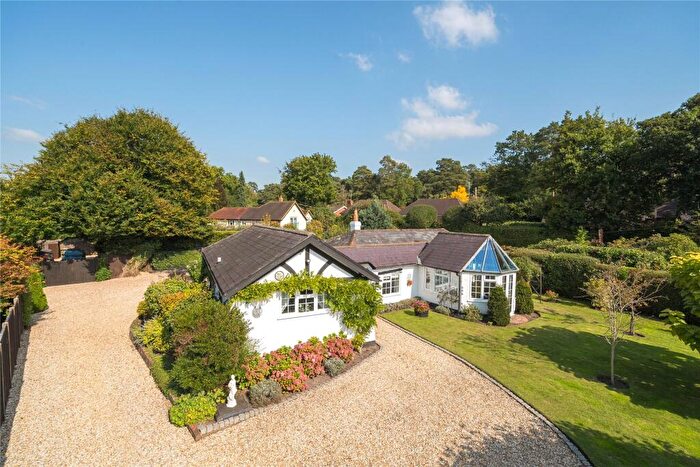
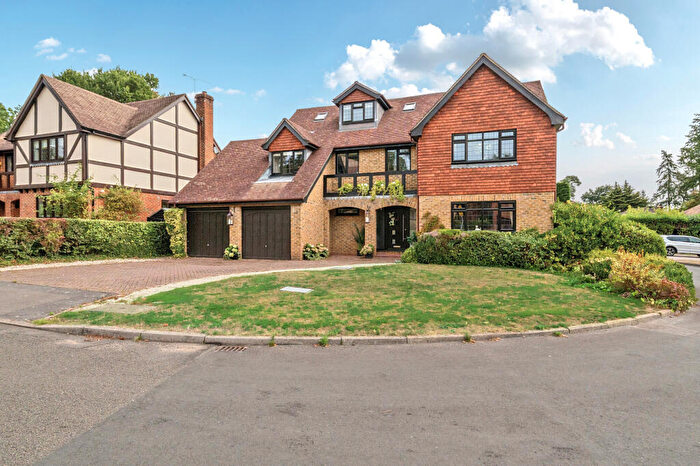
Properties for sale in Windlesham
Roads and Postcodes in Windlesham
Navigate through our locations to find the location of your next house in Windlesham, Windlesham for sale or to rent.
| Streets | Postcodes |
|---|---|
| Atfield Grove | GU20 6DP |
| Baigents Lane | GU20 6DU |
| Beech Cottages | GU20 6BP |
| Beech Walk | GU20 6HB |
| Bishops Grove | GU20 6QQ |
| Bosman Drive | GU20 6JN GU20 6JW |
| Broadley Green | GU20 6AJ GU20 6AL |
| Broadway Road | GU20 6BU GU20 6DA |
| Burton Close | GU20 6QJ |
| Caldwell Road | GU20 6JJ |
| Chertsey Road | GU20 6EN GU20 6EP GU20 6ET GU20 6EW GU20 6HD GU20 6HE GU20 6HP GU20 6HT GU20 6HU GU20 6HX GU20 6HY GU20 6HZ GU20 6JH |
| Chewter Lane | GU20 6JP |
| Church Road | GU20 6BH GU20 6BL GU20 6BN GU20 6BS GU20 6BT |
| Cochrane Place | GU20 6ED |
| Cooper Road | GU20 6EA |
| Crees Meadow | GU20 6QA |
| Cricketers Lane | GU20 6HA |
| Deans Court | GU20 6QE |
| Edward Road | GU20 6EX |
| Finney Drive | GU20 6EB |
| Fosters Grove | GU20 6JZ |
| Fromow Gardens | GU20 6QN |
| Glenhurst | GU20 6PR |
| Govett Grove | GU20 6EE |
| Graham Road | GU20 6QG |
| Hatch End | GU20 6QB |
| Hatton Hill | GU20 6AB GU20 6AD |
| Hawkes Leap | GU20 6JL |
| Heathpark Drive | GU20 6AR GU20 6JA GU20 6JB |
| Herrings Lane | GU20 6EZ |
| Highwaymans Ridge | GU20 6JY GU20 6NF |
| Hutton Close | GU20 6DN |
| Kennel Lane | GU20 6AA |
| Kent Road | GU20 6JF |
| Kimberley Cottages | GU20 6BZ |
| Kings Lane | GU20 6HR GU20 6JQ |
| Lawrence Crescent | GU20 6QL |
| Leycester Close | GU20 6JR |
| London Road | GU20 6LE GU20 6LG GU20 6LJ GU20 6LQ GU20 6NA GU20 6PG GU20 6PJ |
| Mill Pond Road | GU20 6JT |
| Molyneux Road | GU20 6QH |
| Moor Place | GU20 6JS |
| New Road | GU20 6BJ |
| Newark Road | GU20 6NE |
| Oakwood Road | GU20 6JD |
| Orchard Hill | GU20 6DB |
| Owen Road | GU20 6JG |
| Pine Grove | GU20 6AW |
| Poplar Avenue | GU20 6PL GU20 6PN GU20 6PW |
| Ramsay Road | GU20 6HS |
| Rectory Lane | GU20 6BW |
| Rosslea | GU20 6PS |
| School Lane | GU20 6EY |
| School Road | GU20 6PA GU20 6PB GU20 6PD |
| Smithys Green | GU20 6QF |
| Snows Paddock | GU20 6LH |
| Snows Ride | GU20 6LA GU20 6LN GU20 6PE |
| Sunninghill Road | GU20 6PP |
| Thorndown Lane | GU20 6DD GU20 6DE GU20 6DF GU20 6DG GU20 6DJ GU20 6DQ |
| Turpins Rise | GU20 6NG GU20 6NQ |
| Updown Hill | GU20 6AF GU20 6AG GU20 6DL GU20 6DS GU20 6DT GU20 6DW GU20 6DX |
| Westwood Road | GU20 6AE GU20 6LP GU20 6LR GU20 6LS GU20 6LT GU20 6LW GU20 6LX GU20 6NB |
| White Hill | GU20 6JU |
| Windle Close | GU20 6DY GU20 6DZ |
| Windmill Field | GU20 6QD |
| Woodlands Lane | GU20 6AH GU20 6AN GU20 6AP GU20 6AQ GU20 6AS GU20 6AT |
| Wynsham Way | GU20 6JX |
Transport near Windlesham
- FAQ
- Price Paid By Year
- Property Type Price
Frequently asked questions about Windlesham
What is the average price for a property for sale in Windlesham?
The average price for a property for sale in Windlesham is £687,167. This amount is 0.04% lower than the average price in Windlesham. There are 1,416 property listings for sale in Windlesham.
What streets have the most expensive properties for sale in Windlesham?
The streets with the most expensive properties for sale in Windlesham are Westwood Road at an average of £3,650,000, Hatton Hill at an average of £1,850,000 and Snows Ride at an average of £1,367,500.
What streets have the most affordable properties for sale in Windlesham?
The streets with the most affordable properties for sale in Windlesham are Fromow Gardens at an average of £183,000, Deans Court at an average of £334,000 and Lawrence Crescent at an average of £337,500.
Which train stations are available in or near Windlesham?
Some of the train stations available in or near Windlesham are Bagshot, Sunningdale and Ascot.
Property Price Paid in Windlesham by Year
The average sold property price by year was:
| Year | Average Sold Price | Price Change |
Sold Properties
|
|---|---|---|---|
| 2025 | £673,190 | -10% |
46 Properties |
| 2024 | £741,945 | 13% |
55 Properties |
| 2023 | £642,452 | -37% |
53 Properties |
| 2022 | £882,268 | 0,2% |
69 Properties |
| 2021 | £880,594 | -9% |
85 Properties |
| 2020 | £963,883 | 29% |
65 Properties |
| 2019 | £681,978 | -5% |
88 Properties |
| 2018 | £716,805 | -30% |
67 Properties |
| 2017 | £928,825 | 22% |
63 Properties |
| 2016 | £722,929 | 25% |
79 Properties |
| 2015 | £538,637 | -2% |
78 Properties |
| 2014 | £552,006 | -8% |
72 Properties |
| 2013 | £596,130 | 22% |
65 Properties |
| 2012 | £462,675 | -38% |
59 Properties |
| 2011 | £640,370 | 26% |
63 Properties |
| 2010 | £474,622 | 7% |
61 Properties |
| 2009 | £441,976 | -14% |
60 Properties |
| 2008 | £503,241 | -23% |
47 Properties |
| 2007 | £617,260 | 17% |
116 Properties |
| 2006 | £510,358 | 5% |
111 Properties |
| 2005 | £485,998 | 16% |
103 Properties |
| 2004 | £407,847 | -2% |
80 Properties |
| 2003 | £414,975 | 17% |
85 Properties |
| 2002 | £345,467 | 12% |
120 Properties |
| 2001 | £302,893 | 7% |
99 Properties |
| 2000 | £281,082 | 0,3% |
116 Properties |
| 1999 | £280,172 | 23% |
109 Properties |
| 1998 | £214,478 | 6% |
108 Properties |
| 1997 | £201,025 | 7% |
128 Properties |
| 1996 | £187,341 | 15% |
94 Properties |
| 1995 | £159,394 | - |
85 Properties |
Property Price per Property Type in Windlesham
Here you can find historic sold price data in order to help with your property search.
The average Property Paid Price for specific property types in the last three years are:
| Property Type | Average Sold Price | Sold Properties |
|---|---|---|
| Semi Detached House | £603,743.00 | 37 Semi Detached Houses |
| Detached House | £833,813.00 | 87 Detached Houses |
| Terraced House | £428,423.00 | 13 Terraced Houses |
| Flat | £316,117.00 | 17 Flats |

