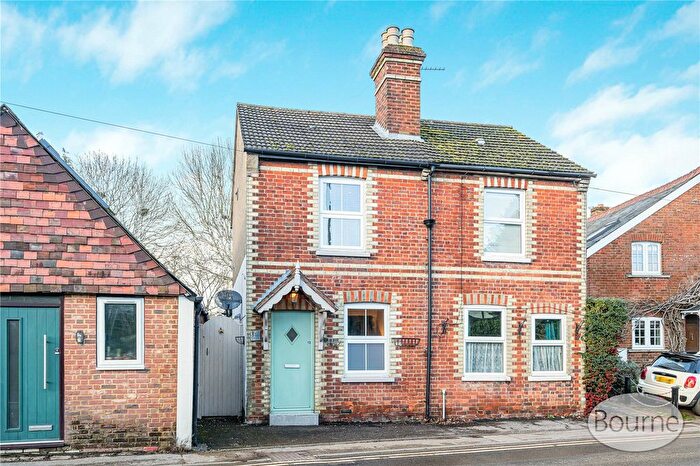
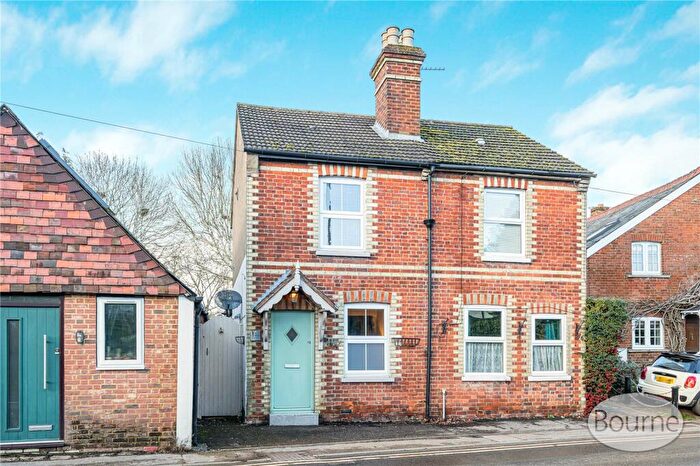
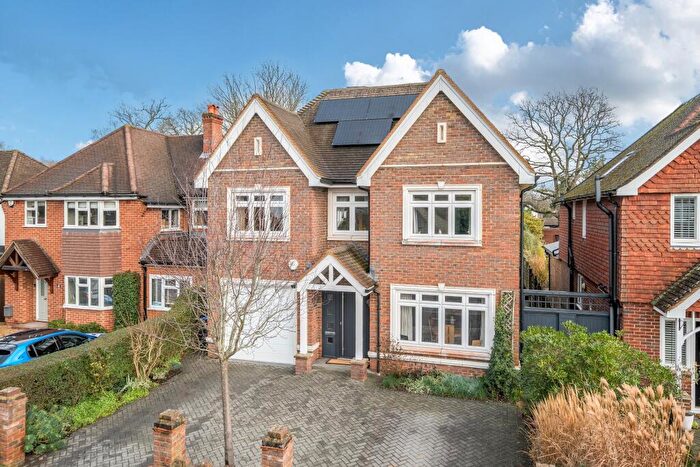
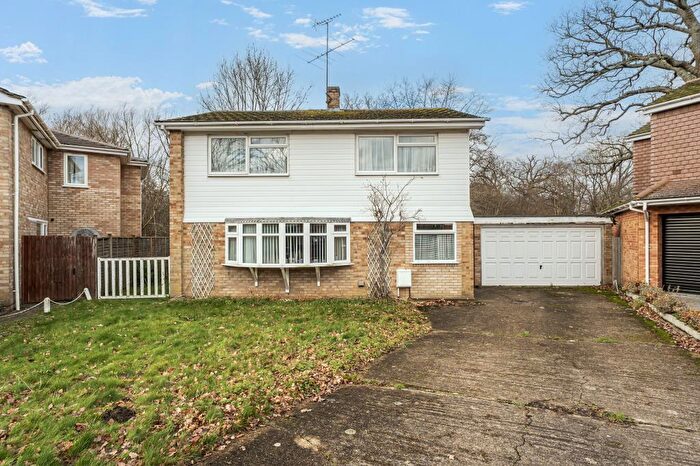
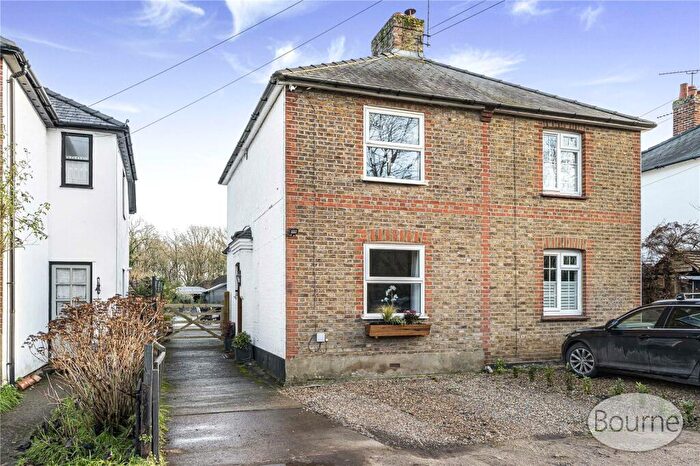
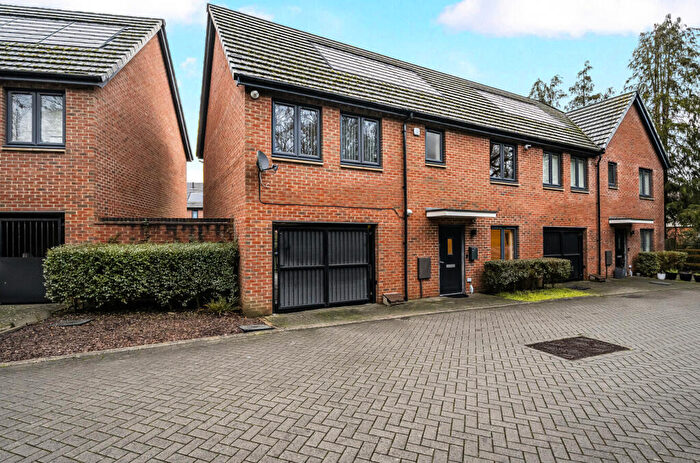
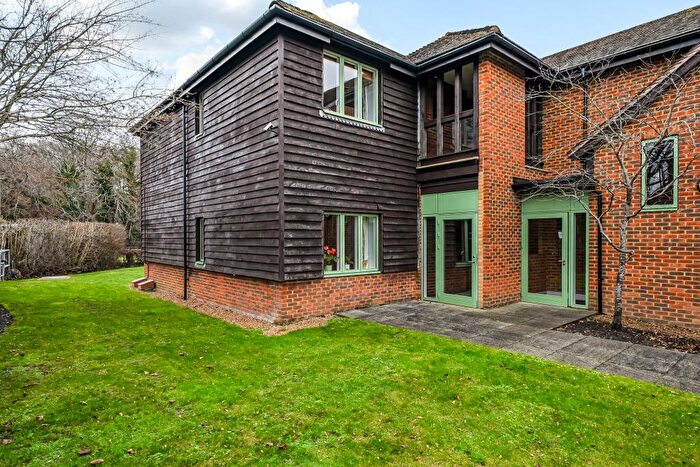
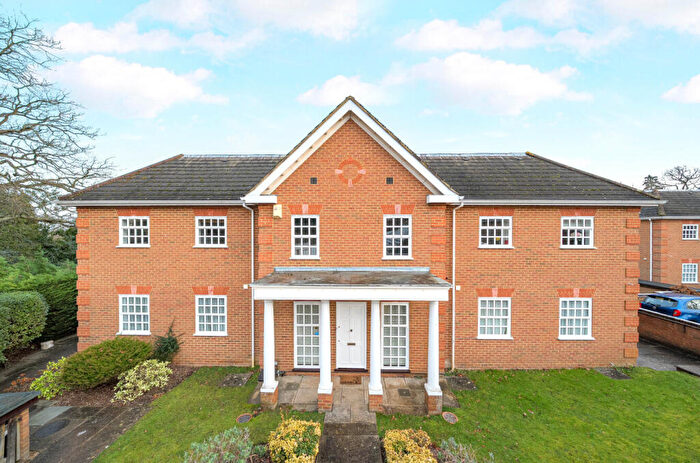
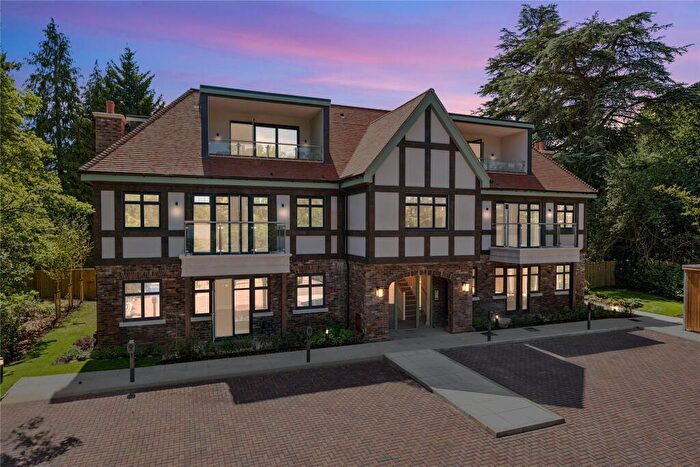
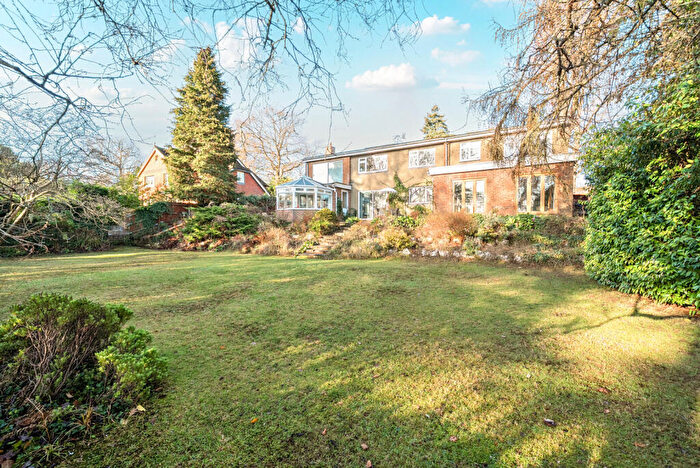
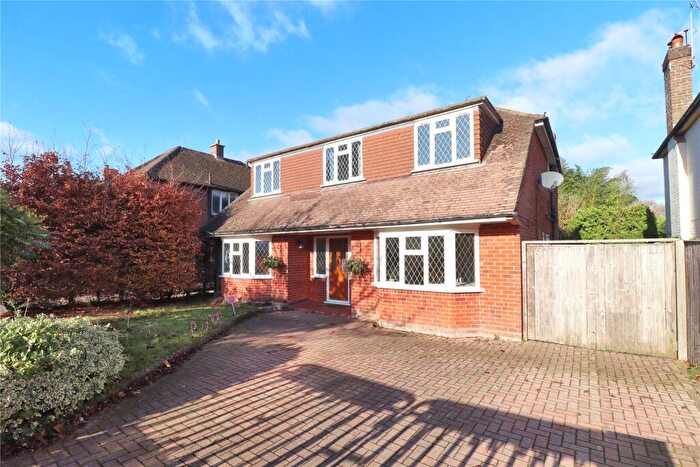
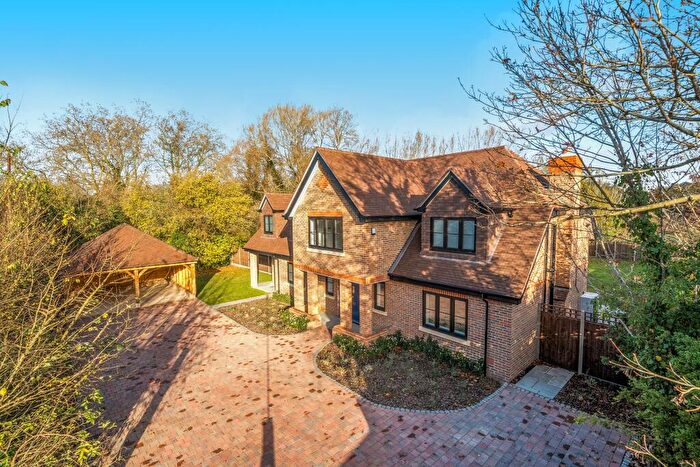
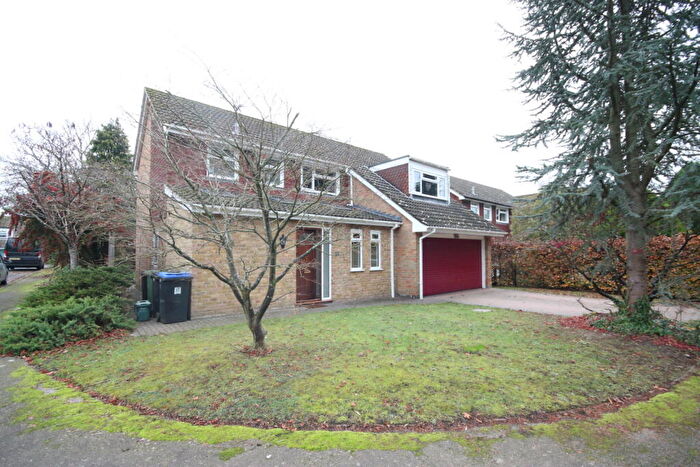
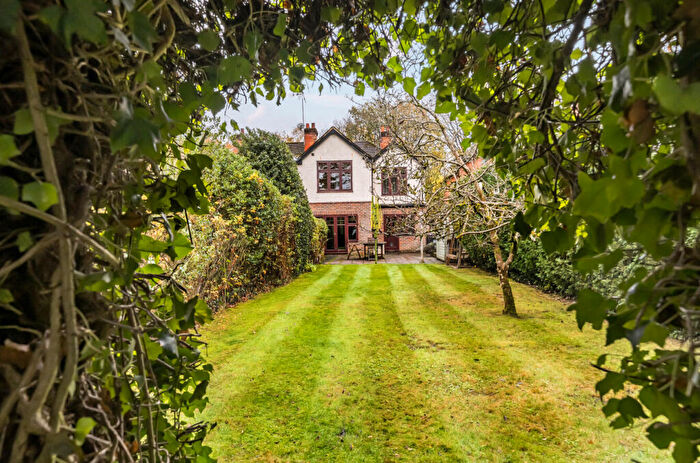
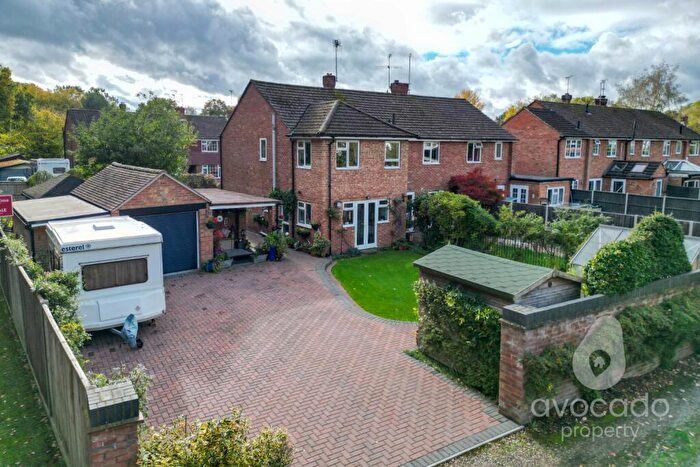
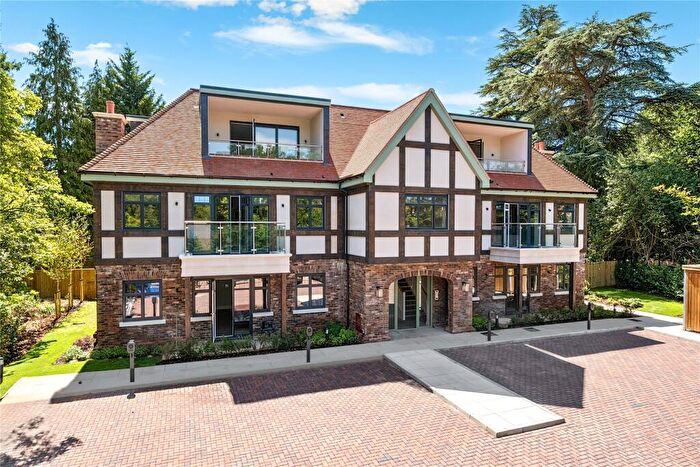
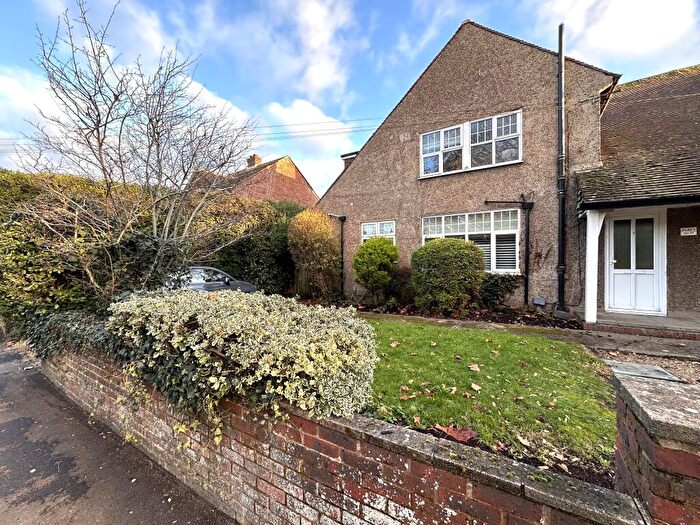
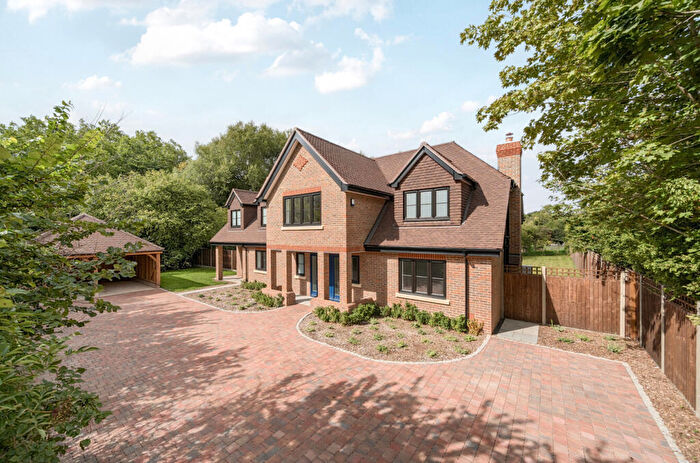
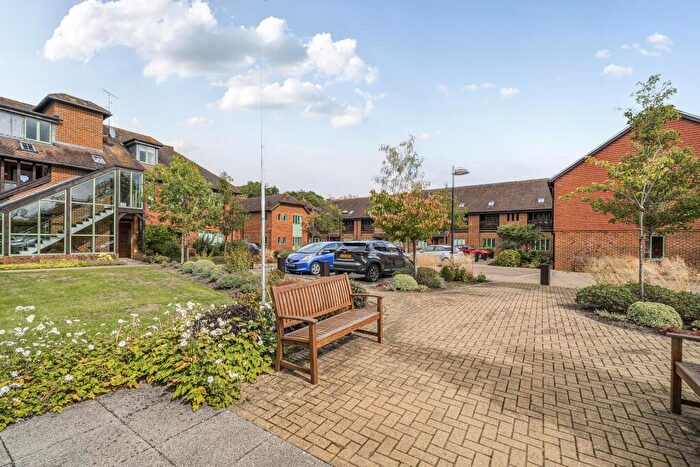
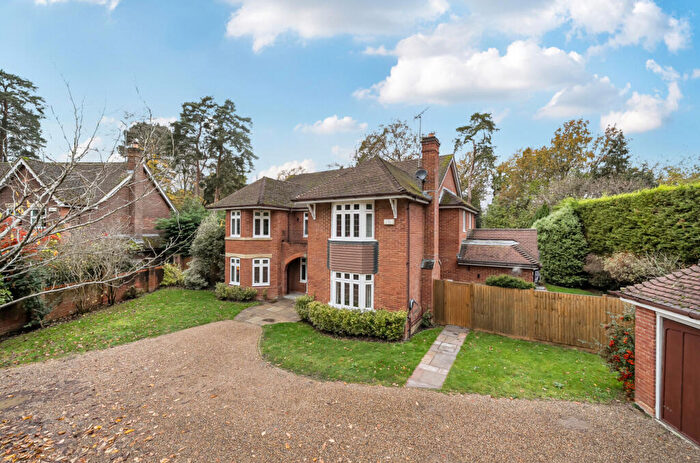
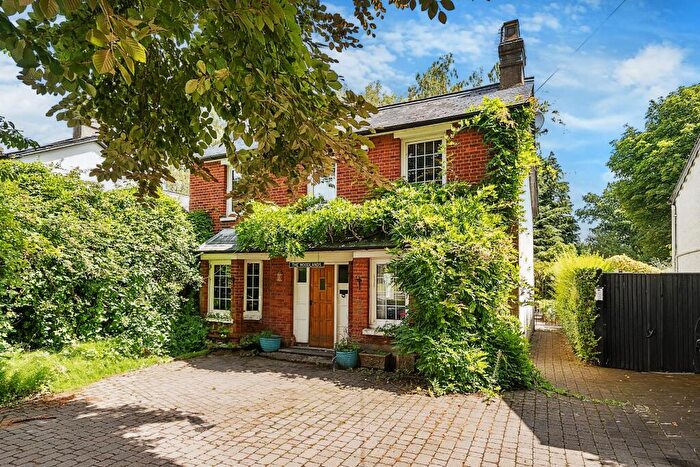
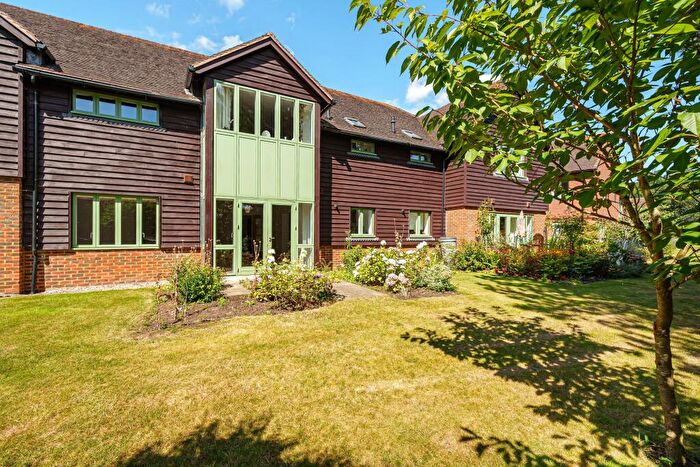
Houses for sale & to rent in Mayford And Sutton Green, Woking
House Prices in Mayford And Sutton Green
Properties in Mayford And Sutton Green have an average house price of £777,885.00 and had 89 Property Transactions within the last 3 years¹.
Mayford And Sutton Green is an area in Woking, Surrey with 819 households², where the most expensive property was sold for £2,625,000.00.
Properties for sale in Mayford And Sutton Green
Roads and Postcodes in Mayford And Sutton Green
Navigate through our locations to find the location of your next house in Mayford And Sutton Green, Woking for sale or to rent.
| Streets | Postcodes |
|---|---|
| Beech Grove | GU22 0SX |
| Beech Hill | GU22 0SB |
| Bonners Close | GU22 9RA |
| Bourne Way | GU22 9QU |
| Chiltern Close | GU22 0PL |
| Drakes Way | GU22 0NX |
| Egley Drive | GU22 0NJ |
| Egley Road | GU22 0NH GU22 0NQ |
| Ellis Farm Close | GU22 9QN |
| Goose Lane | GU22 0NW |
| Greenmeads | GU22 9QJ GU22 9QL |
| Guildford Road | GU22 0SA GU22 0SD GU22 0SE GU22 0SQ GU22 9QT GU22 9QX |
| Highlands Lane | GU22 9PU |
| Honeypots Road | GU22 9QW |
| Hook Hill Lane | GU22 0PS |
| Kemishford | GU22 0RL GU22 0RP |
| Maybourne Rise | GU22 0SH |
| Mayford Close | GU22 9QS |
| Mayford Green | GU22 0NL GU22 0PN GU22 0PR |
| Moor Lane | GU22 9RB |
| Prey Heath | GU22 0SL GU22 0SN |
| Prey Heath Close | GU22 0SP |
| Prey Heath Road | GU22 0RN GU22 0RW GU22 0SW |
| Pyle Hill | GU22 0SR |
| Rosebank Cottages | GU22 9QZ |
| Saunders Copse | GU22 0NS |
| Saunders Lane | GU22 0NN GU22 0NR GU22 0NT GU22 0NU |
| Smarts Heath Road | GU22 0NP |
| Westfield Road | GU22 9AX GU22 9QA GU22 9QP GU22 9QR |
| Woodpecker Way | GU22 0SG |
Transport near Mayford And Sutton Green
- FAQ
- Price Paid By Year
- Property Type Price
Frequently asked questions about Mayford And Sutton Green
What is the average price for a property for sale in Mayford And Sutton Green?
The average price for a property for sale in Mayford And Sutton Green is £777,885. This amount is 41% higher than the average price in Woking. There are 360 property listings for sale in Mayford And Sutton Green.
What streets have the most expensive properties for sale in Mayford And Sutton Green?
The streets with the most expensive properties for sale in Mayford And Sutton Green are Beech Hill at an average of £1,285,000, Prey Heath Road at an average of £1,229,166 and Prey Heath Close at an average of £1,119,416.
What streets have the most affordable properties for sale in Mayford And Sutton Green?
The streets with the most affordable properties for sale in Mayford And Sutton Green are Egley Drive at an average of £442,500, Bonners Close at an average of £459,333 and Kemishford at an average of £535,000.
Which train stations are available in or near Mayford And Sutton Green?
Some of the train stations available in or near Mayford And Sutton Green are Worplesdon, Woking and Brookwood.
Property Price Paid in Mayford And Sutton Green by Year
The average sold property price by year was:
| Year | Average Sold Price | Price Change |
Sold Properties
|
|---|---|---|---|
| 2025 | £653,250 | -29% |
26 Properties |
| 2024 | £840,414 | 2% |
27 Properties |
| 2023 | £821,002 | -5% |
36 Properties |
| 2022 | £858,621 | 26% |
33 Properties |
| 2021 | £637,880 | -3% |
40 Properties |
| 2020 | £658,558 | -12% |
34 Properties |
| 2019 | £735,913 | 12% |
30 Properties |
| 2018 | £649,709 | 8% |
26 Properties |
| 2017 | £598,167 | -15% |
28 Properties |
| 2016 | £689,743 | 4% |
43 Properties |
| 2015 | £664,612 | 2% |
35 Properties |
| 2014 | £651,700 | 33% |
40 Properties |
| 2013 | £433,548 | -25% |
34 Properties |
| 2012 | £540,014 | 19% |
31 Properties |
| 2011 | £439,552 | -9% |
38 Properties |
| 2010 | £479,577 | 5% |
47 Properties |
| 2009 | £454,208 | -7% |
36 Properties |
| 2008 | £486,397 | -27% |
22 Properties |
| 2007 | £618,906 | 25% |
31 Properties |
| 2006 | £465,663 | 10% |
48 Properties |
| 2005 | £418,236 | 3% |
41 Properties |
| 2004 | £406,016 | 3% |
25 Properties |
| 2003 | £392,284 | 17% |
33 Properties |
| 2002 | £324,024 | 11% |
41 Properties |
| 2001 | £289,456 | 15% |
30 Properties |
| 2000 | £246,641 | 6% |
28 Properties |
| 1999 | £231,067 | 19% |
48 Properties |
| 1998 | £186,755 | -4% |
26 Properties |
| 1997 | £193,296 | 12% |
39 Properties |
| 1996 | £170,527 | 13% |
33 Properties |
| 1995 | £147,948 | - |
27 Properties |
Property Price per Property Type in Mayford And Sutton Green
Here you can find historic sold price data in order to help with your property search.
The average Property Paid Price for specific property types in the last three years are:
| Property Type | Average Sold Price | Sold Properties |
|---|---|---|
| Semi Detached House | £644,857.00 | 21 Semi Detached Houses |
| Detached House | £938,728.00 | 49 Detached Houses |
| Terraced House | £541,680.00 | 6 Terraced Houses |
| Flat | £495,538.00 | 13 Flats |

