
Houses for sale in Sutton London Borough, England
House Prices in Sutton London Borough
Properties in Sutton London Borough have
an average house price of
£484k
and had 7,856 Property Transactions
within the last 3 years.¹
Sutton London Borough is a location in
England with
82,558 households², where the most expensive property was sold for £3.15M.
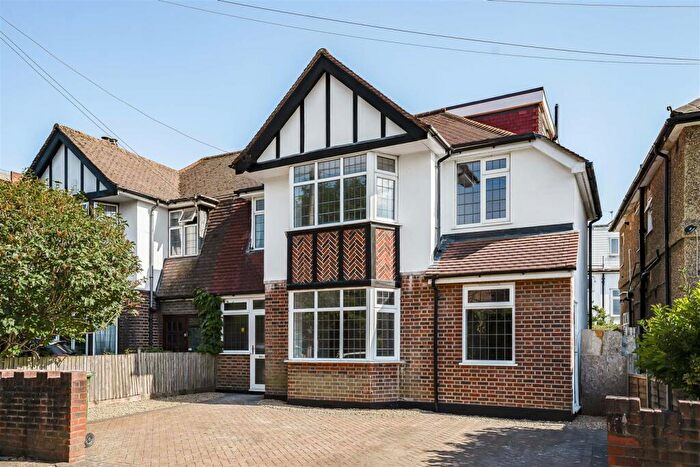
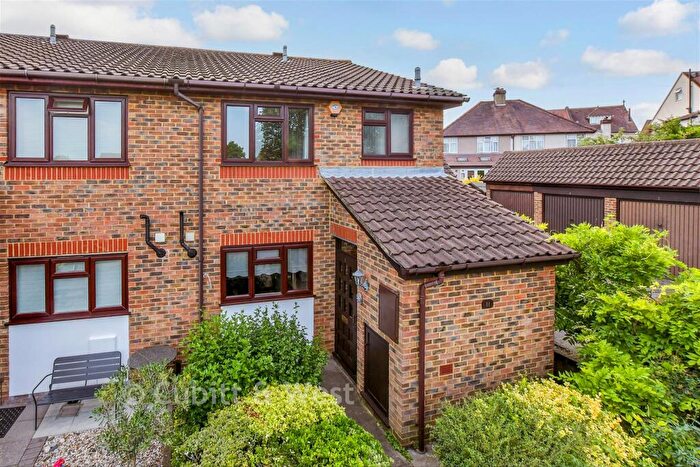
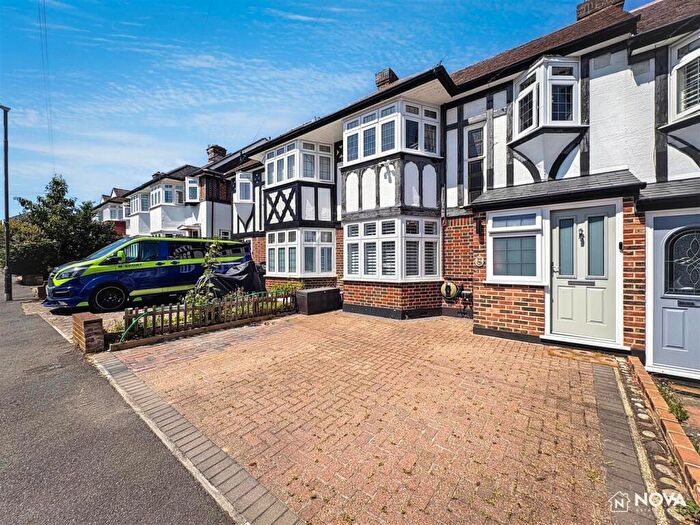
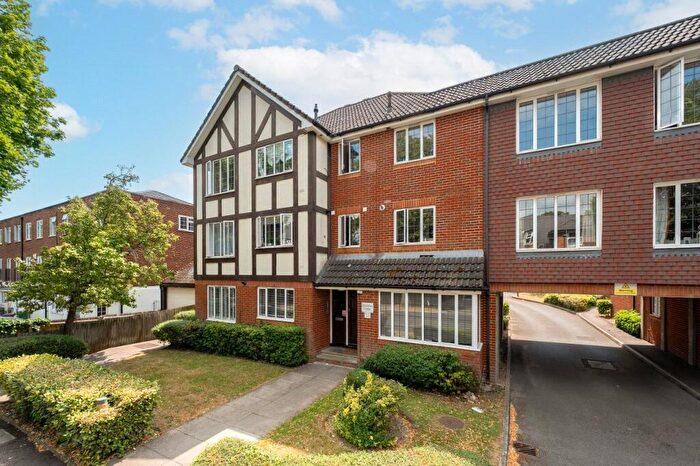
Properties for sale in Sutton London Borough
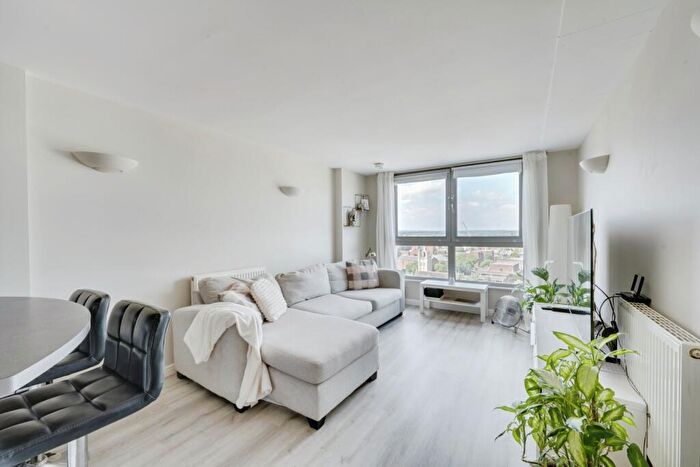
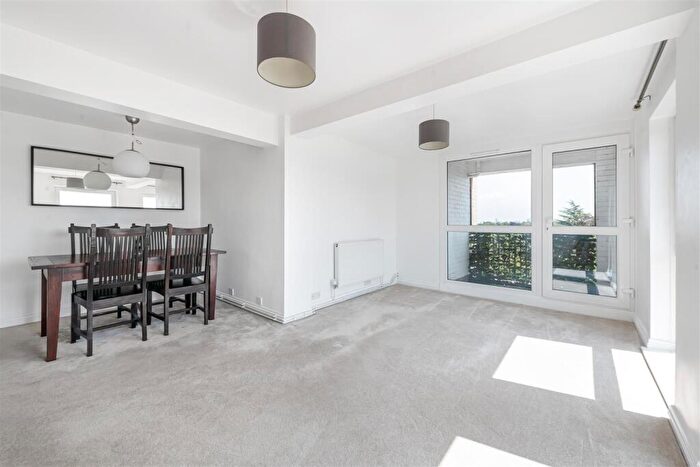
![]()
If you are looking to sell your house, let it out, or receive a property valuation, an expert can help you.
Click the button below to get started.
Towns in Sutton London Borough
Navigate through our locations to find the location of your next house in Sutton, England for sale or to rent.
Property price trends in Sutton London Borough
According to the latest Land Registry data, the average home in Sutton London Borough sold for £451,538 in 2026. That figure comes from a substantial record of 109,968 sales logged over the past 31 years.
Prices have fallen back over the last three years. Compared with 2023, when the typical sale came in around £482,290, that's a fall of roughly 6.4%.
Looking back five years, average prices are down about 1.5% since 2021, a drop of around £6,811 in cash terms.
Zoom out to the past decade for the fuller picture. Back in 2016, homes here averaged £384,445, so the typical sold price has climbed about 17.5% since then, roughly 1.6% a year. Stretch the view to fifteen years and that annual pace edges up closer to 3.6%.
Frequently asked questions about Sutton London Borough
What is the average price for a property for sale in Sutton London Borough?
The average price for a property for sale in Sutton London Borough is £484,137. This amount is 35% higher than the average price in England. There are more than 10,000 property listings for sale in Sutton London Borough.
What locations have the most expensive properties for sale in Sutton London Borough?
The locations with the most expensive properties for sale in Sutton London Borough are Banstead at an average of £1,270,583, Purley at an average of £843,074 and Epsom at an average of £652,548.
What locations have the most affordable properties for sale in Sutton London Borough?
The locations with the most affordable properties for sale in Sutton London Borough are Mitcham at an average of £328,487, Croydon at an average of £419,896 and Morden at an average of £427,858.
Which train stations are available in or near Sutton London Borough?
Some of the train stations available in or near Sutton London Borough are Sutton, Carshalton and Carshalton Beeches.
Property Price Paid in Sutton London Borough by Year
The average sold property price by year was:
| Year | Average Sold Price | Price Change |
Sold Properties
|
|---|---|---|---|
| 2026 | £451,538 | -8% |
409 Properties |
| 2025 | £486,777 | -0,4% |
2,464 Properties |
| 2024 | £488,574 | 1% |
2,551 Properties |
| 2023 | £482,290 | 0,4% |
2,432 Properties |
| 2022 | £480,518 | 5% |
3,006 Properties |
| 2021 | £458,349 | 4% |
3,764 Properties |
| 2020 | £438,720 | 4% |
2,538 Properties |
| 2019 | £419,056 | 0,4% |
2,732 Properties |
| 2018 | £417,397 | 4% |
2,854 Properties |
| 2017 | £399,039 | 4% |
3,178 Properties |
Property Price per Property Type in Sutton London Borough
Here you can find historic sold price data in order to help with your property search.
The average Property Paid Price for specific property types in the last three years are:
| Property Type | Average Sold Price | Sold Properties |
|---|---|---|
| Semi Detached House | £628,802.00 | 1,830 Semi Detached Houses |
| Terraced House | £491,240.00 | 2,396 Terraced Houses |
| Detached House | £936,477.00 | 679 Detached Houses |
| Flat | £284,579.00 | 2,951 Flats |
Transport in Sutton London Borough
Please see below transportation links in this area:
