
Houses for sale & to rent in Eastcott, Swindon
House Prices in Eastcott
Properties in Eastcott have an average house price of £224k and had 630 Property Transactions within the last 3 years¹.
Eastcott is an area in Swindon, Swindon with 4,909 households², where the most expensive property was sold for £900k.
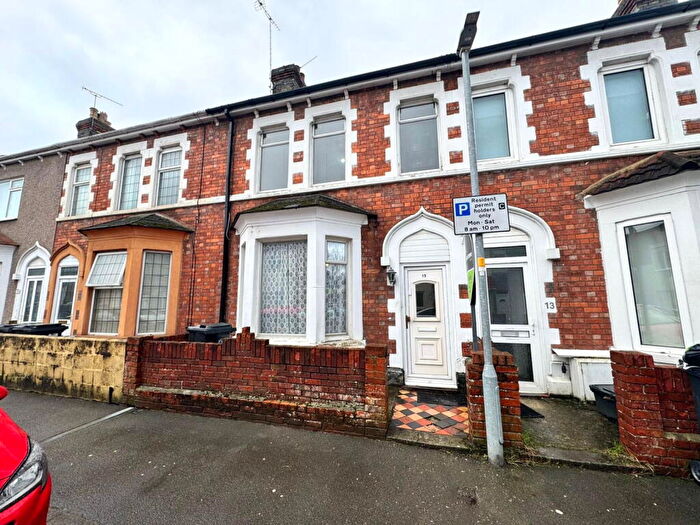
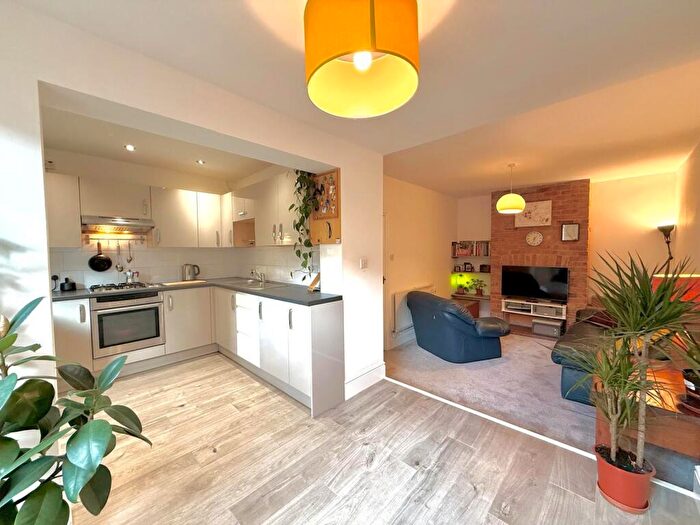
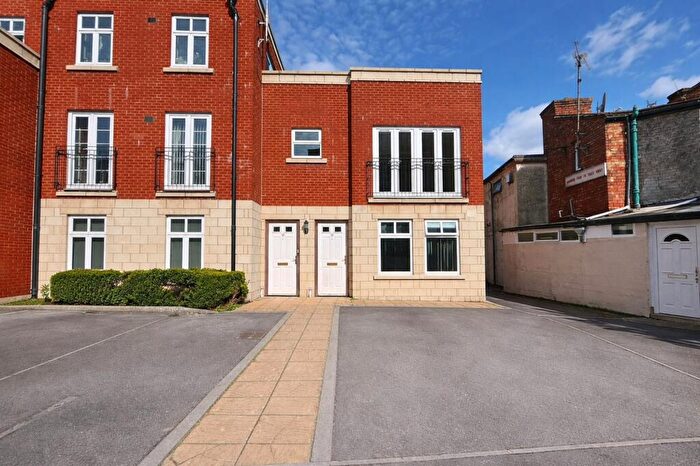
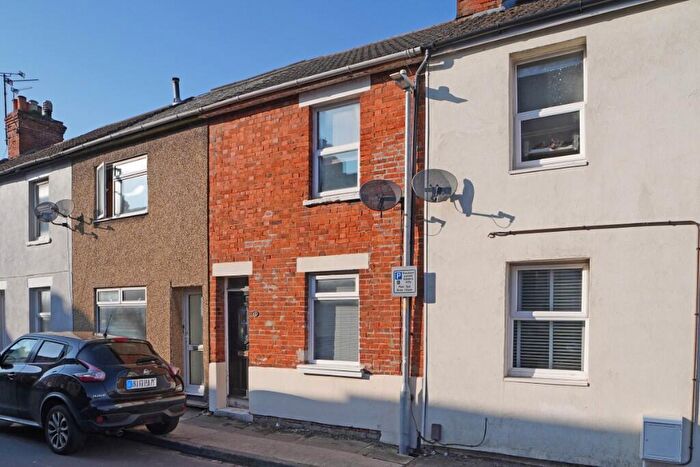
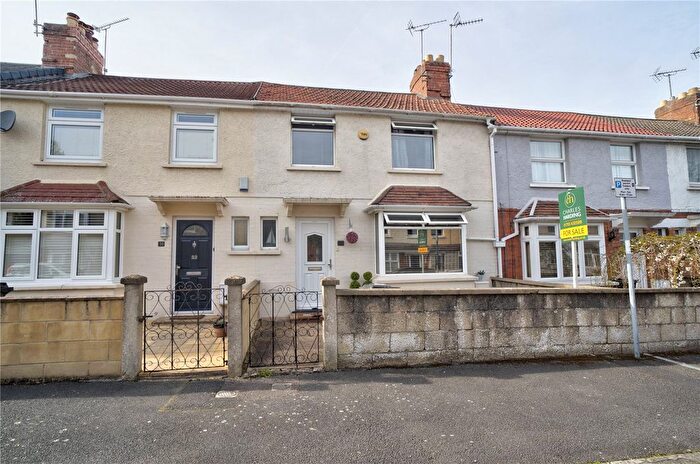
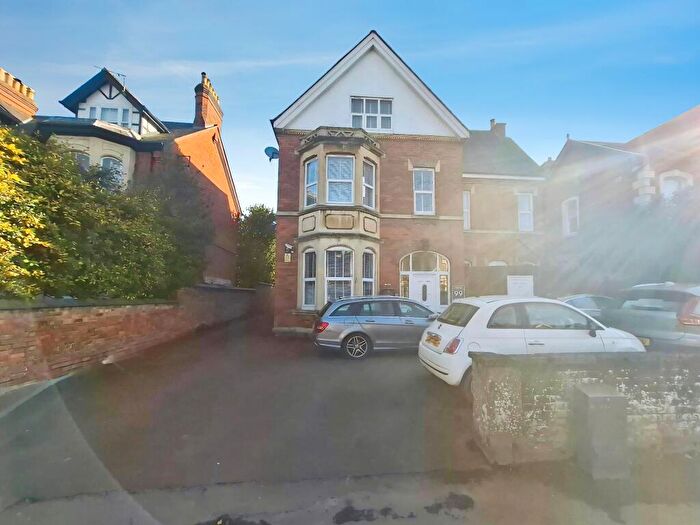
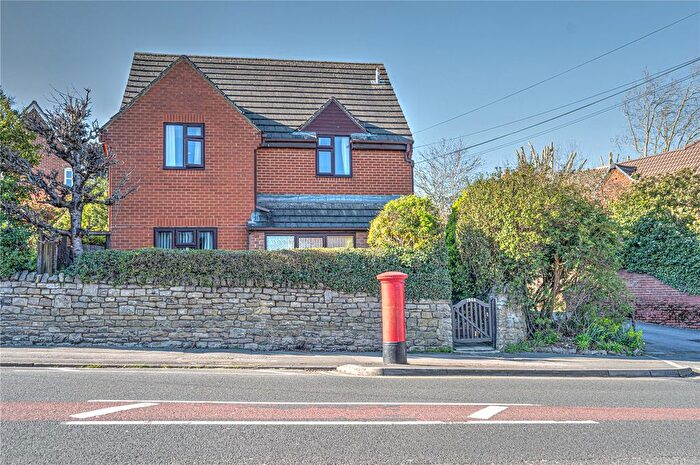
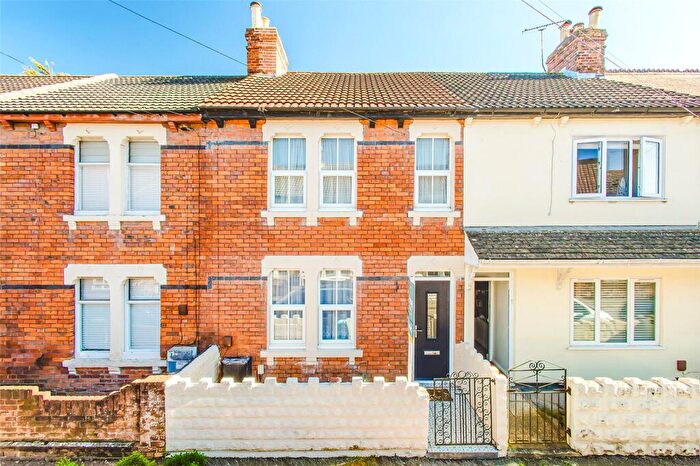
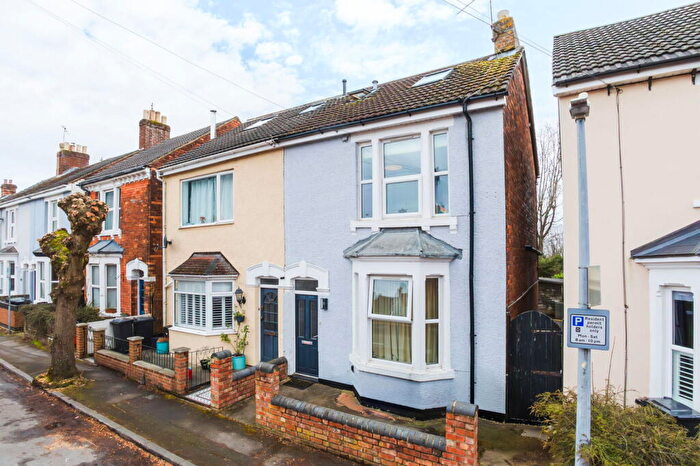
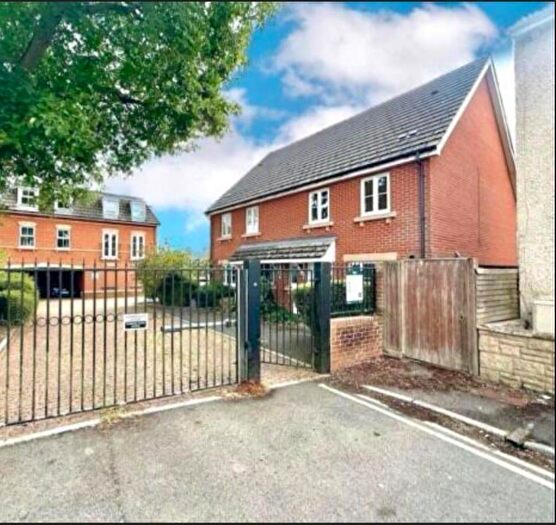
Properties for sale in Eastcott
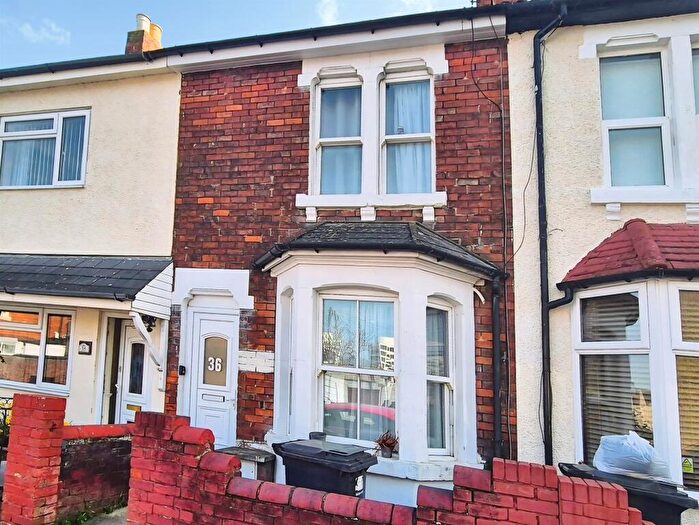
![]()
If you are looking to sell your house, let it out, or receive a property valuation, an expert can help you.
Click the button below to get started.

Roads and Postcodes in Eastcott
Navigate through our locations to find the location of your next house in Eastcott, Swindon for sale or to rent.
Transport near Eastcott

- FAQ
- Price Paid By Year
- Property Type Price
Frequently asked questions about Eastcott
What is the average price for a property for sale in Eastcott?
The average price for a property for sale in Eastcott is £224,335. This amount is 20% lower than the average price in Swindon. There are 2,706 property listings for sale in Eastcott.
What streets have the most expensive properties for sale in Eastcott?
The streets with the most expensive properties for sale in Eastcott are Wood Street at an average of £900,000, High Street at an average of £555,000 and Bowood Road at an average of £342,923.
What streets have the most affordable properties for sale in Eastcott?
The streets with the most affordable properties for sale in Eastcott are The Heights at an average of £90,800, Erin Court at an average of £95,000 and Redcross Place at an average of £96,250.
Which train stations are available in or near Eastcott?
Some of the train stations available in or near Eastcott are Swindon, Kemble and Bedwyn.
Property Price Paid in Eastcott by Year
The average sold property price by year was:
| Year | Average Sold Price | Price Change |
Sold Properties
|
|---|---|---|---|
| 2026 | £139,000 | -61% |
2 Properties |
| 2025 | £224,271 | -0,4% |
201 Properties |
| 2024 | £225,195 | 0,4% |
210 Properties |
| 2023 | £224,348 | 4% |
217 Properties |
| 2022 | £215,972 | 6% |
293 Properties |
| 2021 | £203,750 | 1% |
304 Properties |
| 2020 | £201,642 | 5% |
183 Properties |
| 2019 | £192,037 | -4% |
223 Properties |
| 2018 | £199,968 | 6% |
256 Properties |
| 2017 | £188,211 | 6% |
273 Properties |
| 2016 | £177,542 | 8% |
304 Properties |
| 2015 | £163,226 | 6% |
319 Properties |
| 2014 | £153,234 | 7% |
271 Properties |
| 2013 | £141,783 | 2% |
199 Properties |
| 2012 | £139,446 | 5% |
170 Properties |
| 2011 | £131,816 | -6% |
178 Properties |
| 2010 | £140,371 | 2% |
146 Properties |
| 2009 | £137,701 | -11% |
153 Properties |
| 2008 | £152,285 | -3% |
208 Properties |
| 2007 | £157,545 | 5% |
571 Properties |
| 2006 | £149,421 | 6% |
436 Properties |
| 2005 | £140,291 | 2% |
384 Properties |
| 2004 | £137,714 | 10% |
411 Properties |
| 2003 | £123,520 | 4% |
414 Properties |
| 2002 | £119,137 | 17% |
391 Properties |
| 2001 | £99,479 | 10% |
385 Properties |
| 2000 | £89,482 | 20% |
378 Properties |
| 1999 | £71,149 | 14% |
428 Properties |
| 1998 | £60,963 | 7% |
331 Properties |
| 1997 | £56,463 | 15% |
387 Properties |
| 1996 | £48,262 | 0,2% |
308 Properties |
| 1995 | £48,147 | - |
304 Properties |
Property Price per Property Type in Eastcott
Here you can find historic sold price data in order to help with your property search.
The average Property Paid Price for specific property types in the last three years are:
| Property Type | Average Sold Price | Sold Properties |
|---|---|---|
| Flat | £129,940.00 | 114 Flats |
| Semi Detached House | £276,964.00 | 66 Semi Detached Houses |
| Detached House | £354,722.00 | 18 Detached Houses |
| Terraced House | £235,771.00 | 432 Terraced Houses |