
Houses for sale in Swindon, Swindon
House Prices in Swindon
Properties in Swindon have an average house price of £281k and had 9,754 Property Transactions within the last 3 years.¹
Swindon is an area in Swindon with 95,748 households², where the most expensive property was sold for £1.9M.
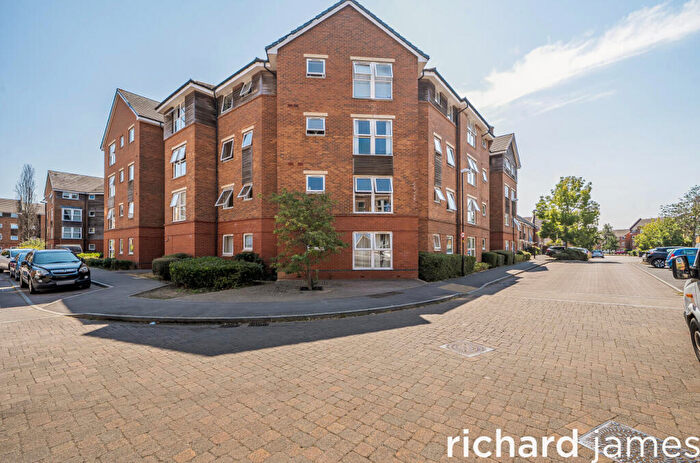
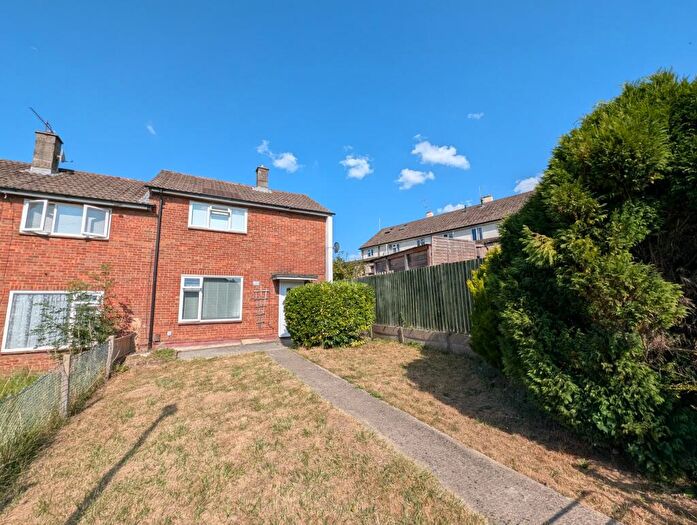
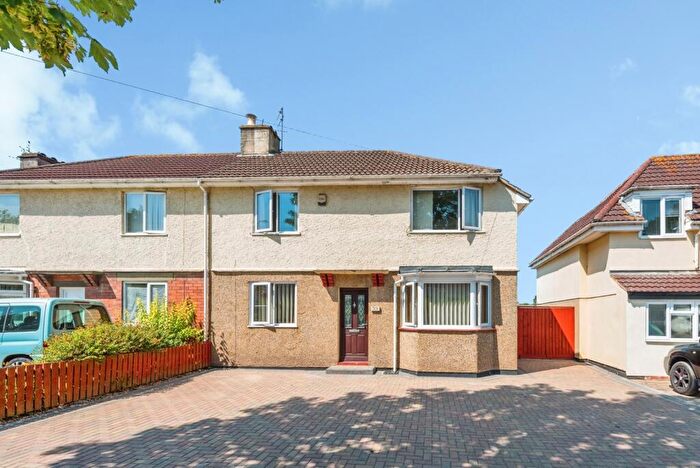
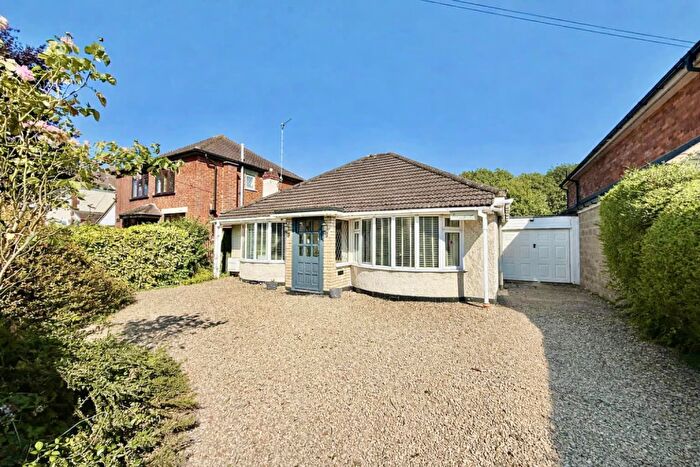
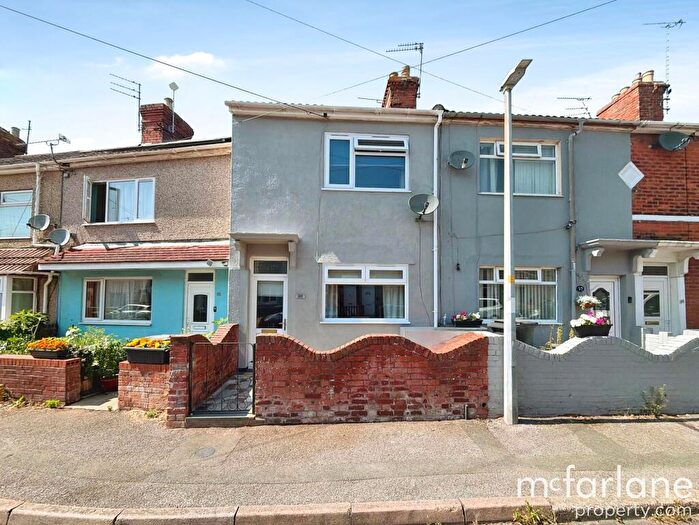
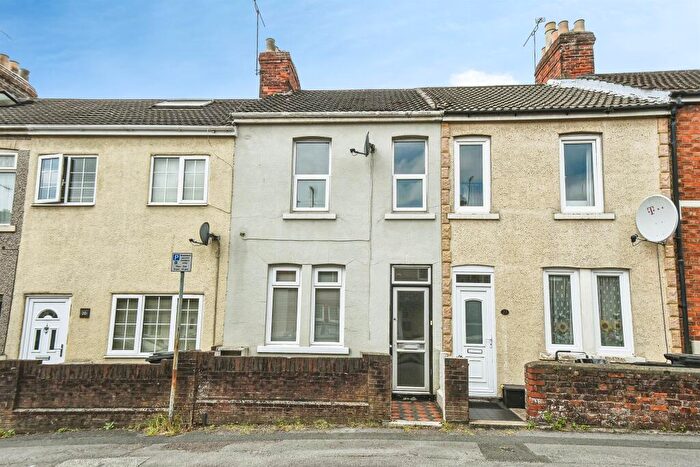
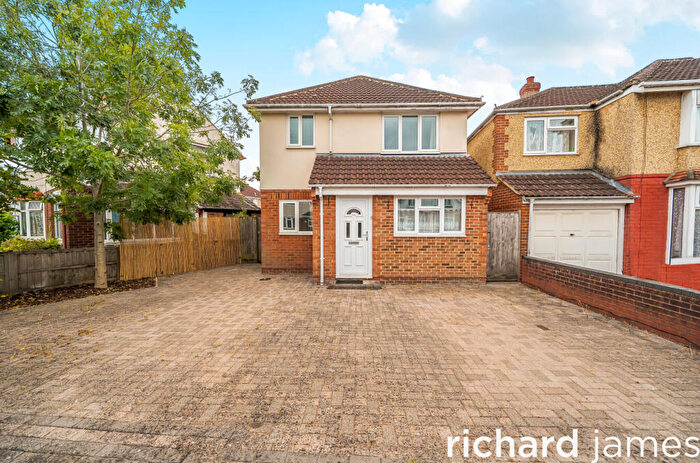
Properties for sale in Swindon
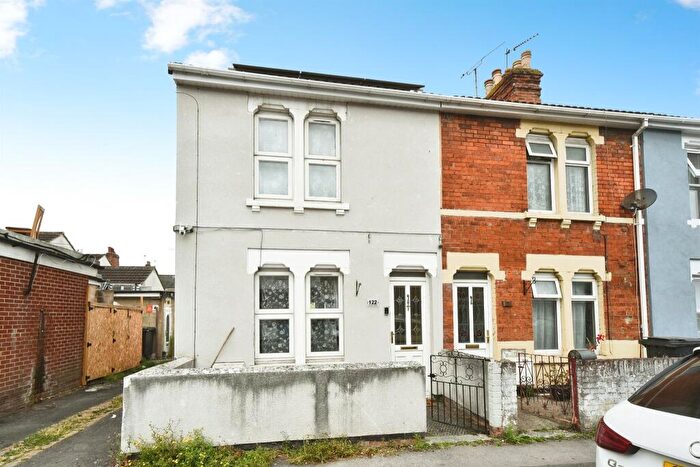


![]()
If you are looking to sell your house, let it out, or receive a property valuation, an expert can help you.
Click the button below to get started.

Neighbourhoods in Swindon
Navigate through our locations to find the location of your next house in Swindon, Swindon for sale or to rent.
- Shaw
- Blunsdon And Highworth
- Central
- Chiseldon And Lawn
- Covingham And Dorcan
- Eastcott
- Gorse Hill And Pinehurst
- Haydon Wick
- Liden, Eldene And Park South
- Lydiard And Freshbrook
- Mannington And Western
- Old Town
- Penhill And Upper Stratton
- Priory Vale
- Ridgeway
- Rodbourne Cheney
- St Andrews
- St Margaret And South Marston
- Walcot And Park North
- Wroughton And Wichelstowe
Property price trends in Swindon
According to the latest Land Registry data, the average home in Swindon sold for £290,757 in 2026. That figure comes from a substantial record of 135,518 sales logged over the past 31 years.
Prices have moved up over the last three years. Compared with 2023, when the typical sale came in around £276,753, that's a rise of roughly 5.1%.
Looking back five years, average prices are up about 12.9% since 2021, a gain of around £33,281 in cash terms.
Zoom out to the past decade for the fuller picture. Back in 2016, homes here averaged £215,435, so the typical sold price has climbed about 35% since then, roughly 3% a year. Stretch the view to fifteen years and that annual pace edges up closer to 3.8%.
Frequently asked questions about Swindon
What is the average price for a property for sale in Swindon?
The average price for a property for sale in Swindon is £281,280. This amount is 0.07% lower than the average price in Swindon. There are more than 10,000 property listings for sale in Swindon.
What locations have the most expensive properties for sale in Swindon?
The locations with the most expensive properties for sale in Swindon are Ridgeway at an average of £545,419, Chiseldon And Lawn at an average of £393,318 and Blunsdon And Highworth at an average of £346,857.
What locations have the most affordable properties for sale in Swindon?
The locations with the most affordable properties for sale in Swindon are Mannington And Western at an average of £209,603, Central at an average of £210,340 and Eastcott at an average of £223,787.
Which train stations are available in or near Swindon?
Some of the train stations available in or near Swindon are Swindon, Kemble and Bedwyn.
Property Price Paid in Swindon by Year
The average sold property price by year was:
| Year | Average Sold Price | Price Change |
Sold Properties
|
|---|---|---|---|
| 2026 | £290,757 | 1% |
214 Properties |
| 2025 | £288,351 | 4% |
3,138 Properties |
| 2024 | £278,224 | 1% |
3,241 Properties |
| 2023 | £276,753 | 1% |
3,161 Properties |
| 2022 | £275,292 | 6% |
3,865 Properties |
| 2021 | £257,476 | 5% |
4,760 Properties |
| 2020 | £244,051 | -0,2% |
3,185 Properties |
| 2019 | £244,531 | 1% |
4,156 Properties |
| 2018 | £242,753 | 3% |
4,594 Properties |
| 2017 | £235,566 | 9% |
4,819 Properties |
Property Price per Property Type in Swindon
Here you can find historic sold price data in order to help with your property search.
The average Property Paid Price for specific property types in the last three years are:
| Property Type | Average Sold Price | Sold Properties |
|---|---|---|
| Semi Detached House | £295,104.00 | 2,672 Semi Detached Houses |
| Terraced House | £242,897.00 | 3,758 Terraced Houses |
| Detached House | £439,205.00 | 1,886 Detached Houses |
| Flat | £148,775.00 | 1,438 Flats |
Transport in Swindon
Please see below transportation links in this area:
