
Houses for sale & to rent in SN5 6EP, Thurney Drive, Lydiard And Freshbrook, Swindon
House Prices in SN5 6EP, Thurney Drive, Lydiard And Freshbrook
Properties in SN5 6EP have an average house price of £475,000.00 and had 1 Property Transaction within the last 3 years.¹ SN5 6EP is a postcode in Thurney Drive located in Lydiard And Freshbrook, an area in Swindon, Swindon, with 10 households², where the most expensive property was sold for £475,000.00.
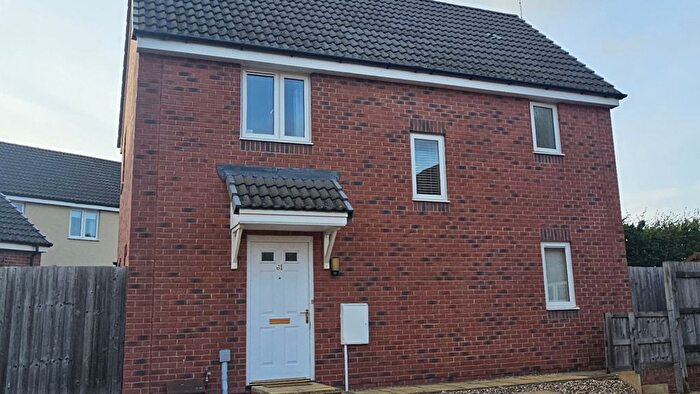
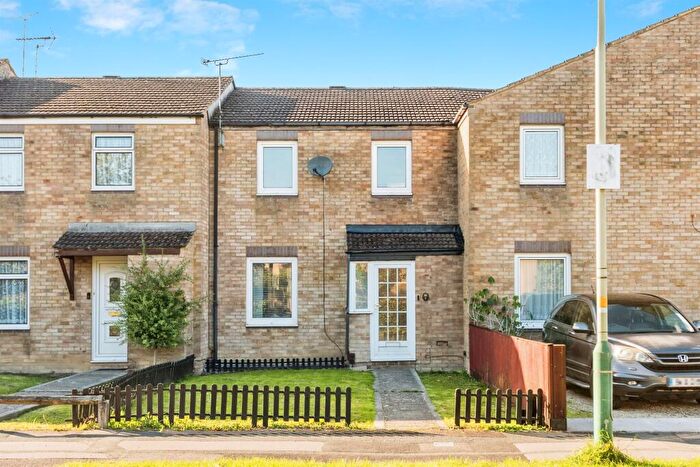
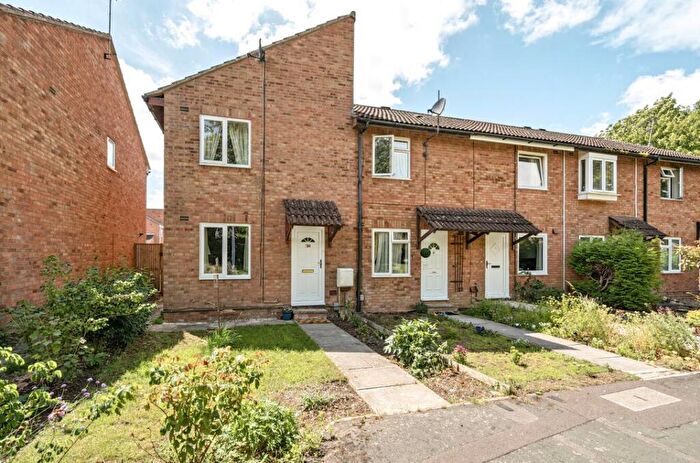
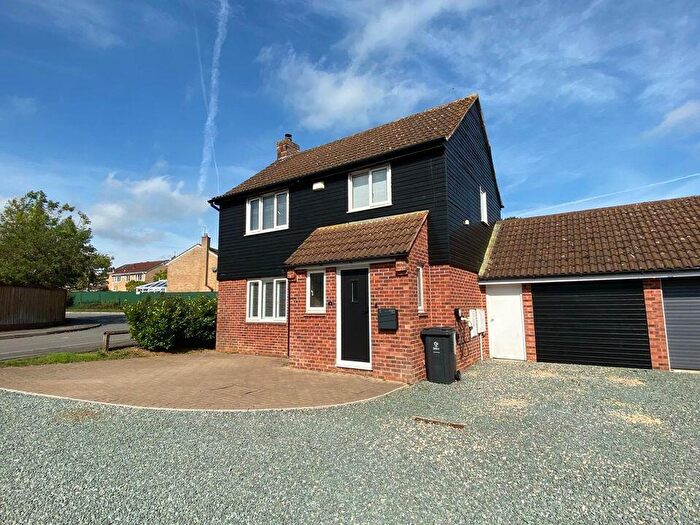
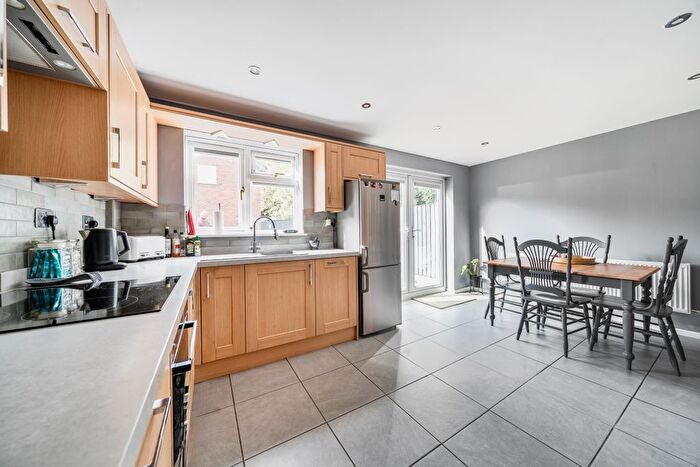
Properties for sale near SN5 6EP, Thurney Drive


![]()
If you are looking to sell your house, let it out, or receive a property valuation, an expert can help you.
Click the button below to get started.


Price Paid in Thurney Drive, SN5 6EP, Lydiard And Freshbrook
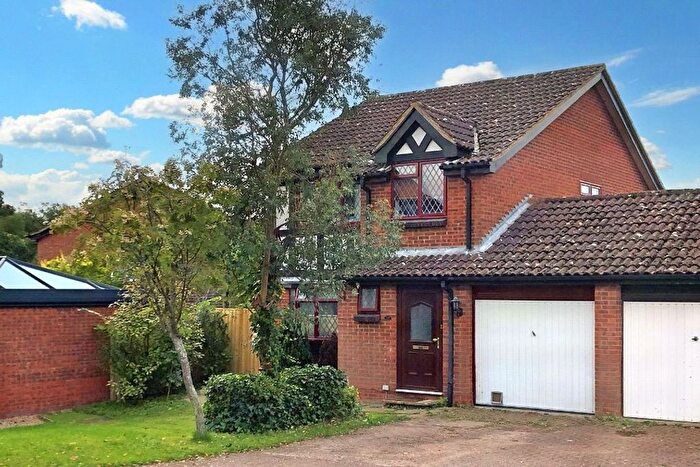
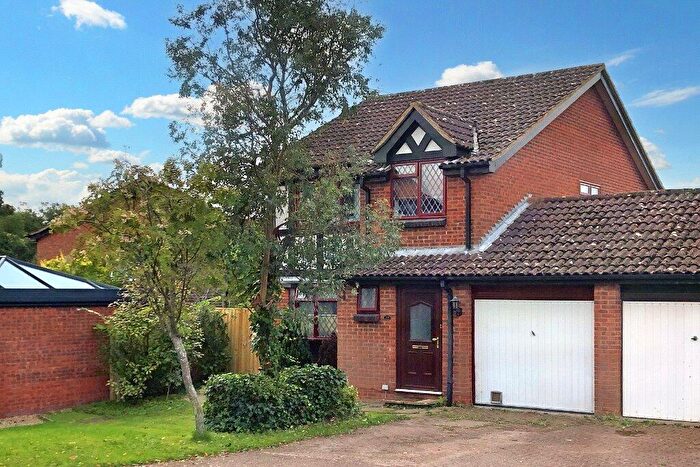
6 Thurney Drive, SN5 6EP, Lydiard And Freshbrook Swindon
Property 6 has been sold 3 times. The last time it was sold was in 07/07/2025 and the sold price was £475,000.00.
This detached house, sold as a freehold on 07/07/2025, is a 101 sqm detached house with an EPC rating of D.
| Date | Price | Property Type | Tenure | Classification |
|---|---|---|---|---|
| 07/07/2025 | £475,000.00 | Detached House | freehold | Established Building |
| 16/03/2012 | £195,000.00 | Detached House | freehold | Established Building |
| 07/10/1999 | £134,000.00 | Detached House | freehold | Established Building |
20 Thurney Drive, SN5 6EP, Lydiard And Freshbrook Swindon
Property 20 has been sold 4 times. The last time it was sold was in 13/06/2018 and the sold price was £315,000.00.
This is a Detached House which was sold as a freehold in 13/06/2018
| Date | Price | Property Type | Tenure | Classification |
|---|---|---|---|---|
| 13/06/2018 | £315,000.00 | Detached House | freehold | Established Building |
| 08/08/2008 | £240,000.00 | Detached House | freehold | Established Building |
| 28/09/1999 | £122,500.00 | Detached House | freehold | Established Building |
| 26/02/1998 | £102,000.00 | Detached House | freehold | Established Building |
8 Thurney Drive, SN5 6EP, Lydiard And Freshbrook Swindon
Property 8 has been sold 2 times. The last time it was sold was in 28/02/2017 and the sold price was £220,000.00.
This semi detached house, sold as a freehold on 28/02/2017, is a 78 sqm semi-detached house with an EPC rating of D.
| Date | Price | Property Type | Tenure | Classification |
|---|---|---|---|---|
| 28/02/2017 | £220,000.00 | Semi Detached House | freehold | Established Building |
| 16/10/1998 | £80,500.00 | Semi Detached House | freehold | Established Building |
14 Thurney Drive, SN5 6EP, Lydiard And Freshbrook Swindon
Property 14 has been sold 1 time. The last time it was sold was in 09/12/2005 and the sold price was £152,500.00.
This is a Semi Detached House which was sold as a freehold in 09/12/2005
| Date | Price | Property Type | Tenure | Classification |
|---|---|---|---|---|
| 09/12/2005 | £152,500.00 | Semi Detached House | freehold | Established Building |
2 Thurney Drive, SN5 6EP, Lydiard And Freshbrook Swindon
Property 2 has been sold 1 time. The last time it was sold was in 13/09/2002 and the sold price was £263,000.00.
This is a Detached House which was sold as a freehold in 13/09/2002
| Date | Price | Property Type | Tenure | Classification |
|---|---|---|---|---|
| 13/09/2002 | £263,000.00 | Detached House | freehold | Established Building |
18 Thurney Drive, SN5 6EP, Lydiard And Freshbrook Swindon
Property 18 has been sold 1 time. The last time it was sold was in 02/02/2001 and the sold price was £135,000.00.
This is a Terraced House which was sold as a freehold in 02/02/2001
| Date | Price | Property Type | Tenure | Classification |
|---|---|---|---|---|
| 02/02/2001 | £135,000.00 | Terraced House | freehold | Established Building |
16 Thurney Drive, SN5 6EP, Lydiard And Freshbrook Swindon
Property 16 has been sold 1 time. The last time it was sold was in 29/11/1996 and the sold price was £62,000.00.
This semi detached house, sold as a freehold on 29/11/1996, is a 105 sqm semi-detached house with an EPC rating of C.
| Date | Price | Property Type | Tenure | Classification |
|---|---|---|---|---|
| 29/11/1996 | £62,000.00 | Semi Detached House | freehold | Established Building |
Postcodes in Thurney Drive, Lydiard And Freshbrook
Navigate through other locations in Thurney Drive, Lydiard And Freshbrook, Swindon to see more property listings for sale or to rent.
Transport near SN5 6EP, Thurney Drive

House price paid reports for SN5 6EP, Thurney Drive
Click on the buttons below to see price paid reports by year or property price:
- Price Paid By Year
- Property Type Price
Property Price Paid in SN5 6EP, Thurney Drive by Year
The average sold property price by year was:
| Year | Average Sold Price | Price Change |
Sold Properties
|
|---|---|---|---|
| 2025 | £475,000 | 34% |
1 Property |
| 2018 | £315,000 | 30% |
1 Property |
| 2017 | £220,000 | 11% |
1 Property |
| 2012 | £195,000 | -23% |
1 Property |
| 2008 | £240,000 | 36% |
1 Property |
| 2005 | £152,500 | -72% |
1 Property |
| 2002 | £263,000 | 49% |
1 Property |
| 2001 | £135,000 | 5% |
1 Property |
| 1999 | £128,250 | 29% |
2 Properties |
| 1998 | £91,250 | 32% |
2 Properties |
| 1996 | £62,000 | - |
1 Property |
Property Price per Property Type in SN5 6EP, Thurney Drive
Here you can find historic sold price data in order to help with your property search.
The average Property Paid Price for specific property types in the last three years are:
| Property Type | Average Sold Price | Sold Properties |
|---|---|---|
| Detached House | £475,000.00 | 1 Detached House |