
Houses for sale & to rent in Denton West, Stockport
House Prices in Denton West
Properties in Denton West have an average house price of £186k and had 15 Property Transactions within the last 3 years¹.
Denton West is an area in Stockport, Tameside with 152 households², where the most expensive property was sold for £278k.
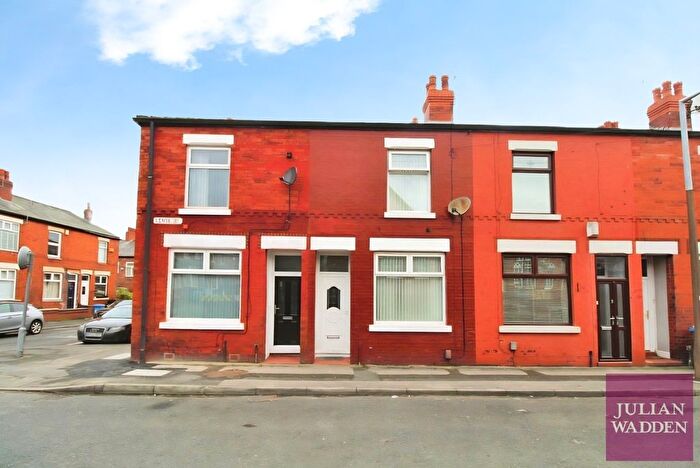
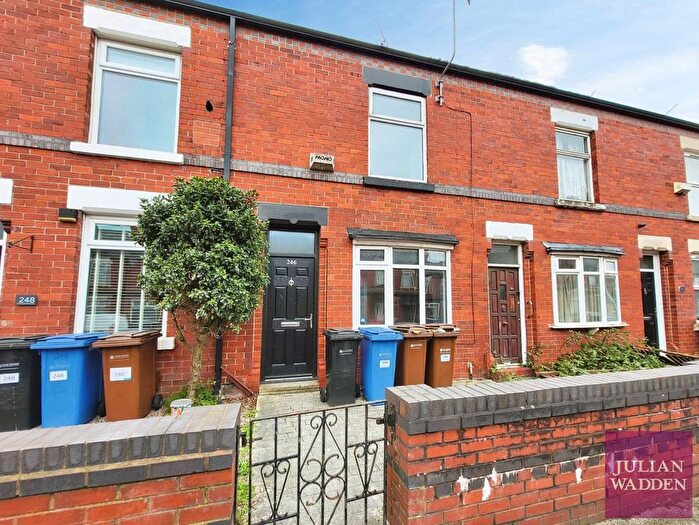
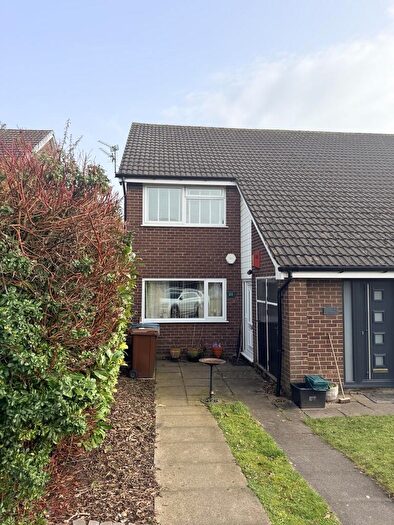
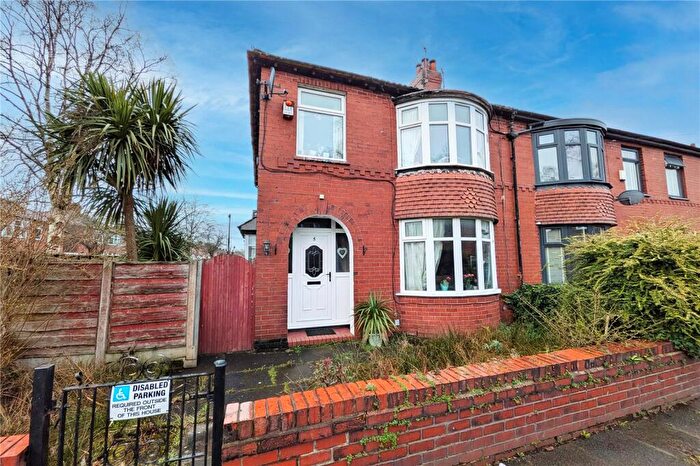
Properties for sale in Denton West
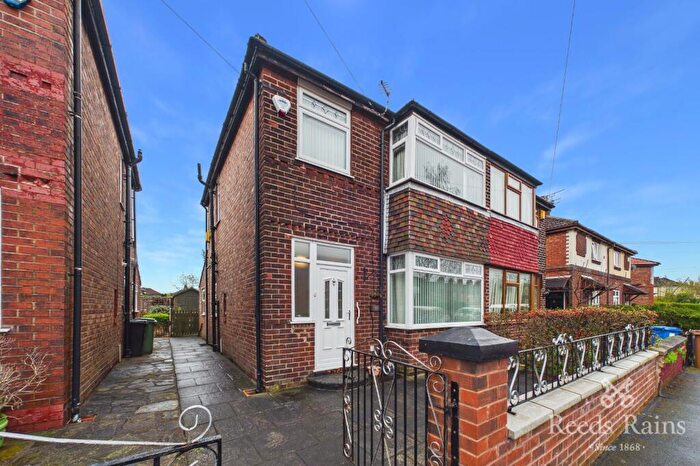
![]()
If you are looking to sell your house, let it out, or receive a property valuation, an expert can help you.
Click the button below to get started.
Roads and Postcodes in Denton West
Navigate through our locations to find the location of your next house in Denton West, Stockport for sale or to rent.
| Streets | Postcodes |
|---|---|
| Cromwell Avenue | SK5 6GB |
| Thornley Lane North | SK5 6QR SK5 6RB |
| Thornley Lane South | SK5 6QG SK5 6TA |
Transport near Denton West
-
 Reddish North Station
 -
Denton Station
-
Ryder Brow Station
-
Reddish South Station
-
Gorton Station
-
Belle Vue Station
-
Brinnington Station
-
Fairfield Station
-
Levenshulme Station
-
Heaton Chapel Station
- FAQ
- Price Paid By Year
- Property Type Price
Frequently asked questions about Denton West
What is the average price for a property for sale in Denton West?
The average price for a property for sale in Denton West is £185,903. There are 747 property listings for sale in Denton West.
What streets have the most expensive properties for sale in Denton West?
The streets with the most expensive properties for sale in Denton West are Thornley Lane South at an average of £205,750 and Thornley Lane North at an average of £198,812.
What streets have the most affordable properties for sale in Denton West?
The street with the most affordable properties for sale in Denton West is Cromwell Avenue at an average of £167,185.
Which train stations are available in or near Denton West?
Some of the train stations available in or near Denton West are Reddish North, Denton and Ryder Brow.
Property Price Paid in Denton West by Year
The average sold property price by year was:
| Year | Average Sold Price | Price Change |
Sold Properties
|
|---|---|---|---|
| 2025 | £170,000 | -13% |
5 Properties |
| 2024 | £192,562 | -1% |
4 Properties |
| 2023 | £194,716 | -12% |
6 Properties |
| 2022 | £217,416 | 6% |
12 Properties |
| 2021 | £203,908 | 30% |
8 Properties |
| 2020 | £142,500 | 7% |
4 Properties |
| 2019 | £132,987 | -8% |
8 Properties |
| 2018 | £144,250 | 5% |
8 Properties |
| 2017 | £136,372 | -8% |
11 Properties |
| 2016 | £147,211 | -1% |
9 Properties |
| 2015 | £148,300 | 22% |
5 Properties |
| 2014 | £115,285 | -7% |
7 Properties |
| 2013 | £122,937 | 10% |
8 Properties |
| 2012 | £110,950 | 2% |
6 Properties |
| 2011 | £108,800 | -6% |
6 Properties |
| 2010 | £115,500 | 23% |
4 Properties |
| 2009 | £89,000 | -30% |
2 Properties |
| 2008 | £115,750 | -17% |
2 Properties |
| 2007 | £135,860 | 9% |
15 Properties |
| 2006 | £122,992 | -1% |
13 Properties |
| 2005 | £123,905 | -6% |
14 Properties |
| 2004 | £131,182 | 32% |
45 Properties |
| 2003 | £88,661 | 17% |
9 Properties |
| 2002 | £73,368 | 31% |
8 Properties |
| 2001 | £50,525 | 19% |
6 Properties |
| 2000 | £40,700 | -18% |
5 Properties |
| 1999 | £48,192 | 46% |
7 Properties |
| 1998 | £26,000 | -44% |
2 Properties |
| 1997 | £37,325 | 6% |
6 Properties |
| 1996 | £34,966 | 17% |
3 Properties |
| 1995 | £29,000 | - |
2 Properties |
Property Price per Property Type in Denton West
Here you can find historic sold price data in order to help with your property search.
The average Property Paid Price for specific property types in the last three years are:
| Property Type | Average Sold Price | Sold Properties |
|---|---|---|
| Semi Detached House | £257,682.00 | 3 Semi Detached Houses |
| Terraced House | £187,208.00 | 6 Terraced Houses |
| Flat | £148,708.00 | 6 Flats |