
Houses for sale in Tameside, England
House Prices in Tameside
Properties in Tameside have
an average house price of
£212k
and had 9,509 Property Transactions
within the last 3 years.¹
Tameside is a location in
England with
99,686 households², where the most expensive property was sold for £1.14M.
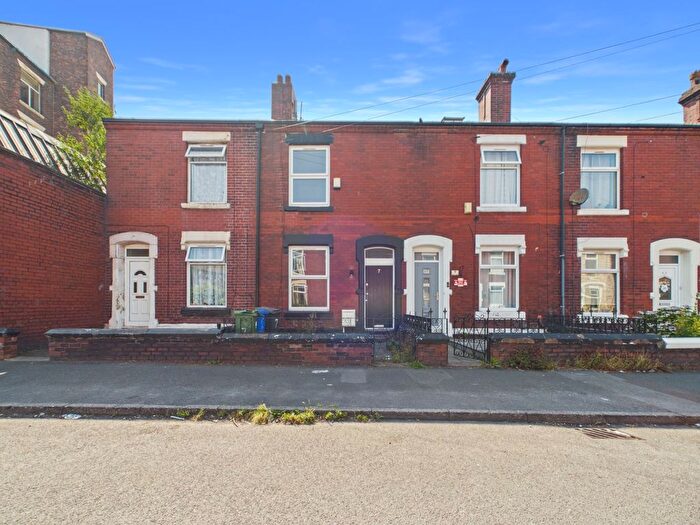
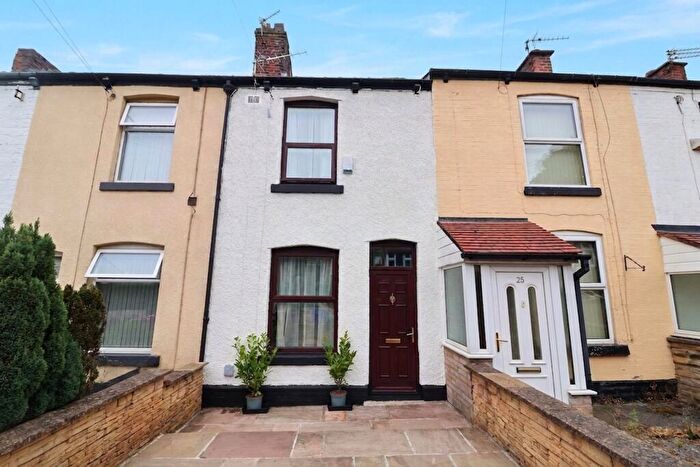
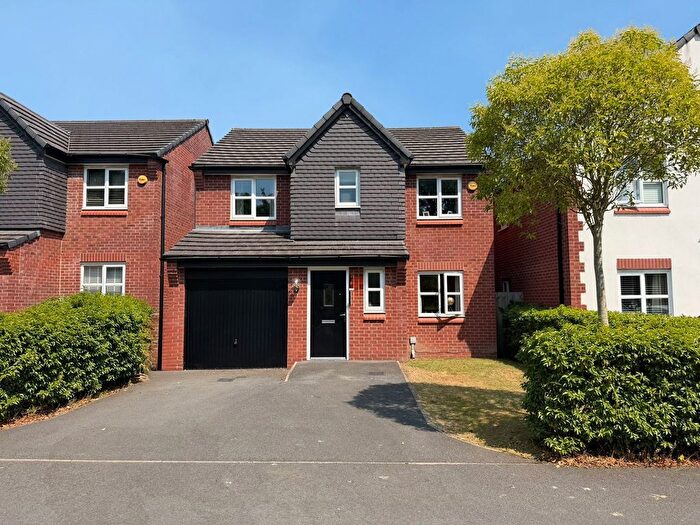
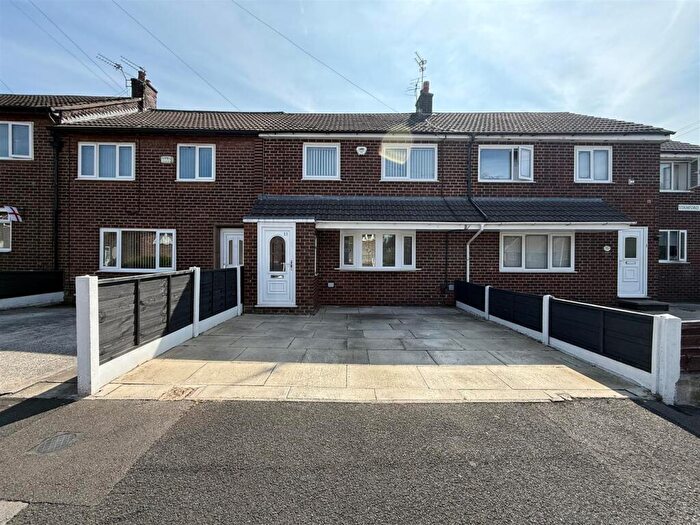
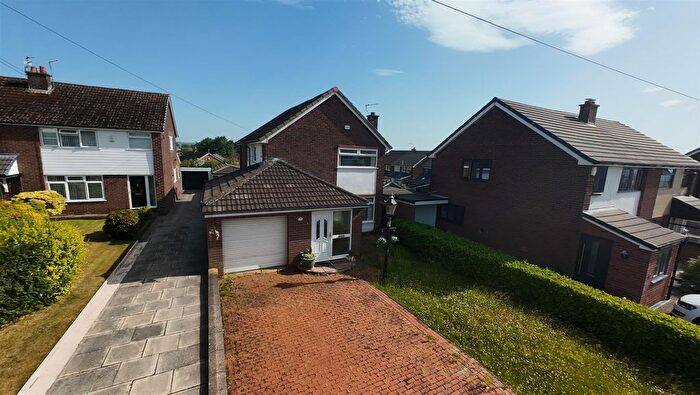
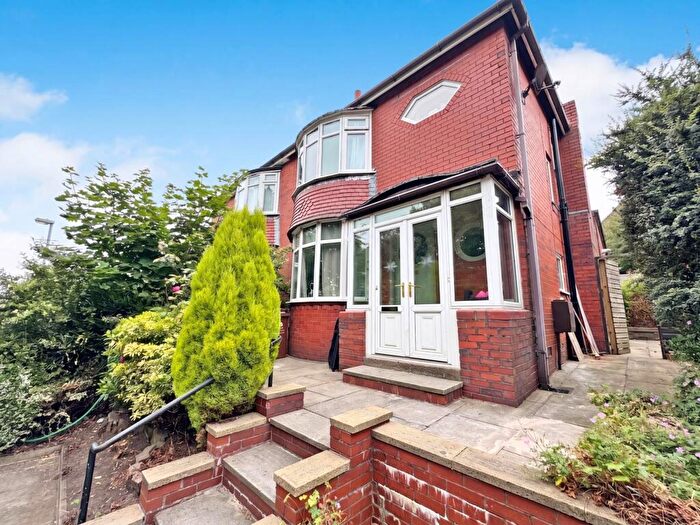
Properties for sale in Tameside
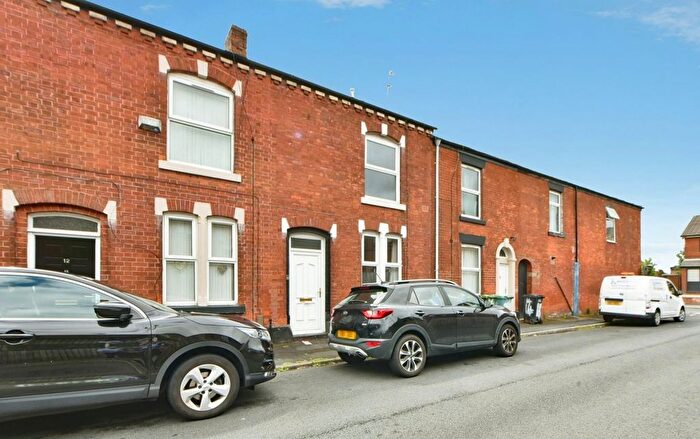

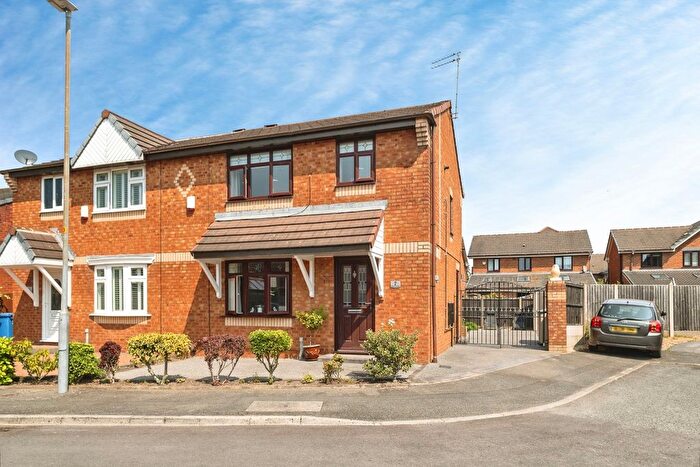
![]()
If you are looking to sell your house, let it out, or receive a property valuation, an expert can help you.
Click the button below to get started.


Towns in Tameside
Navigate through our locations to find the location of your next house in Tameside, England for sale or to rent.
Property price trends in Tameside
According to the latest Land Registry data, the average home in Tameside sold for £214,221 in 2026. That figure comes from a substantial record of 108,443 sales logged over the past 31 years.
Prices have moved up over the last three years. Compared with 2023, when the typical sale came in around £203,235, that's a rise of roughly 5.4%.
Looking back five years, average prices are up about 13.8% since 2021, a gain of around £26,015 in cash terms.
Zoom out to the past decade for the fuller picture. Back in 2016, homes here averaged £138,678, so the typical sold price has climbed about 54.5% since then, roughly 4.4% a year. Stretch the view to fifteen years and that annual pace eases back to about 3.9%.
Frequently asked questions about Tameside
What is the average price for a property for sale in Tameside?
The average price for a property for sale in Tameside is £212,357. This amount is 41% lower than the average price in England. There are more than 10,000 property listings for sale in Tameside.
What locations have the most expensive properties for sale in Tameside?
The locations with the most expensive properties for sale in Tameside are Stalybridge at an average of £223,277, Hyde at an average of £220,311 and Manchester at an average of £214,205.
What locations have the most affordable properties for sale in Tameside?
The locations with the most affordable properties for sale in Tameside are Oldham at an average of £100,000, Stockport at an average of £189,596 and Ashton-under-lyne at an average of £195,116.
Which train stations are available in or near Tameside?
Some of the train stations available in or near Tameside are Hyde North, Flowery Field and Guide Bridge.
Property Price Paid in Tameside by Year
The average sold property price by year was:
| Year | Average Sold Price | Price Change |
Sold Properties
|
|---|---|---|---|
| 2026 | £214,221 | -3% |
509 Properties |
| 2025 | £220,787 | 4% |
3,073 Properties |
| 2024 | £211,906 | 4% |
3,139 Properties |
| 2023 | £203,235 | -0,1% |
2,788 Properties |
| 2022 | £203,488 | 8% |
3,574 Properties |
| 2021 | £188,206 | 9% |
4,395 Properties |
| 2020 | £172,198 | 7% |
2,983 Properties |
| 2019 | £160,931 | 4% |
3,577 Properties |
| 2018 | £155,107 | 3% |
3,827 Properties |
| 2017 | £149,817 | 7% |
3,713 Properties |
Property Price per Property Type in Tameside
Here you can find historic sold price data in order to help with your property search.
The average Property Paid Price for specific property types in the last three years are:
| Property Type | Average Sold Price | Sold Properties |
|---|---|---|
| Semi Detached House | £235,136.00 | 3,311 Semi Detached Houses |
| Terraced House | £174,446.00 | 4,474 Terraced Houses |
| Detached House | £363,163.00 | 1,040 Detached Houses |
| Flat | £120,778.00 | 684 Flats |
Transport in Tameside
Please see below transportation links in this area:
