Houses for sale & to rent in Brookside, Telford
House Prices in Brookside
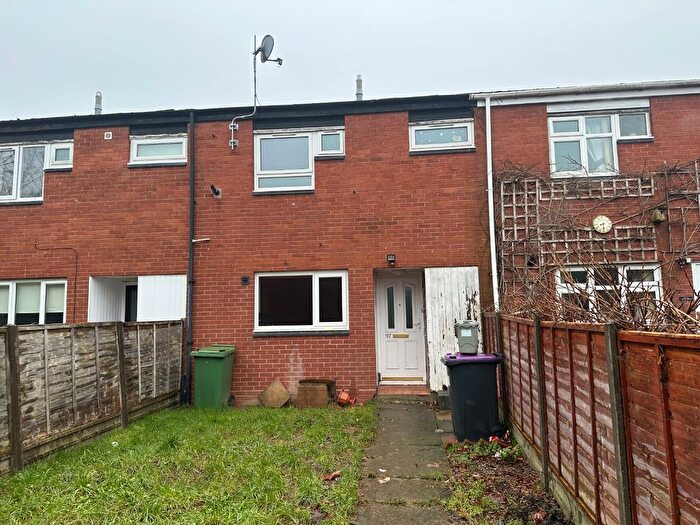
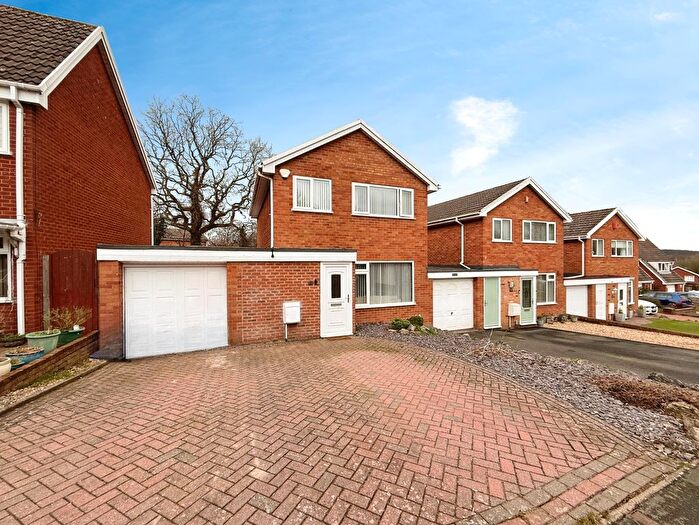
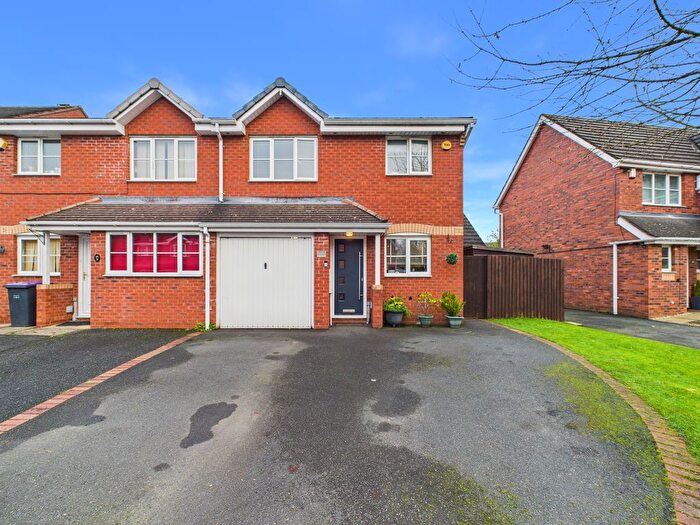
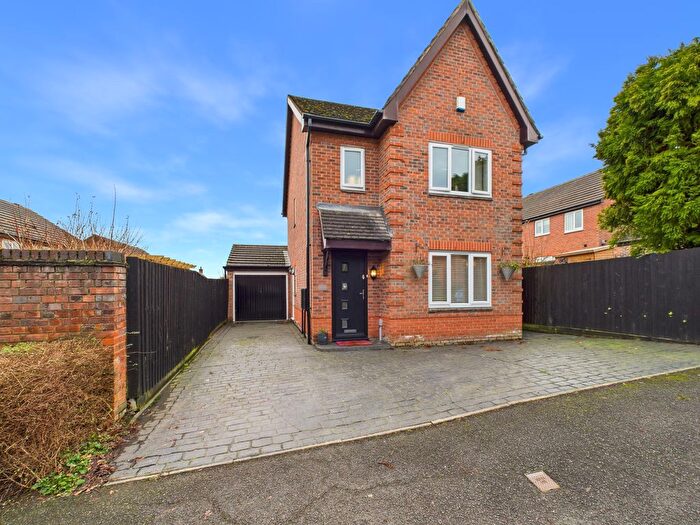
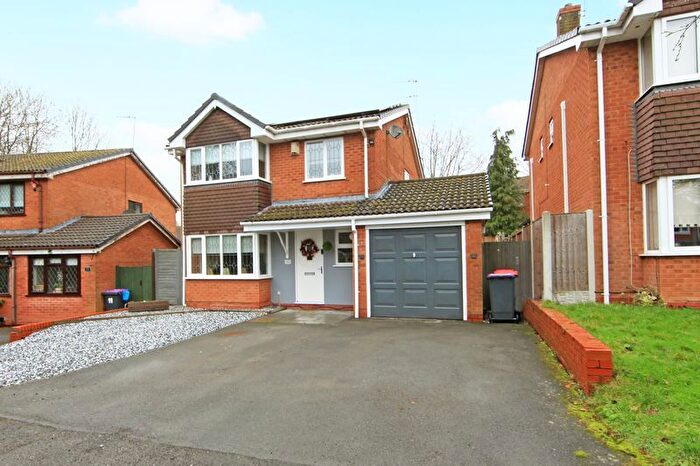
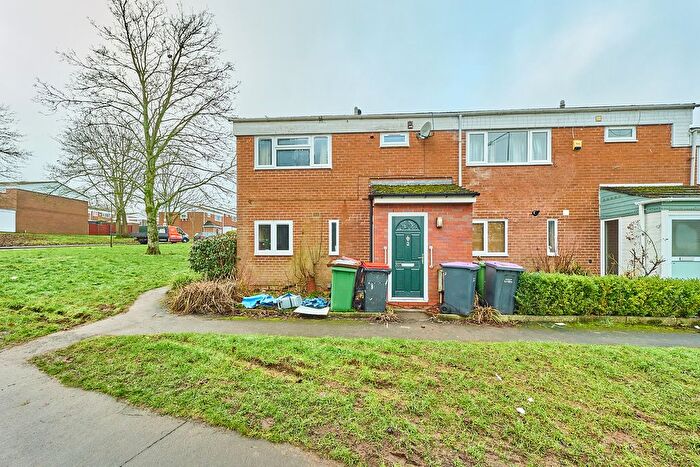
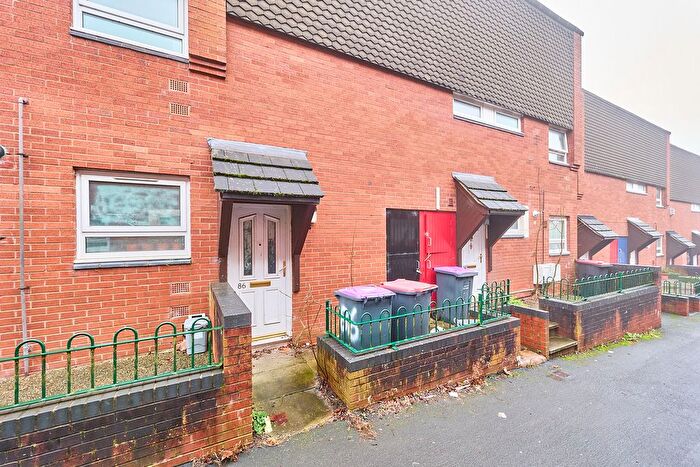
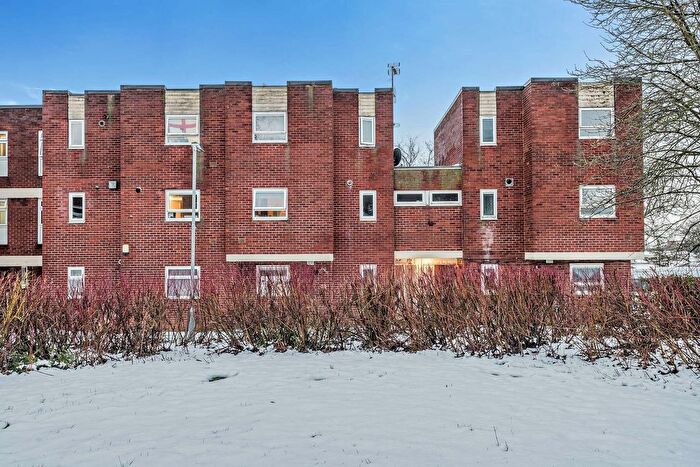
Properties in Brookside have an average house price of £152,216.00 and had 227 Property Transactions within the last 3 years¹.
Brookside is an area in Telford, Telford and Wrekin with 2,642 households², where the most expensive property was sold for £400,000.00.
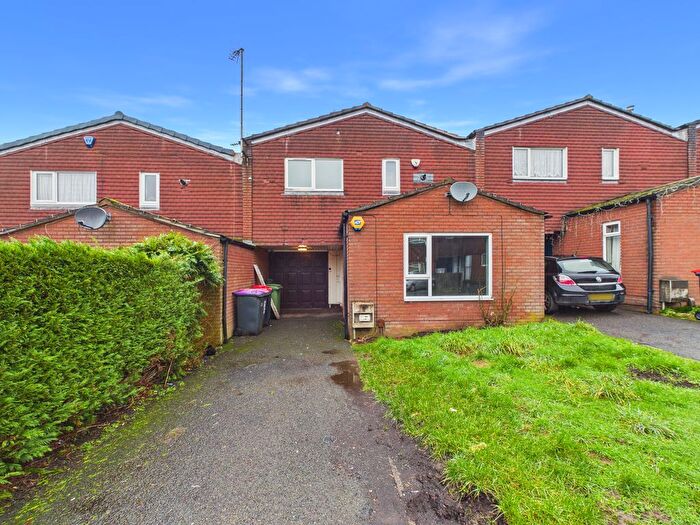
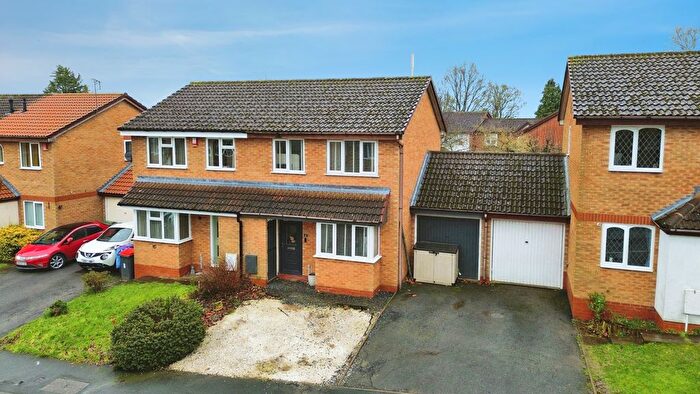
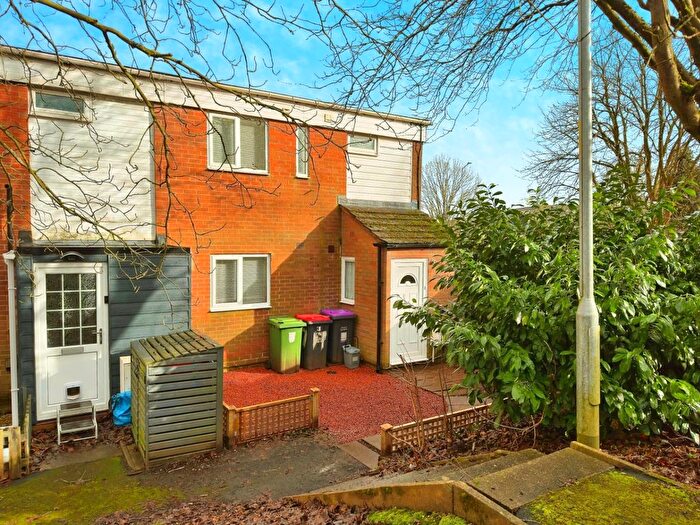
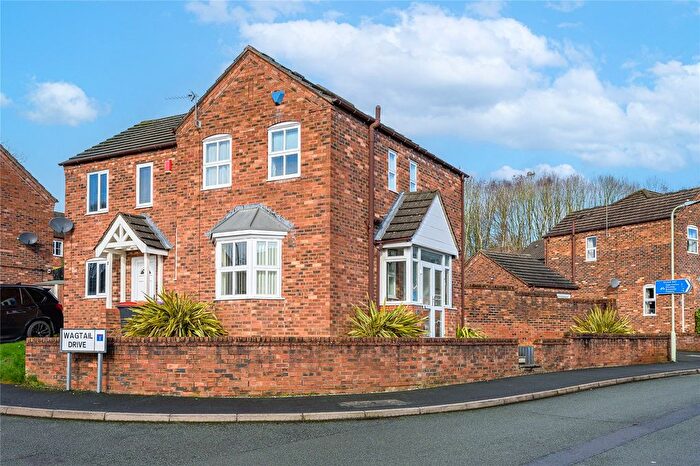
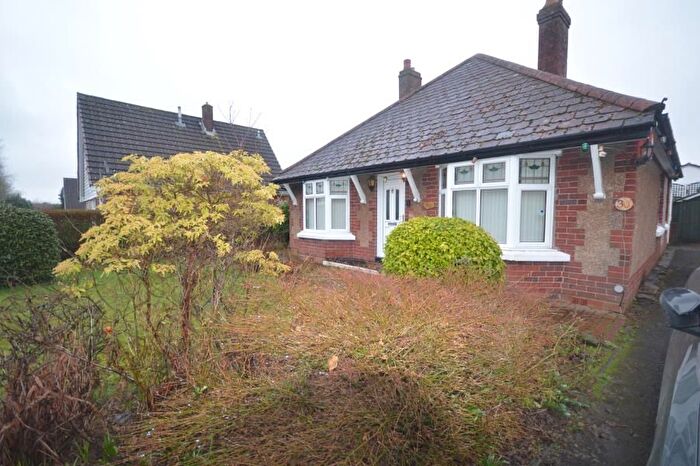
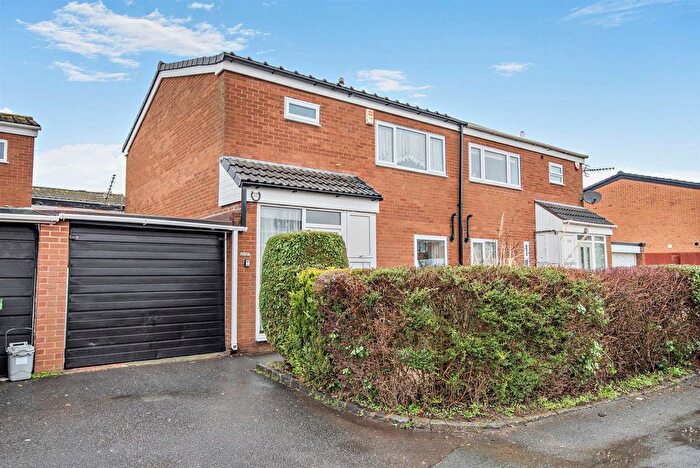
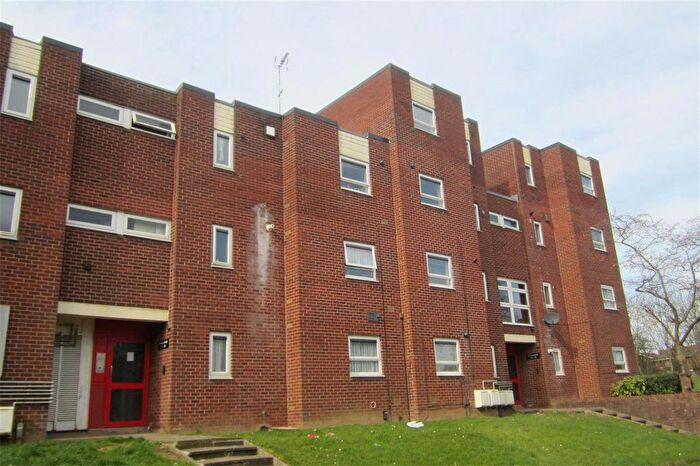
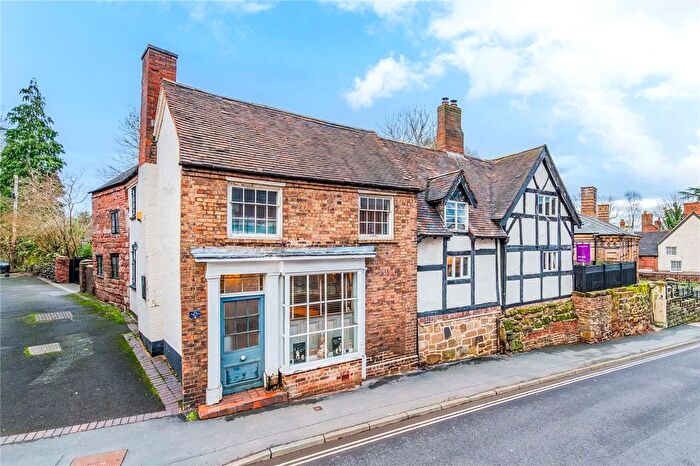
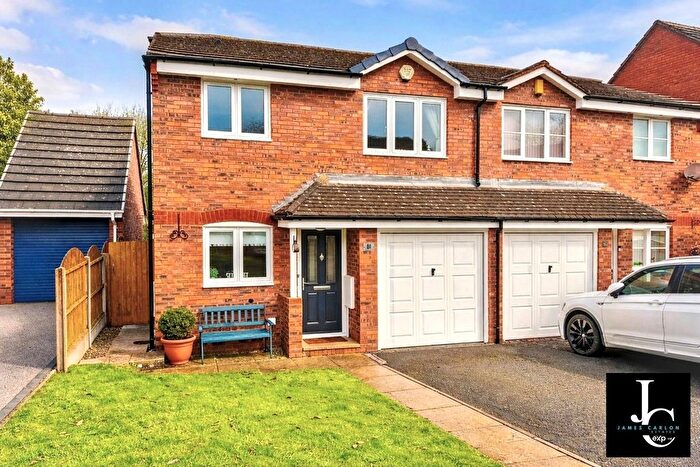
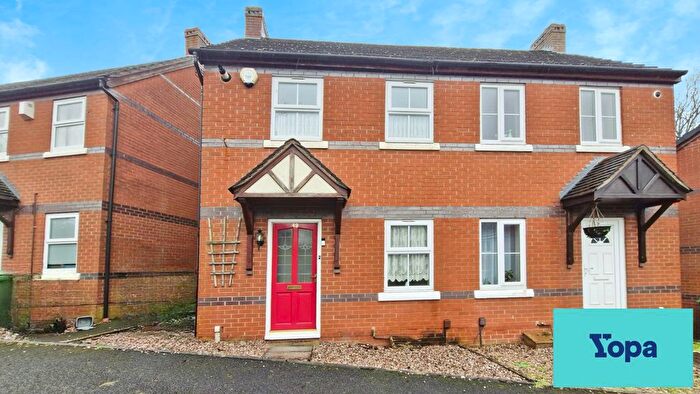
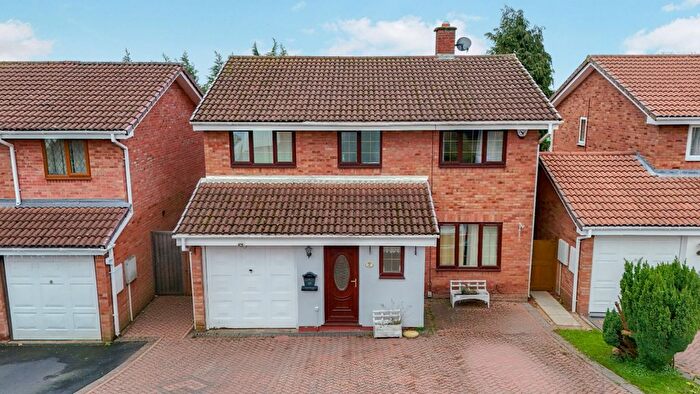
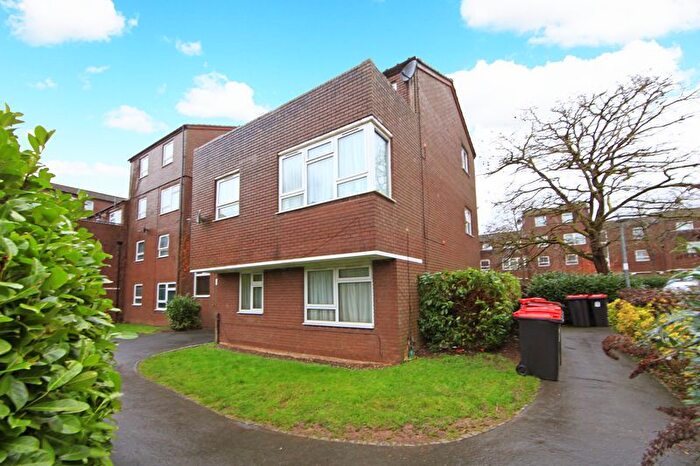
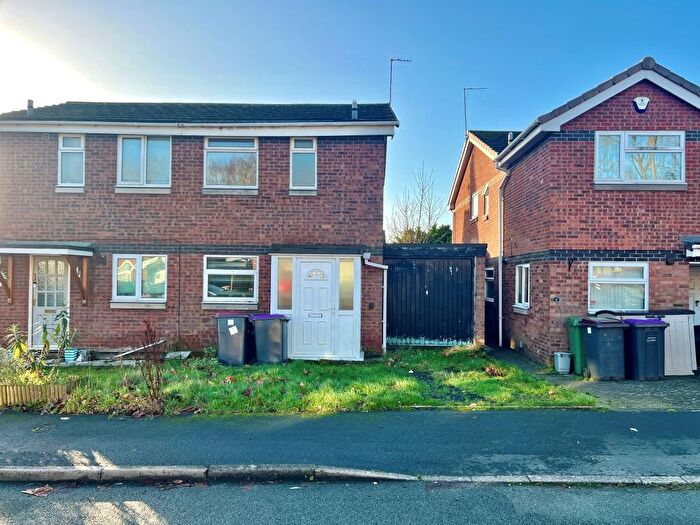
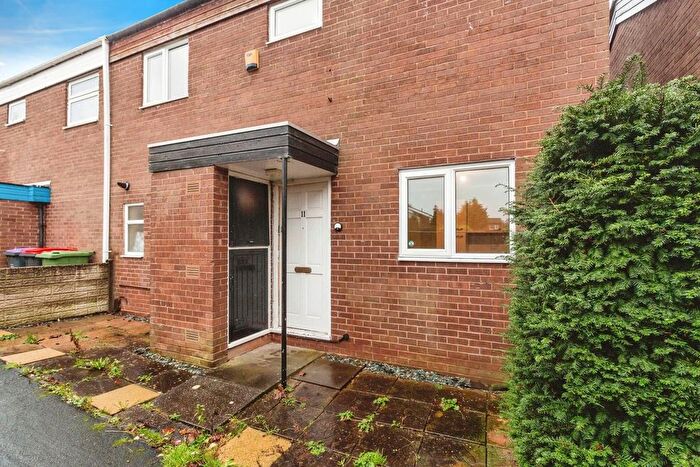
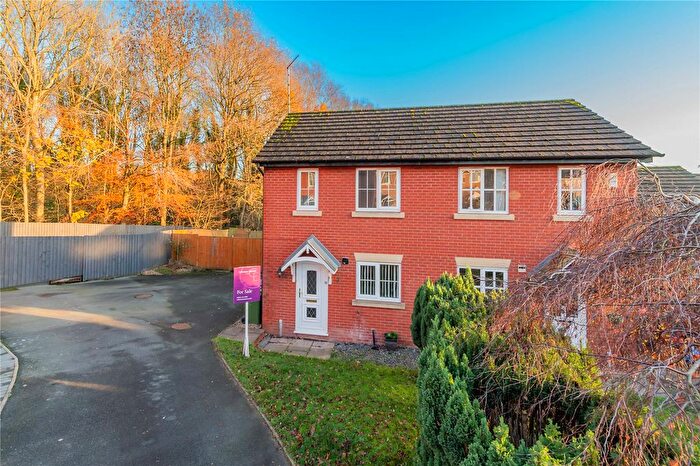
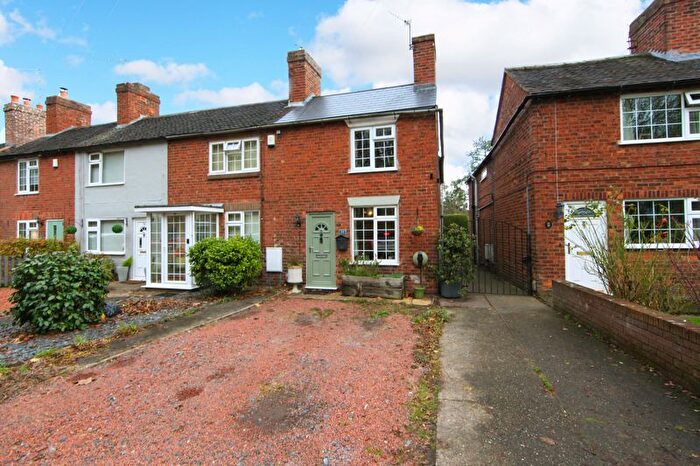
Properties for sale in Brookside
Previously listed properties in Brookside
Roads and Postcodes in Brookside
Navigate through our locations to find the location of your next house in Brookside, Telford for sale or to rent.
| Streets | Postcodes |
|---|---|
| Abraham Close | TF3 1DP |
| Aqueduct Lane | TF3 1BW |
| Attingham Close | TF3 1QE |
| Badger Close | TF3 1EL |
| Beaconsfield | TF3 1NF TF3 1NG TF3 1NH TF3 1NQ TF3 1LG |
| Beckbury Drive | TF3 1EE TF3 1EN |
| Bedstone Close | TF3 1RJ |
| Belgrave Crescent | TF3 1BJ |
| Bembridge | TF3 1LZ TF3 1NA TF3 1NB TF3 1ND TF3 1NE |
| Birchmore | TF3 1TF TF3 1TG TF3 1TH TF3 1TJ TF3 1TL TF3 1TQ |
| Bishopdale | TF3 1SA TF3 1SB TF3 1SD TF3 1SE TF3 1SF TF3 1SG TF3 1SH TF3 1SJ TF3 1SQ |
| Blakemore | TF3 1PR TF3 1PS TF3 1PT TF3 1PU TF3 1PX TF3 1PY TF3 1PZ TF3 1QA TF3 1QB |
| Boningale Close | TF3 1RA |
| Boscobel Close | TF3 1QH TF3 1QQ |
| Bournbrook Gardens | TF3 1DS |
| Bournside Drive | TF3 1DT |
| Bourton Close | TF3 1RF |
| Brackenfield | TF3 1SL TF3 1SN |
| Brereton | TF3 1PA TF3 1PB TF3 1PD TF3 1PE |
| Briarwood | TF3 1TN TF3 1TP TF3 1TR TF3 1TS TF3 1TT TF3 1TU TF3 1TW TF3 1TX TF3 1TY TF3 1TZ TF3 1UA TF3 1UB |
| Bridgwood | TF3 1LX TF3 1LY |
| Brindleyford | TF3 1SP TF3 1SW |
| Brookside Centre | TF3 1LP |
| Buckingham Crescent | TF3 1BP |
| Burford | TF3 1LH TF3 1LJ TF3 1LL TF3 1LN TF3 1LQ TF3 1LR TF3 1LS TF3 1LT TF3 1LU TF3 1LW |
| Burleigh Close | TF3 1RP |
| Burnside | TF3 1SR TF3 1SS TF3 1ST TF3 1SU TF3 1SX TF3 1SY TF3 1SZ TF3 1TA TF3 1TB TF3 1TD TF3 1TE |
| Burtondale | TF3 1PF TF3 1PG TF3 1PH TF3 1PJ TF3 1PN TF3 1PP TF3 1PQ TF3 1PW |
| Chapmans Close | TF3 1ED |
| Chetwynd Close | TF3 1RS |
| Claverley Drive | TF3 1EU |
| Cygnet Drive | TF3 1NP |
| Doddlecote Close | TF3 1RX |
| Dunmaster Way | TF3 1DR |
| Grebe Close | TF3 1NR |
| Heron Close | TF3 1NS |
| Hilton Close | TF3 1RG |
| Holmer Lane | TF3 1QJ |
| Hopeshay Close | TF3 1RE |
| Howle Close | TF3 1RY |
| Knightsbridge Crescent | TF3 1BN |
| Lake End Drive | TF3 1NT TF3 1NU |
| Lambeth Drive | TF3 1QW |
| Linley Drive | TF3 1RQ |
| Ludford Drive | TF3 1RD |
| Ludlow Drive | TF3 1EG |
| Lydbury Close | TF3 1RH |
| Mallard Close | TF3 1NX |
| Norton Drive | TF3 1EJ |
| Pickstock Close | TF3 1RU |
| Ryton Way | TF3 1EP TF3 1ER TF3 1EW |
| Sambrook Close | TF3 1RT |
| Shipton Close | TF3 1RN |
| Sidbury Close | TF3 1RL |
| Silkin View | TF3 1ES |
| Silvington Close | TF3 1RW |
| St James Crescent | TF3 1BL |
| Stirchley Road | TF3 1DU TF3 1EH |
| Stirchley Village | TF3 1DY |
| Stockton Close | TF3 1RR |
| Stowe Close | TF3 1RB |
| Tadorna Drive | TF3 1QP |
| Teal Close | TF3 1NY |
| Wroxeter Way | TF3 1QF TF3 1QG |
| TF3 1AD |
Transport near Brookside
- FAQ
- Price Paid By Year
- Property Type Price
Frequently asked questions about Brookside
What is the average price for a property for sale in Brookside?
The average price for a property for sale in Brookside is £152,216. This amount is 30% lower than the average price in Telford. There are 479 property listings for sale in Brookside.
What streets have the most expensive properties for sale in Brookside?
The streets with the most expensive properties for sale in Brookside are Tadorna Drive at an average of £334,500, Lydbury Close at an average of £315,000 and Lake End Drive at an average of £313,500.
What streets have the most affordable properties for sale in Brookside?
The streets with the most affordable properties for sale in Brookside are Beaconsfield at an average of £57,207, Burford at an average of £98,437 and Blakemore at an average of £105,661.
Which train stations are available in or near Brookside?
Some of the train stations available in or near Brookside are Telford Central, Oakengates and Shifnal.
Property Price Paid in Brookside by Year
The average sold property price by year was:
| Year | Average Sold Price | Price Change |
Sold Properties
|
|---|---|---|---|
| 2025 | £166,928 | 8% |
56 Properties |
| 2024 | £152,767 | 7% |
79 Properties |
| 2023 | £142,787 | -7% |
92 Properties |
| 2022 | £152,129 | 7% |
101 Properties |
| 2021 | £141,768 | 6% |
101 Properties |
| 2020 | £133,620 | 13% |
76 Properties |
| 2019 | £116,393 | -1% |
87 Properties |
| 2018 | £117,150 | 6% |
87 Properties |
| 2017 | £109,728 | -4% |
87 Properties |
| 2016 | £114,156 | 13% |
98 Properties |
| 2015 | £99,874 | -5% |
105 Properties |
| 2014 | £104,850 | 4% |
95 Properties |
| 2013 | £101,159 | 4% |
65 Properties |
| 2012 | £96,874 | -6% |
50 Properties |
| 2011 | £102,404 | -5% |
41 Properties |
| 2010 | £107,851 | -9% |
56 Properties |
| 2009 | £117,055 | 11% |
43 Properties |
| 2008 | £104,268 | -10% |
72 Properties |
| 2007 | £114,179 | 8% |
169 Properties |
| 2006 | £104,506 | 7% |
141 Properties |
| 2005 | £97,638 | 7% |
142 Properties |
| 2004 | £91,254 | 19% |
147 Properties |
| 2003 | £73,895 | 18% |
173 Properties |
| 2002 | £60,320 | 18% |
183 Properties |
| 2001 | £49,546 | 17% |
167 Properties |
| 2000 | £41,257 | 1% |
126 Properties |
| 1999 | £40,699 | 3% |
132 Properties |
| 1998 | £39,470 | 5% |
143 Properties |
| 1997 | £37,498 | -3% |
146 Properties |
| 1996 | £38,747 | 17% |
136 Properties |
| 1995 | £32,262 | - |
136 Properties |
Property Price per Property Type in Brookside
Here you can find historic sold price data in order to help with your property search.
The average Property Paid Price for specific property types in the last three years are:
| Property Type | Average Sold Price | Sold Properties |
|---|---|---|
| Semi Detached House | £168,411.00 | 34 Semi Detached Houses |
| Detached House | £257,455.00 | 49 Detached Houses |
| Terraced House | £122,873.00 | 116 Terraced Houses |
| Flat | £69,946.00 | 28 Flats |

