
Houses for sale & to rent in Telford, Telford and Wrekin
House Prices in Telford
Properties in Telford have an average house price of £217k and had 6,122 Property Transactions within the last 3 years.¹
Telford is an area in Telford and Wrekin with 59,454 households², where the most expensive property was sold for £2.83M.
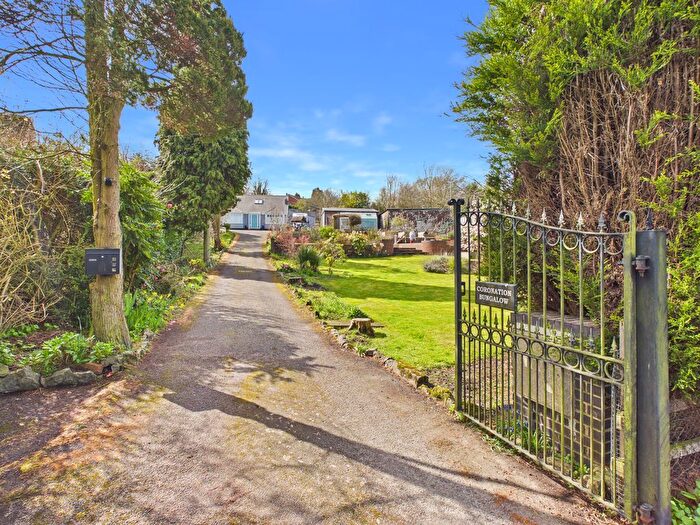
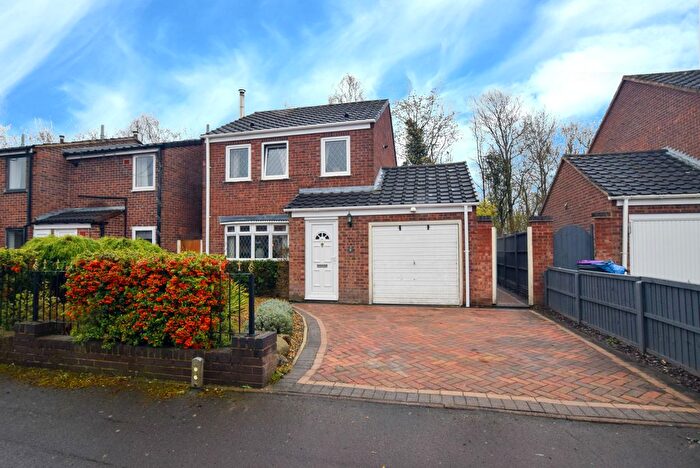
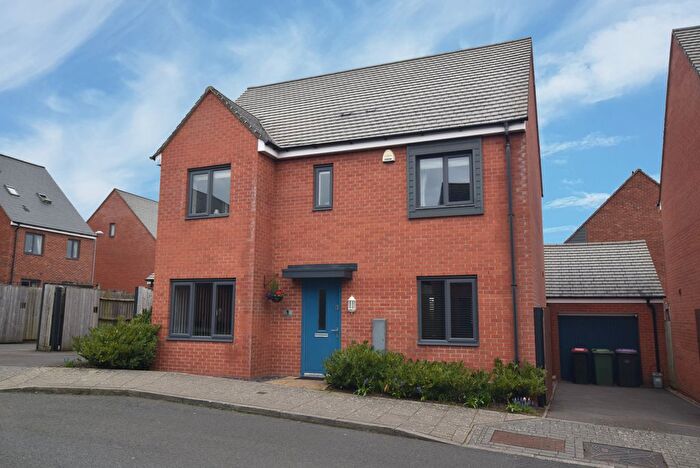
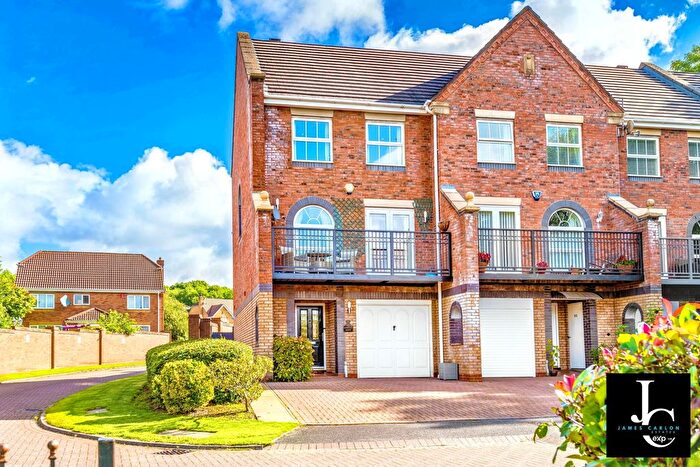
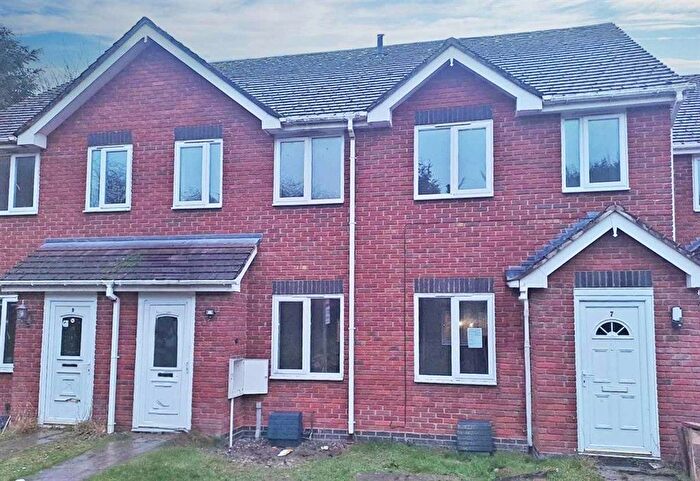
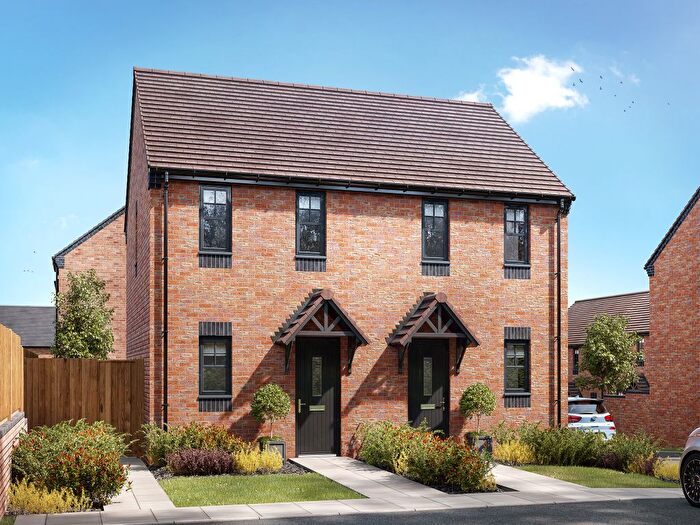
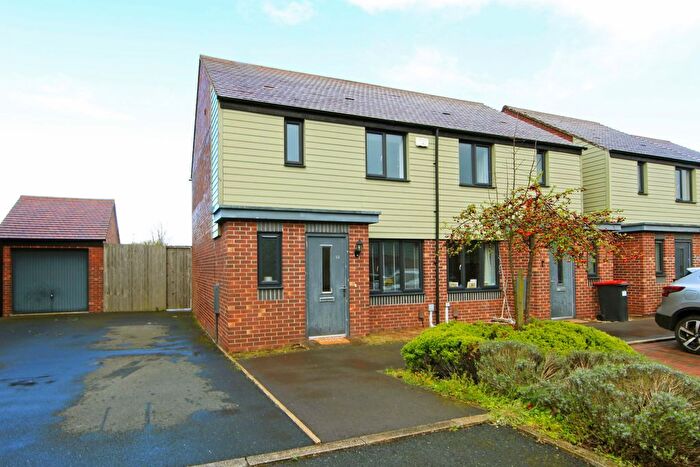
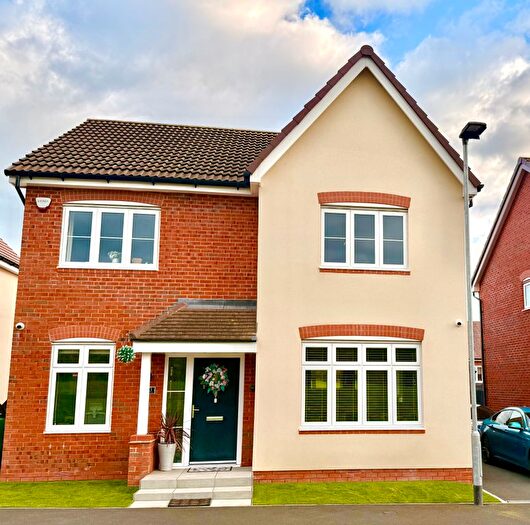
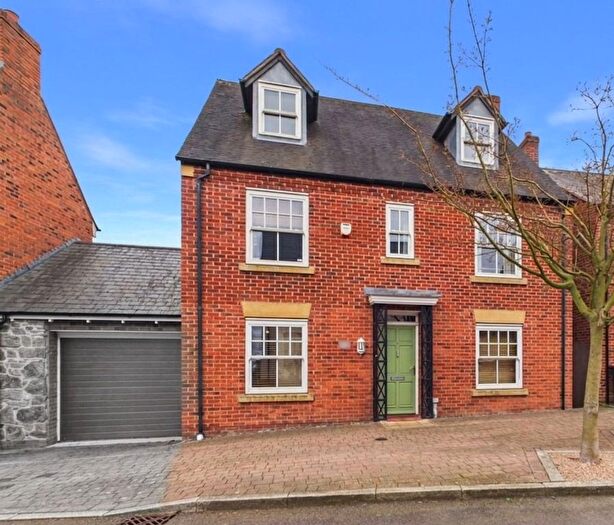
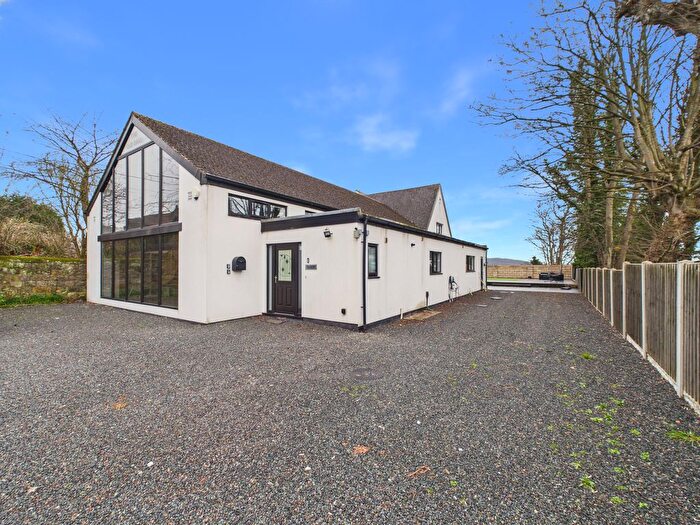
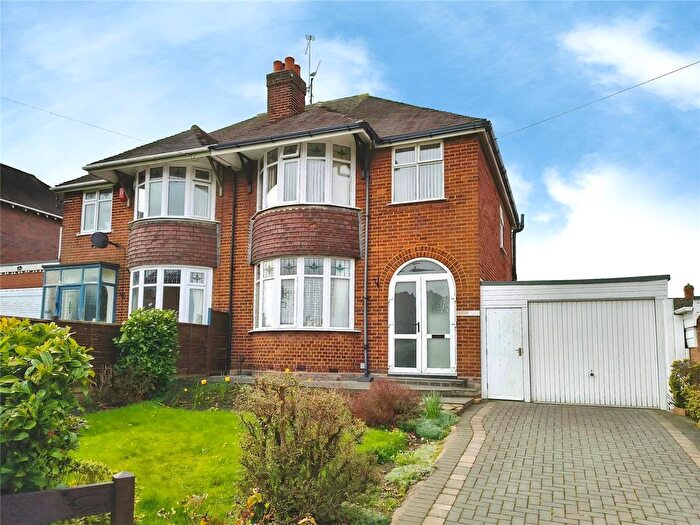
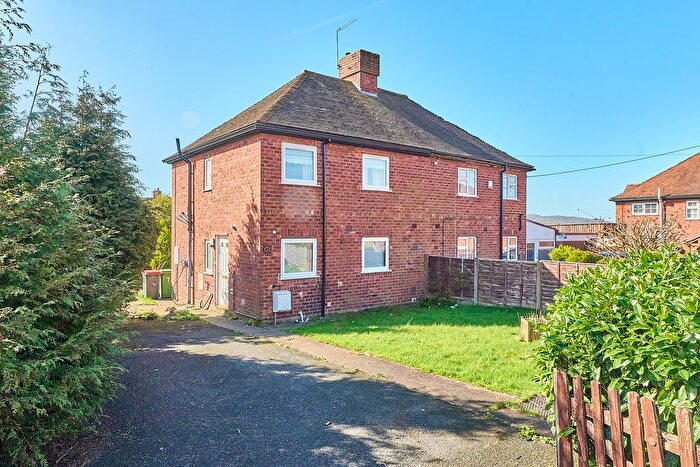
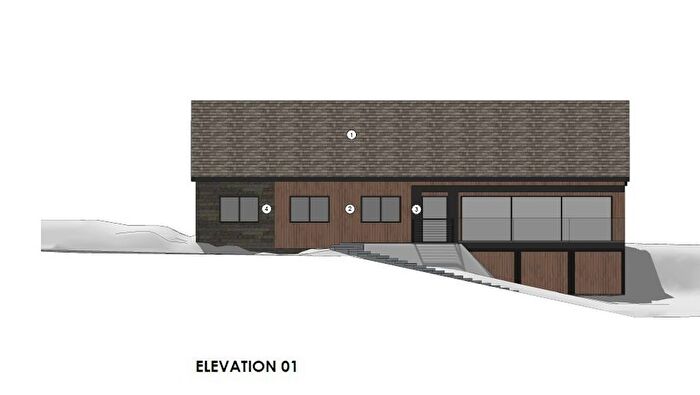
Properties for sale in Telford
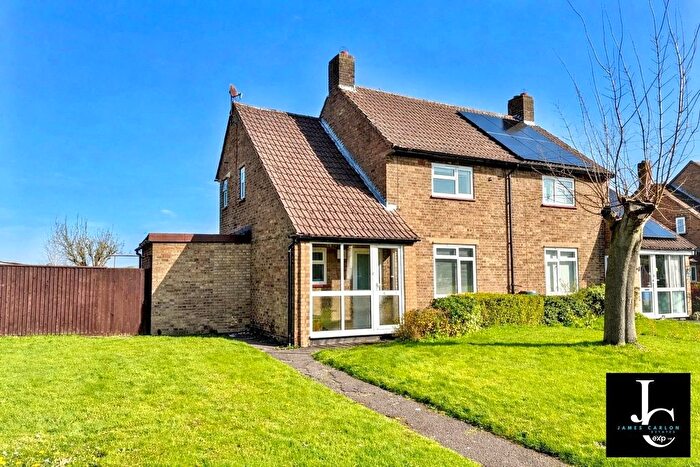
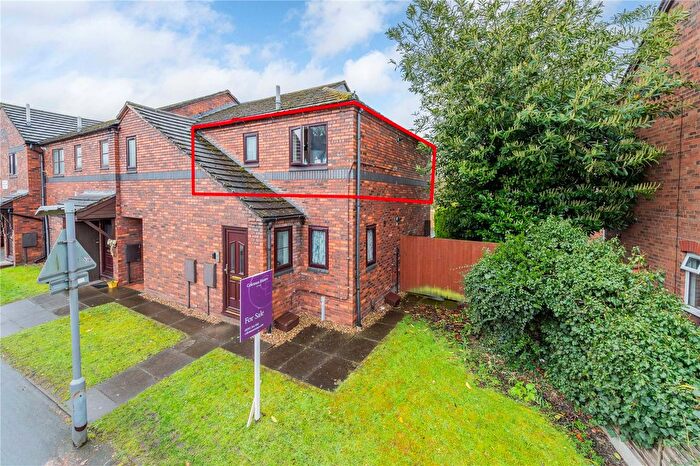
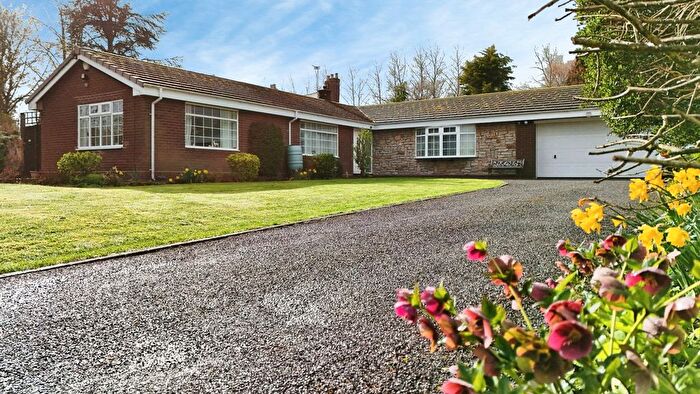
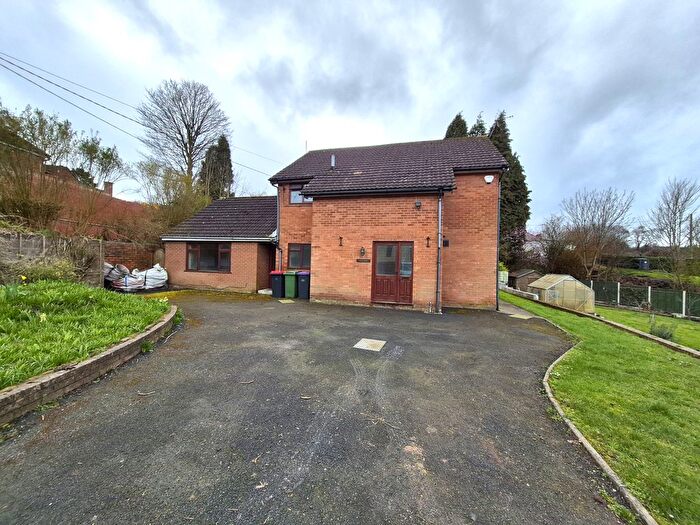
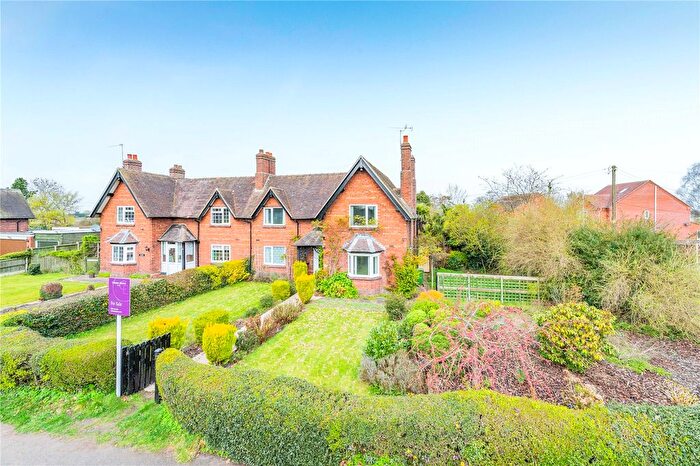
![]()
If you are looking to sell your house, let it out, or receive a property valuation, an expert can help you.
Click the button below to get started.
Neighbourhoods in Telford
Navigate through our locations to find the location of your next house in Telford, Telford and Wrekin for sale or to rent.
- Apley Castle
- Arleston
- Brookside
- Church Aston And Lilleshall
- College
- Cuckoo Oak
- Dawley Magna
- Donnington
- Dothill
- Edgmond
- Ercall
- Ercall Magna
- Hadley And Leegomery
- Haygate
- Horsehay And Lightmoor
- Ironbridge Gorge
- Ketley And Oakengates
- Lawley And Overdale
- Madeley
- Malinslee
- Muxton
- Park
- Priorslee
- Shawbirch
- St Georges
- The Nedge
- Woodside
- Wrockwardine
- Wrockwardine Wood And Trench
- Ketley & Overdale
- Oakengates & Ketley Bank
- Hadley & Leegomery
- Wrockwardine Wood & Trench
- Madeley & Sutton Hill
- Malinslee & Dawley Bank
- Church Aston & Lilleshall
- Dawley & Aqueduct
- Horsehay & Lightmoor
- Admaston & Bratton
- Edgmond & Ercall Magna
Transport in Telford
Please see below transportation links in this area:

- FAQ
- Price Paid By Year
- Property Type Price
Frequently asked questions about Telford
What is the average price for a property for sale in Telford?
The average price for a property for sale in Telford is £216,993. This amount is 4% lower than the average price in Telford and Wrekin. There are 9,379 property listings for sale in Telford.
What locations have the most expensive properties for sale in Telford?
The locations with the most expensive properties for sale in Telford are Wrockwardine Wood & Trench at an average of £835,333, Edgmond & Ercall Magna at an average of £462,089 and Wrockwardine at an average of £349,852.
What locations have the most affordable properties for sale in Telford?
The locations with the most affordable properties for sale in Telford are Woodside at an average of £124,370, Malinslee at an average of £144,379 and Cuckoo Oak at an average of £150,902.
Which train stations are available in or near Telford?
Some of the train stations available in or near Telford are Oakengates, Telford Central and Wellington.
Property Price Paid in Telford by Year
The average sold property price by year was:
| Year | Average Sold Price | Price Change |
Sold Properties
|
|---|---|---|---|
| 2026 | £193,722 | -14% |
29 Properties |
| 2025 | £221,609 | 2% |
1,820 Properties |
| 2024 | £216,385 | 1% |
2,243 Properties |
| 2023 | £213,860 | - |
2,030 Properties |
| 2022 | £213,883 | 4% |
2,432 Properties |
| 2021 | £205,876 | 6% |
3,020 Properties |
| 2020 | £194,453 | 8% |
2,342 Properties |
| 2019 | £179,299 | 6% |
3,035 Properties |
| 2018 | £169,255 | 2% |
2,754 Properties |
| 2017 | £165,163 | 3% |
2,826 Properties |
| 2016 | £159,979 | 5% |
2,926 Properties |
| 2015 | £152,566 | 1% |
2,703 Properties |
| 2014 | £150,718 | 2% |
2,596 Properties |
| 2013 | £148,265 | 1% |
1,990 Properties |
| 2012 | £146,987 | 1% |
1,596 Properties |
| 2011 | £145,927 | -3% |
1,406 Properties |
| 2010 | £149,672 | 2% |
1,292 Properties |
| 2009 | £146,417 | -4% |
1,291 Properties |
| 2008 | £152,933 | 2% |
1,518 Properties |
| 2007 | £150,342 | 5% |
2,952 Properties |
| 2006 | £142,291 | 7% |
3,279 Properties |
| 2005 | £132,572 | 0,1% |
2,780 Properties |
| 2004 | £132,399 | 17% |
3,573 Properties |
| 2003 | £110,065 | 18% |
3,484 Properties |
| 2002 | £90,313 | 17% |
3,666 Properties |
| 2001 | £75,381 | 7% |
3,575 Properties |
| 2000 | £70,155 | 8% |
3,329 Properties |
| 1999 | £64,658 | 7% |
3,534 Properties |
| 1998 | £59,967 | 5% |
2,946 Properties |
| 1997 | £56,775 | 7% |
2,924 Properties |
| 1996 | £52,704 | 6% |
2,657 Properties |
| 1995 | £49,445 | - |
2,383 Properties |
Property Price per Property Type in Telford
Here you can find historic sold price data in order to help with your property search.
The average Property Paid Price for specific property types in the last three years are:
| Property Type | Average Sold Price | Sold Properties |
|---|---|---|
| Semi Detached House | £196,124.00 | 2,204 Semi Detached Houses |
| Terraced House | £157,207.00 | 1,798 Terraced Houses |
| Detached House | £338,017.00 | 1,683 Detached Houses |
| Flat | £102,134.00 | 437 Flats |