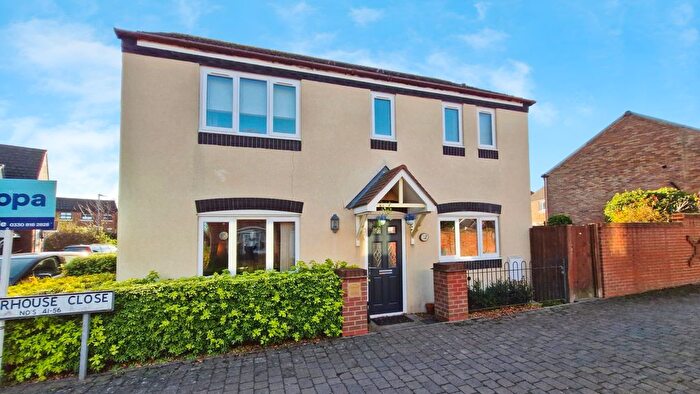
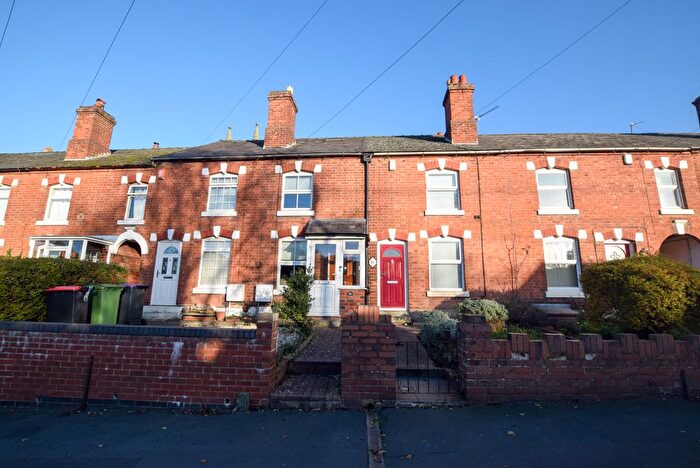
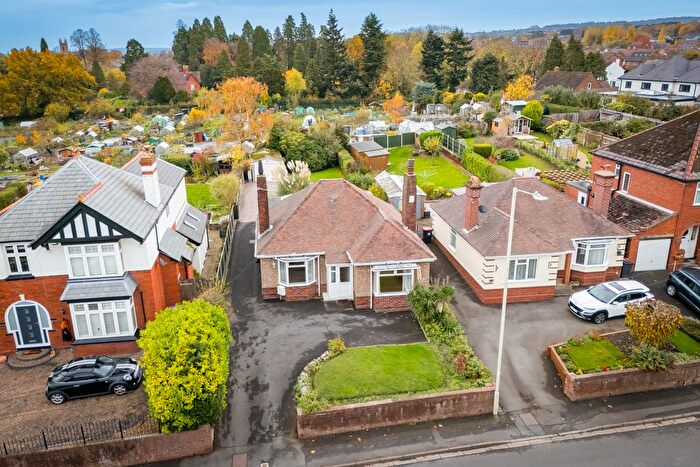
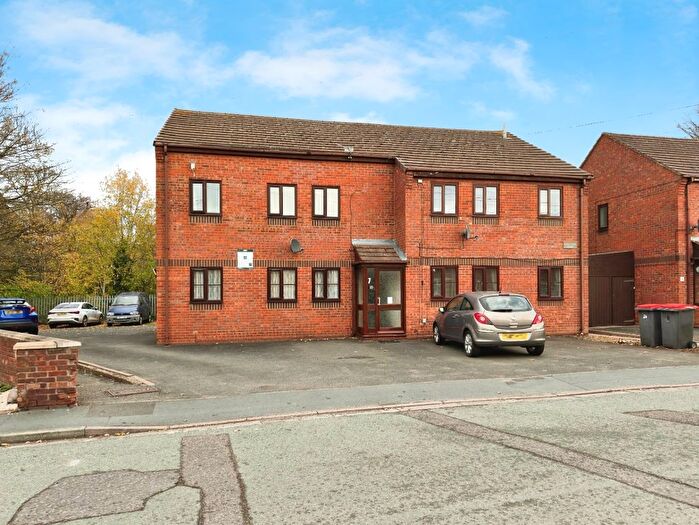
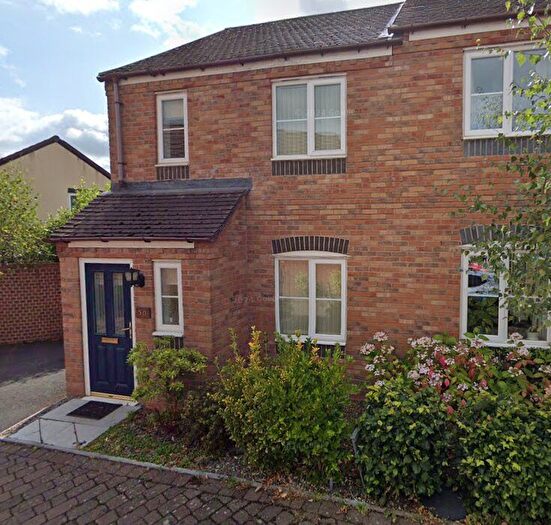
Houses for sale & to rent in Haygate, Telford
House Prices in Haygate
Properties in Haygate have an average house price of £170,786.00 and had 179 Property Transactions within the last 3 years¹.
Haygate is an area in Telford, Telford and Wrekin with 1,459 households², where the most expensive property was sold for £465,000.00.
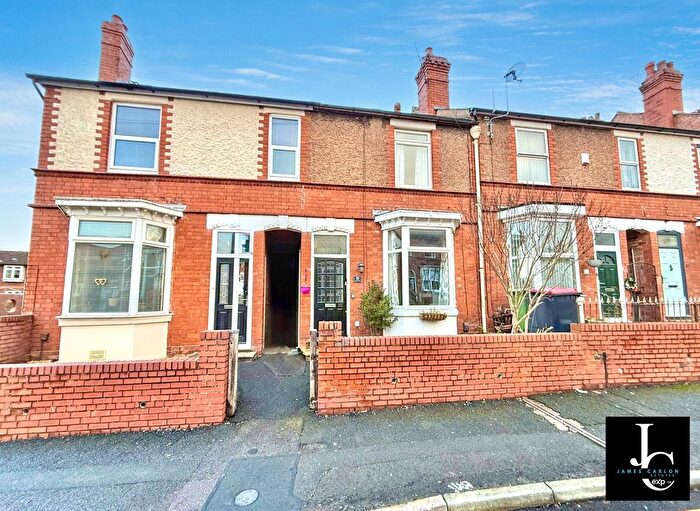
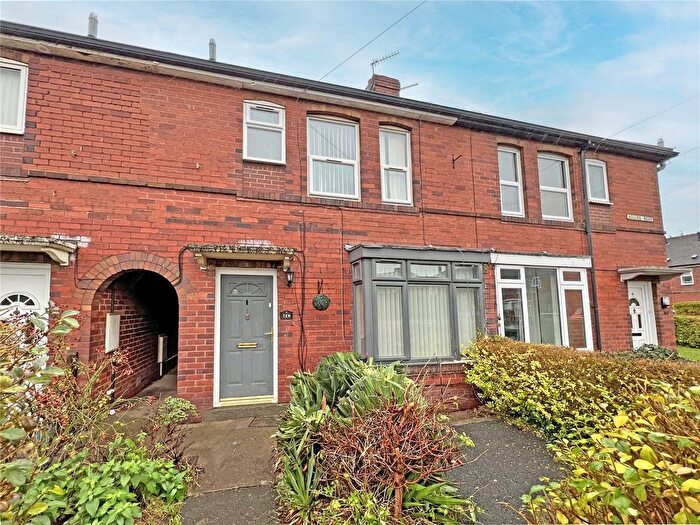
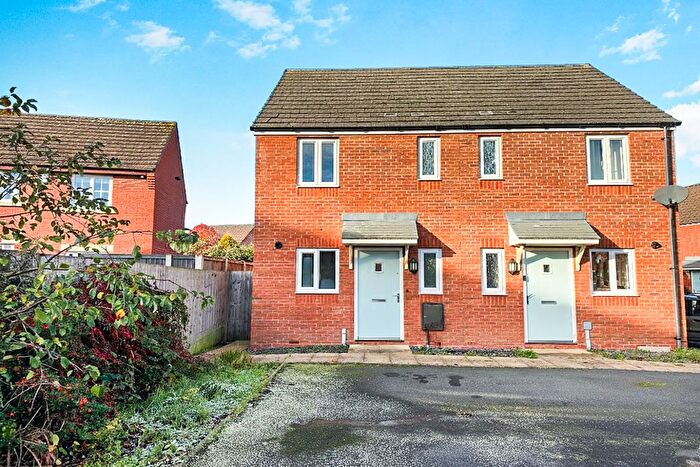
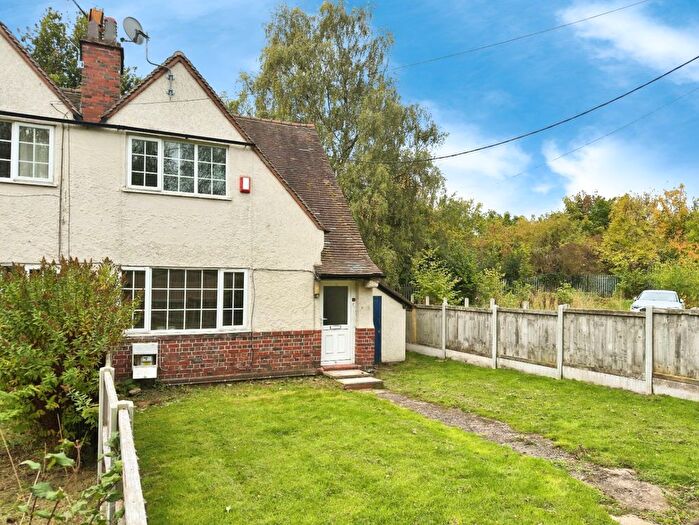
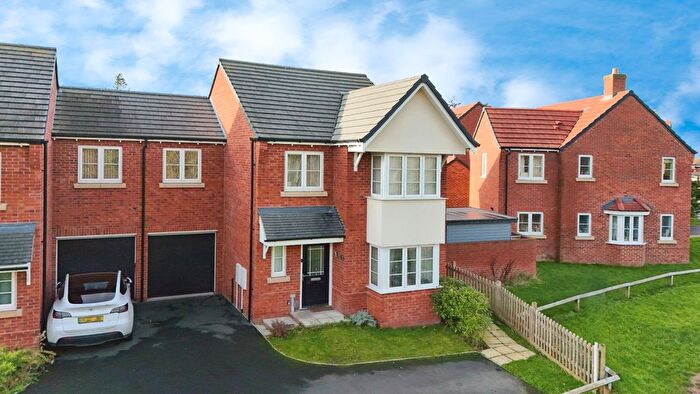
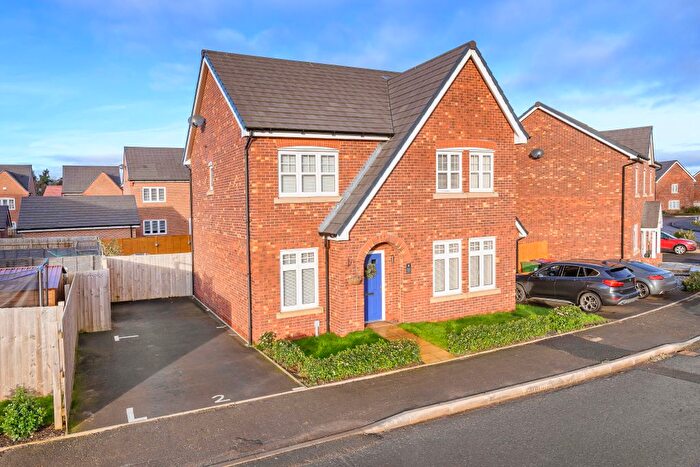
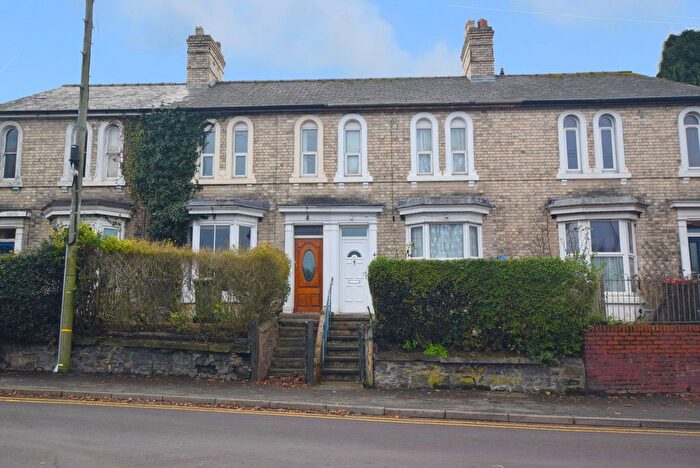
Properties for sale in Haygate
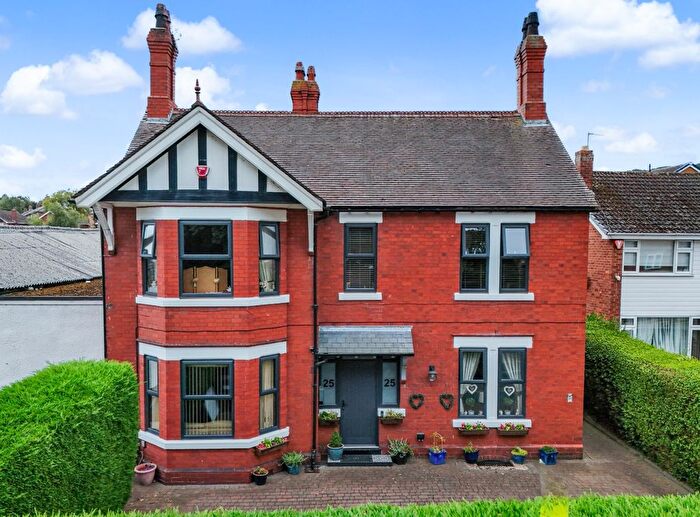
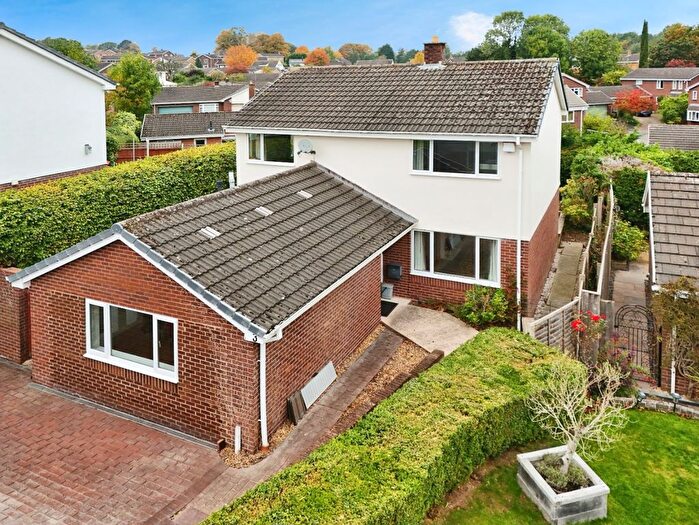
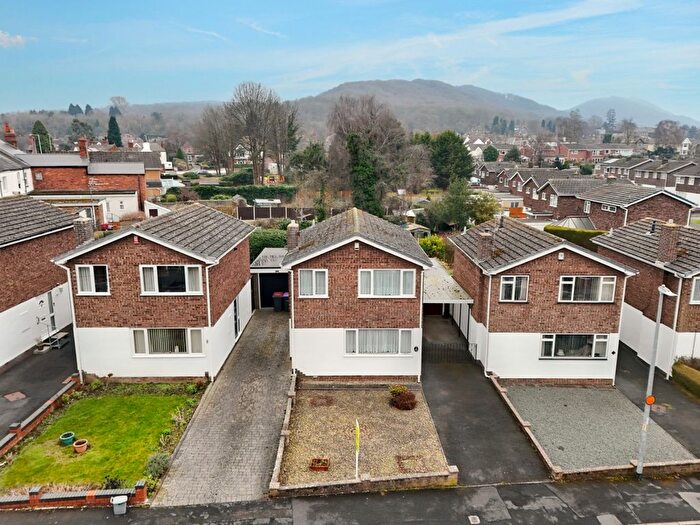
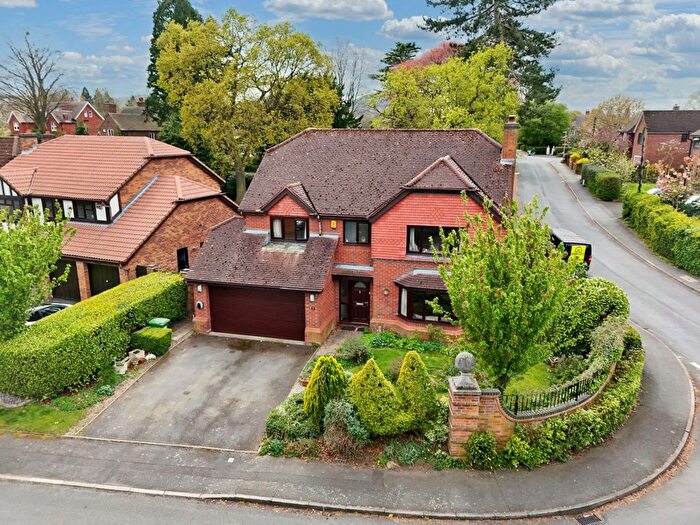
Previously listed properties in Haygate
Roads and Postcodes in Haygate
Navigate through our locations to find the location of your next house in Haygate, Telford for sale or to rent.
| Streets | Postcodes |
|---|---|
| Addison Road | TF1 2BA |
| Admaston Road | TF1 3NB TF1 3NE |
| Alexandra Road | TF1 1QE |
| Alexandra Terrace | TF1 1NF |
| Atlas Grove | TF1 2BE |
| Baden Terrace | TF1 2AE |
| Beech Close | TF1 3NQ |
| Bell Street | TF1 1LS |
| Brambles Walk | TF1 2ED |
| Brewers Court | TF1 1EU |
| Bridge Road | TF1 1EA TF1 1DZ TF1 1EB TF1 1ED |
| Britten Court | TF1 1YU |
| Burgess Road | TF1 2GD |
| Cart Gate | TF1 1RB |
| Charlton Row | TF1 1EL TF1 1EP |
| Charlton Street | TF1 1ES |
| Christie Way | TF1 2GJ |
| Church Street | TF1 1DD TF1 1BX TF1 1DG TF1 1DQ TF1 1DR |
| Clift Crescent | TF1 2AL |
| Cole Terrace | TF1 1AG |
| Cranage Crescent | TF1 2AT TF1 2AU |
| Crown Street | TF1 1LP |
| Duke Street | TF1 1BJ |
| Ercall Heath | TF6 6YB |
| Espley Close | TF1 1ND |
| George Place | TF1 2AJ |
| Glebe Flats | TF1 1LH |
| Glebe Street | TF1 1JY TF1 1JP |
| Haygate Road | TF1 1QA TF1 2BU TF1 2BW |
| Hesba Close | TF1 2BD |
| Heywood Lonsdale Court | TF1 1SL |
| High Street | TF1 1JL TF1 1JN TF1 1NQ TF1 1JJ TF1 1LL |
| Hollies Road | TF1 1QL TF1 2AH TF1 2AX TF1 2AY |
| Holyhead Road | TF1 2DW |
| Landau Court | TF1 1HE |
| Lawrence Road | TF1 2AP TF1 2AN TF1 2AW |
| Maddocks Court | TF1 1SH TF1 1SQ |
| Malthouse Court | TF1 1QJ |
| Mansell Road | TF1 1QQ |
| Market Approach | TF1 1BW |
| Market Square | TF1 1BP TF1 1DB |
| Market Street | TF1 1DT |
| Martin Road | TF1 2AG |
| Midland Mews | TF1 1AF |
| Montgomery Road | TF1 2AQ |
| Moorhouse Close | TF1 2BF |
| Nevil Road | TF1 3DE |
| New Church Close | TF1 1LE |
| New Church Road | TF1 1JD TF1 1JH |
| New Street | TF1 1NE TF1 1SW |
| Orleton Lane | TF1 2AA TF1 2AF TF1 3DD TF1 3DF |
| Orleton Mews | TF1 3GG |
| Orleton Terrace | TF1 1QH |
| Orwell Crescent | TF1 2GE |
| Paddock Close | TF1 3ND |
| Poplar Drive | TF1 3NG |
| Portia Close | TF1 2BQ |
| Powder Lane | TF1 2BL |
| Purcell Court | TF1 1YX |
| Queen Street | TF1 1EH TF1 1ER TF1 1EW TF1 1SN |
| Rose Grove | TF1 1JB |
| Roseway | TF1 1HU TF1 1JA |
| Rosthwaite | TF1 1HX |
| Rushen Court | TF1 1HL |
| Saville Close | TF1 2DG TF1 2DU |
| Spring Hill | TF1 3NA |
| Springhill | TF1 1RP |
| St John Street | TF1 1JZ TF1 1LJ |
| Stamford Court | TF1 1YY |
| Steventon Road | TF1 2AS |
| Tallis Court | TF1 1YZ |
| Tan Bank | TF1 1HJ TF1 1HW TF1 1LX |
| Tellus Row | TF1 1AE |
| Ten Tree Croft | TF1 1EJ TF1 1EG |
| The Maltings | TF1 1QG |
| Tolkien Way | TF1 2GF |
| Victoria Road | TF1 1LG TF1 1LT TF1 1AJ TF1 1LQ |
| Walker Street | TF1 1AA TF1 1BA TF1 1BD TF1 1BE |
| Waugh Drive | TF1 2GG |
| West Road | TF1 2AZ TF1 2BB |
| Woodlands Avenue | TF1 2AR |
| Wrekin Road | TF1 1QZ |
| Wrockwardine Road | TF1 3DA TF1 3DB |
| TF1 1WE TF1 6QW TF1 6TE TF1 6TG TF1 6ZL TF1 9AL TF1 9AY TF1 9DS TF1 9DU TF1 9DW TF1 9EB TF1 9EF TF1 9EN TF1 9ER TF1 9FY TF5 0WQ TF6 5WA TF6 5WE TF6 6WB TF6 6WH |
Transport near Haygate
- FAQ
- Price Paid By Year
- Property Type Price
Frequently asked questions about Haygate
What is the average price for a property for sale in Haygate?
The average price for a property for sale in Haygate is £170,786. This amount is 21% lower than the average price in Telford. There are 730 property listings for sale in Haygate.
What streets have the most expensive properties for sale in Haygate?
The streets with the most expensive properties for sale in Haygate are Powder Lane at an average of £322,500, Wrockwardine Road at an average of £314,250 and Tolkien Way at an average of £269,487.
What streets have the most affordable properties for sale in Haygate?
The streets with the most affordable properties for sale in Haygate are Ten Tree Croft at an average of £85,500, High Street at an average of £114,375 and George Place at an average of £121,000.
Which train stations are available in or near Haygate?
Some of the train stations available in or near Haygate are Wellington, Oakengates and Telford Central.
Property Price Paid in Haygate by Year
The average sold property price by year was:
| Year | Average Sold Price | Price Change |
Sold Properties
|
|---|---|---|---|
| 2025 | £163,009 | -9% |
28 Properties |
| 2024 | £177,838 | 1% |
44 Properties |
| 2023 | £176,078 | 6% |
48 Properties |
| 2022 | £164,913 | -17% |
59 Properties |
| 2021 | £192,907 | 8% |
91 Properties |
| 2020 | £176,544 | 11% |
60 Properties |
| 2019 | £156,800 | 19% |
79 Properties |
| 2018 | £126,470 | -3% |
36 Properties |
| 2017 | £130,117 | 8% |
38 Properties |
| 2016 | £120,002 | -0,4% |
67 Properties |
| 2015 | £120,523 | -6% |
54 Properties |
| 2014 | £128,213 | 13% |
81 Properties |
| 2013 | £112,146 | 2% |
45 Properties |
| 2012 | £110,241 | -15% |
29 Properties |
| 2011 | £127,149 | 15% |
30 Properties |
| 2010 | £108,583 | -15% |
24 Properties |
| 2009 | £124,822 | -1% |
24 Properties |
| 2008 | £125,929 | -7% |
41 Properties |
| 2007 | £134,269 | -2% |
54 Properties |
| 2006 | £136,775 | 7% |
56 Properties |
| 2005 | £127,635 | 8% |
123 Properties |
| 2004 | £117,973 | 22% |
120 Properties |
| 2003 | £91,764 | 22% |
70 Properties |
| 2002 | £71,167 | 14% |
64 Properties |
| 2001 | £61,266 | 5% |
42 Properties |
| 2000 | £58,265 | 13% |
45 Properties |
| 1999 | £50,422 | 6% |
60 Properties |
| 1998 | £47,148 | -12% |
33 Properties |
| 1997 | £52,678 | 12% |
34 Properties |
| 1996 | £46,232 | -19% |
35 Properties |
| 1995 | £54,987 | - |
26 Properties |
Property Price per Property Type in Haygate
Here you can find historic sold price data in order to help with your property search.
The average Property Paid Price for specific property types in the last three years are:
| Property Type | Average Sold Price | Sold Properties |
|---|---|---|
| Semi Detached House | £186,951.00 | 79 Semi Detached Houses |
| Detached House | £264,868.00 | 16 Detached Houses |
| Terraced House | £157,126.00 | 55 Terraced Houses |
| Flat | £100,750.00 | 29 Flats |


