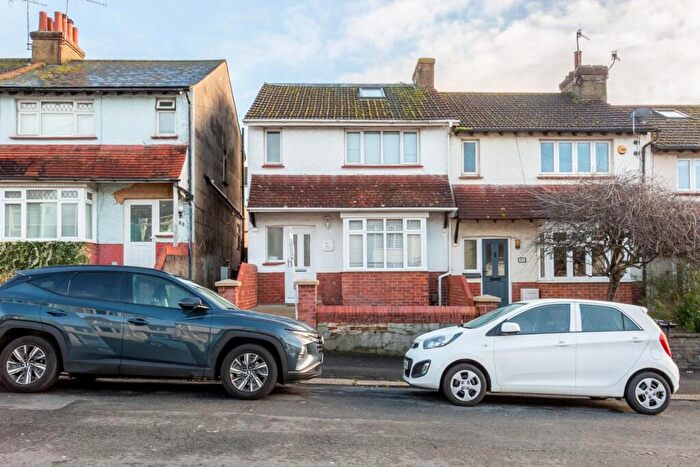
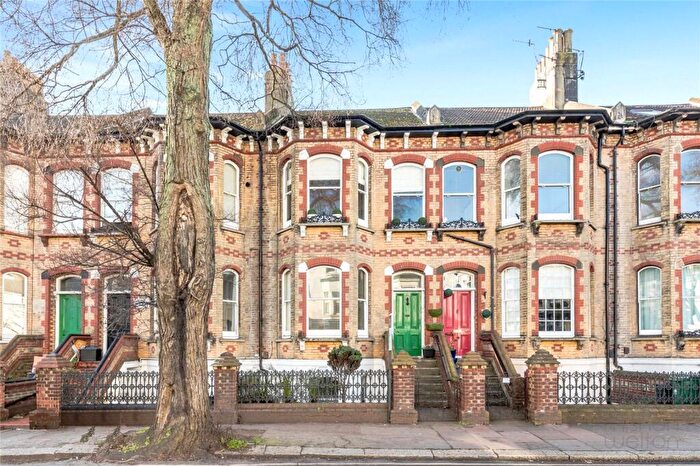
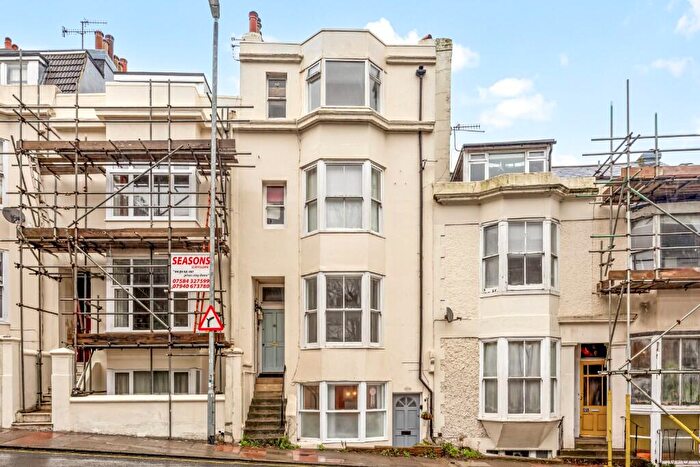
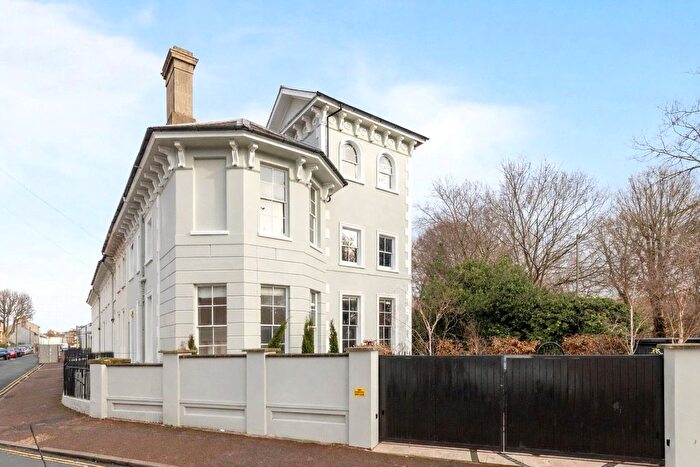
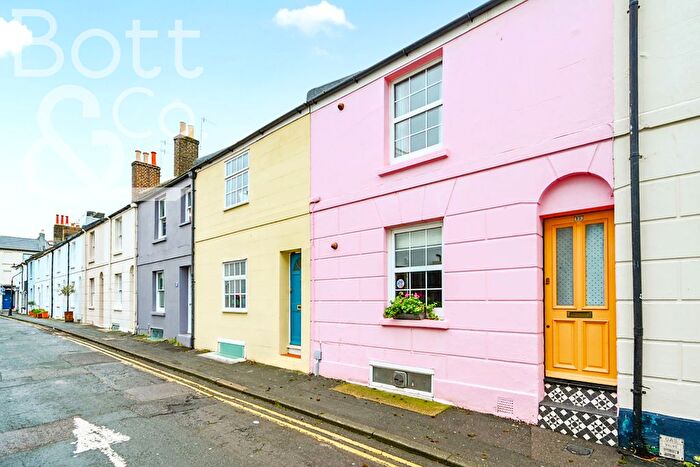
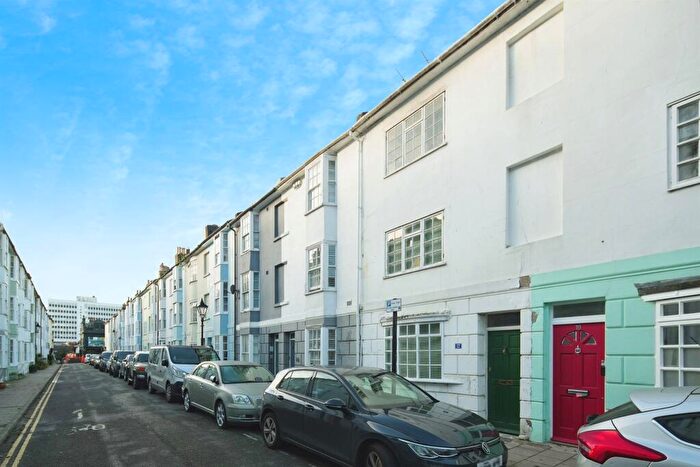
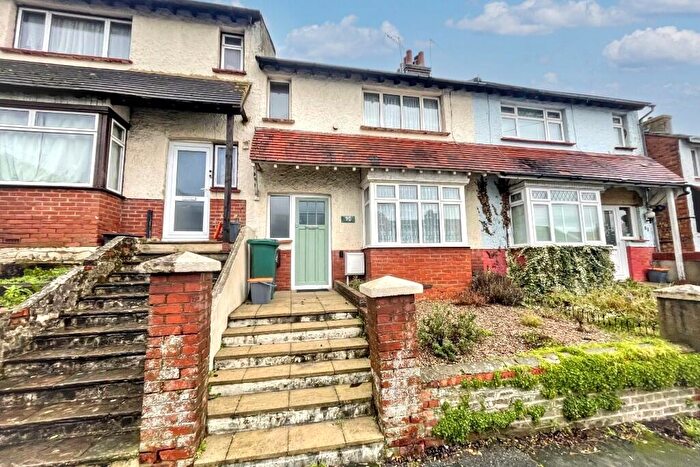
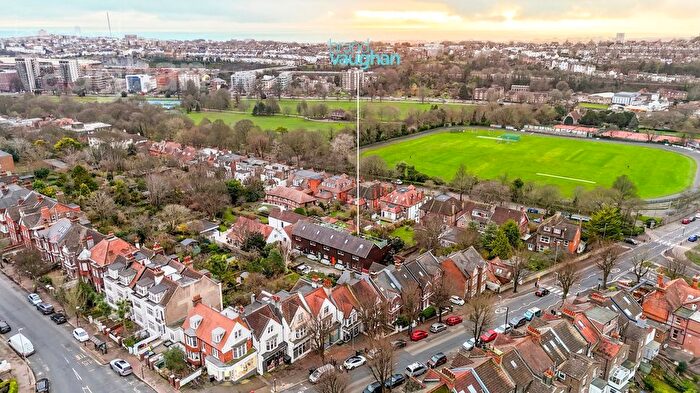
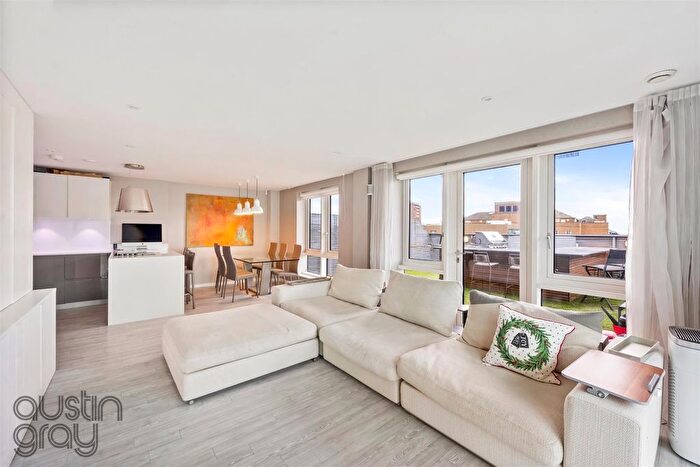
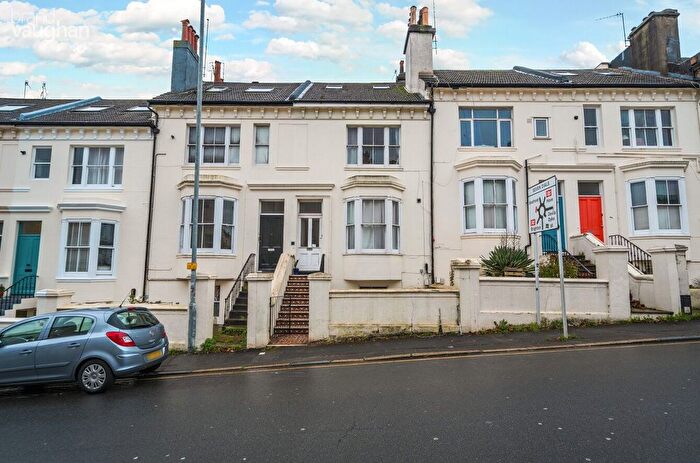
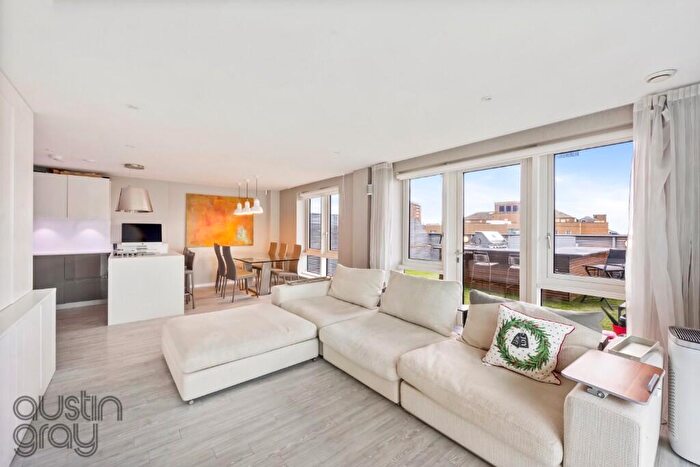
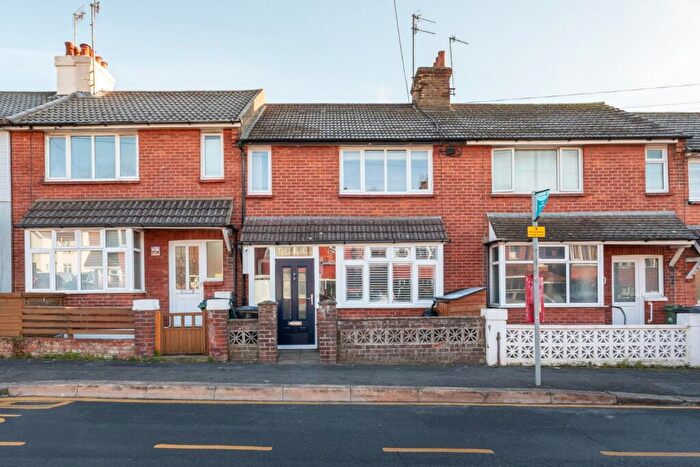
Houses for sale & to rent in Preston Park, Brighton
House Prices in Preston Park
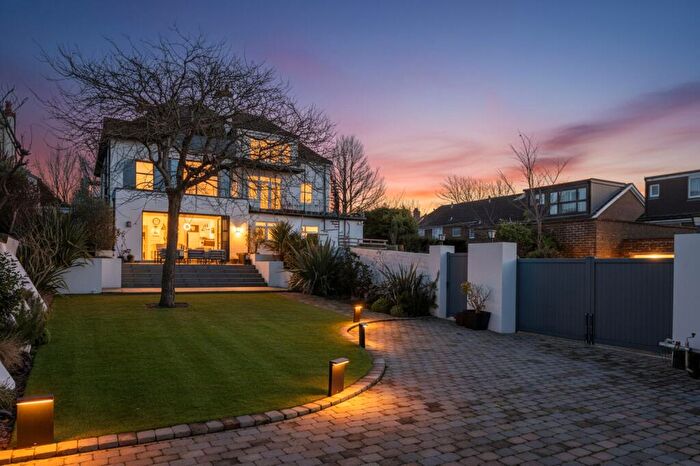
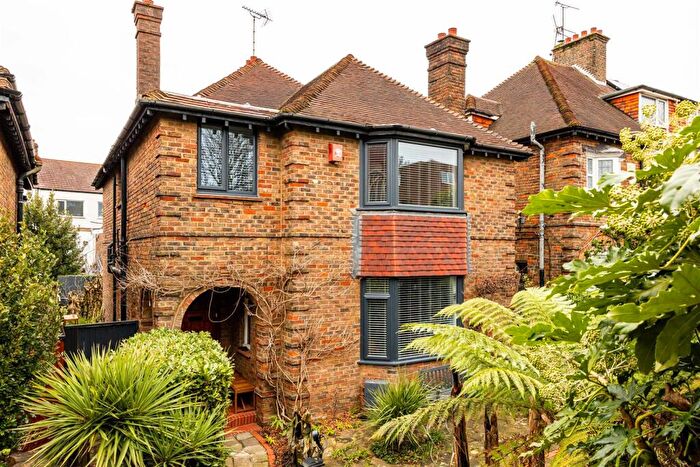
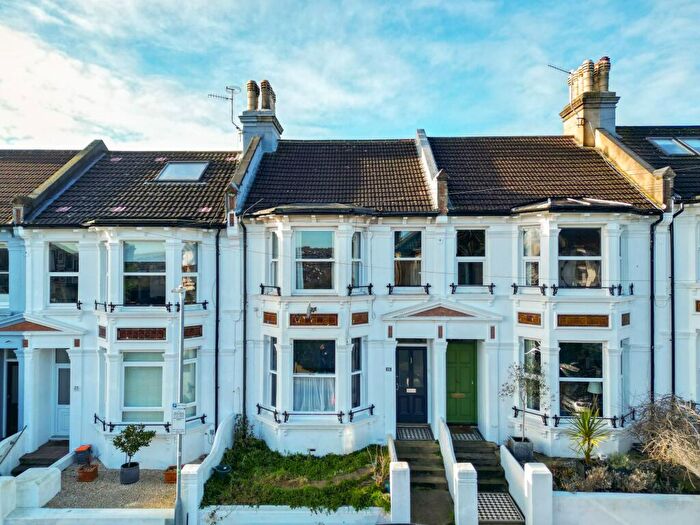
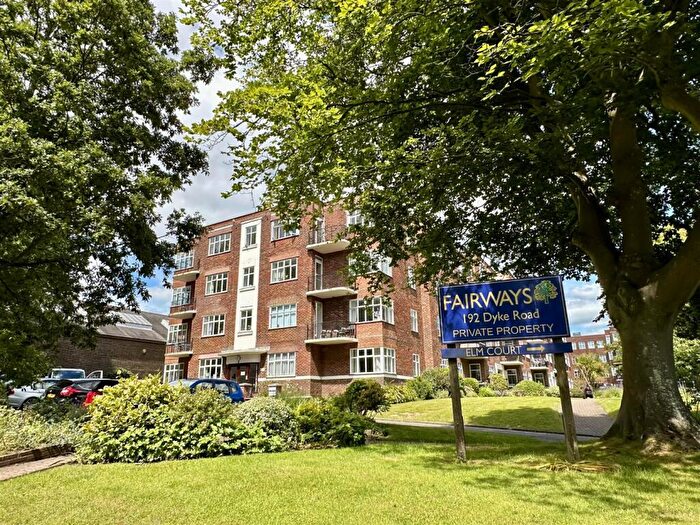
Properties in Preston Park have an average house price of £518,733.00 and had 935 Property Transactions within the last 3 years¹.
Preston Park is an area in Brighton, The City of Brighton and Hove with 6,683 households², where the most expensive property was sold for £2,100,000.00.
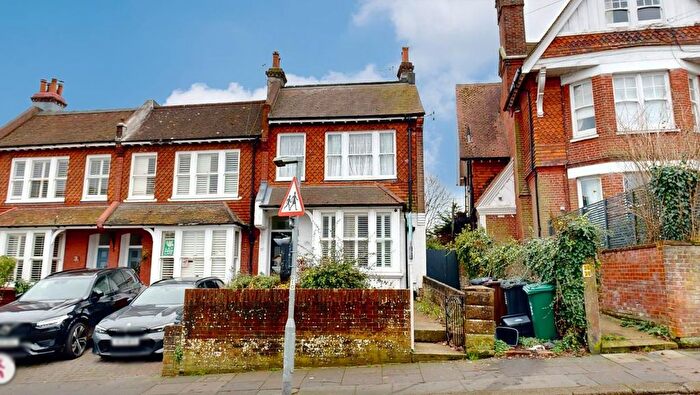
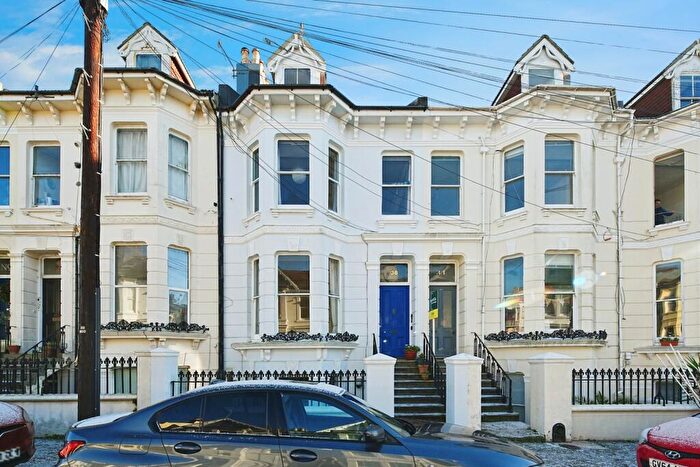
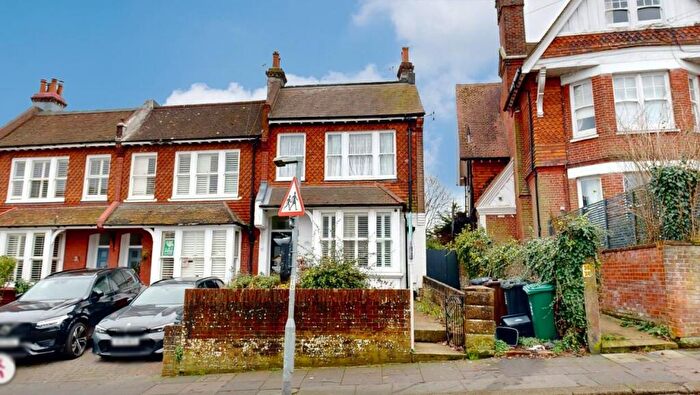
Properties for sale in Preston Park
Roads and Postcodes in Preston Park
Navigate through our locations to find the location of your next house in Preston Park, Brighton for sale or to rent.
Transport near Preston Park
-
London Road Brighton Station
-
Brighton Station
-
Preston Park Station
-
Moulsecoomb Station
-
Hove Station
-
Aldrington Station
-
Portslade Station
-
Falmer Station
- FAQ
- Price Paid By Year
- Property Type Price
Frequently asked questions about Preston Park
What is the average price for a property for sale in Preston Park?
The average price for a property for sale in Preston Park is £518,733. This amount is 11% higher than the average price in Brighton. There are 4,684 property listings for sale in Preston Park.
What streets have the most expensive properties for sale in Preston Park?
The streets with the most expensive properties for sale in Preston Park are Rugby Road at an average of £933,355, Waldegrave Road at an average of £885,529 and Southdown Place at an average of £882,500.
What streets have the most affordable properties for sale in Preston Park?
The streets with the most affordable properties for sale in Preston Park are Dyke Road at an average of £283,350, Campbell Road at an average of £291,212 and Ditchling Rise at an average of £308,684.
Which train stations are available in or near Preston Park?
Some of the train stations available in or near Preston Park are London Road Brighton, Brighton and Preston Park.
Property Price Paid in Preston Park by Year
The average sold property price by year was:
| Year | Average Sold Price | Price Change |
Sold Properties
|
|---|---|---|---|
| 2025 | £522,305 | 0,2% |
151 Properties |
| 2024 | £521,123 | -1% |
246 Properties |
| 2023 | £527,847 | 4% |
222 Properties |
| 2022 | £508,763 | 4% |
316 Properties |
| 2021 | £487,898 | 6% |
380 Properties |
| 2020 | £460,095 | 8% |
223 Properties |
| 2019 | £423,287 | -4% |
263 Properties |
| 2018 | £442,164 | 5% |
254 Properties |
| 2017 | £419,962 | 7% |
299 Properties |
| 2016 | £390,402 | 3% |
347 Properties |
| 2015 | £379,257 | 6% |
337 Properties |
| 2014 | £356,502 | 13% |
399 Properties |
| 2013 | £309,955 | 4% |
329 Properties |
| 2012 | £296,307 | 0,2% |
259 Properties |
| 2011 | £295,786 | -4% |
284 Properties |
| 2010 | £306,320 | 11% |
277 Properties |
| 2009 | £271,363 | -1% |
238 Properties |
| 2008 | £275,024 | 7% |
236 Properties |
| 2007 | £255,749 | 3% |
459 Properties |
| 2006 | £249,132 | 10% |
552 Properties |
| 2005 | £224,025 | 9% |
435 Properties |
| 2004 | £202,990 | 3% |
448 Properties |
| 2003 | £197,868 | 18% |
451 Properties |
| 2002 | £162,610 | 15% |
559 Properties |
| 2001 | £138,511 | 18% |
529 Properties |
| 2000 | £113,416 | 21% |
512 Properties |
| 1999 | £89,719 | 15% |
557 Properties |
| 1998 | £75,913 | 16% |
486 Properties |
| 1997 | £63,431 | 3% |
499 Properties |
| 1996 | £61,718 | 6% |
411 Properties |
| 1995 | £58,020 | - |
338 Properties |
Property Price per Property Type in Preston Park
Here you can find historic sold price data in order to help with your property search.
The average Property Paid Price for specific property types in the last three years are:
| Property Type | Average Sold Price | Sold Properties |
|---|---|---|
| Flat | £318,695.00 | 536 Flats |
| Semi Detached House | £996,746.00 | 69 Semi Detached Houses |
| Detached House | £1,066,947.00 | 19 Detached Houses |
| Terraced House | £723,947.00 | 311 Terraced Houses |

