
Houses for sale & to rent in Brighton, The City of Brighton and Hove
House Prices in Brighton
Properties in Brighton have an average house price of £459,866.00 and had 6,535 Property Transactions within the last 3 years.¹
Brighton is an area in The City of Brighton and Hove with 83,463 households², where the most expensive property was sold for £3,850,000.00.
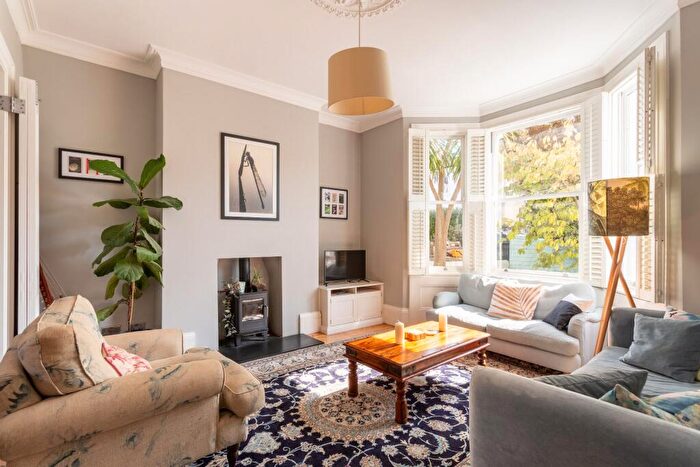
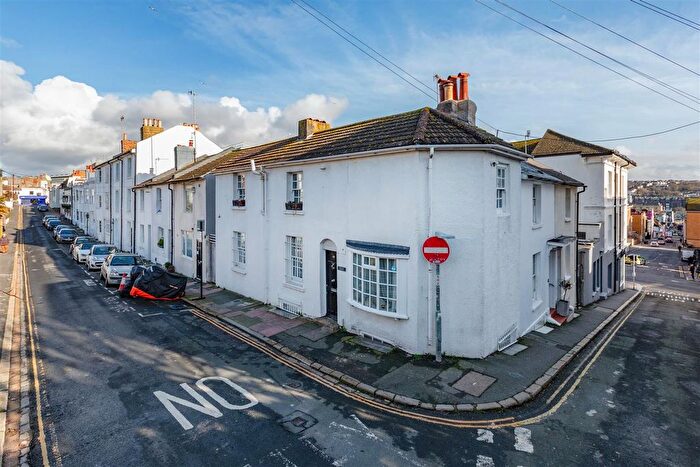
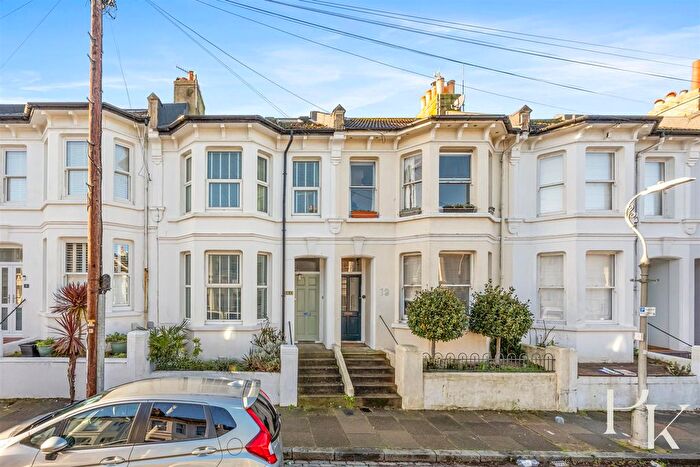
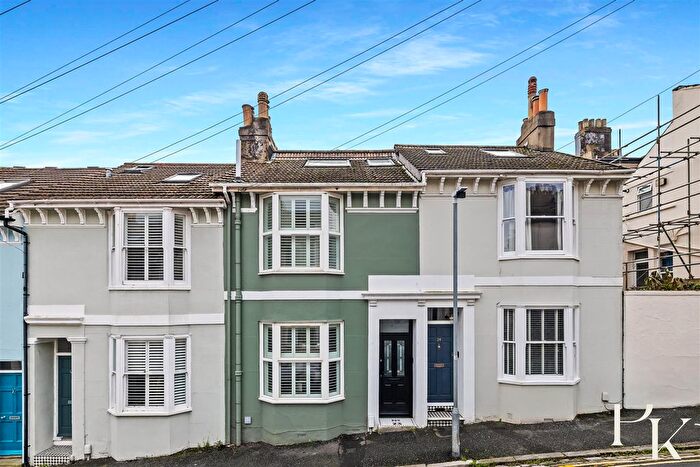
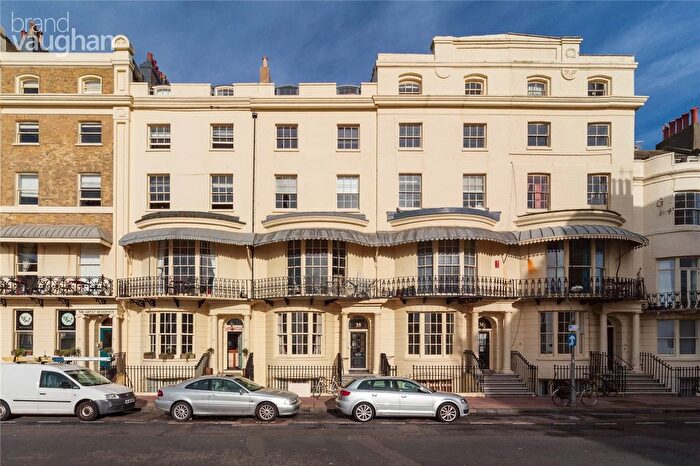
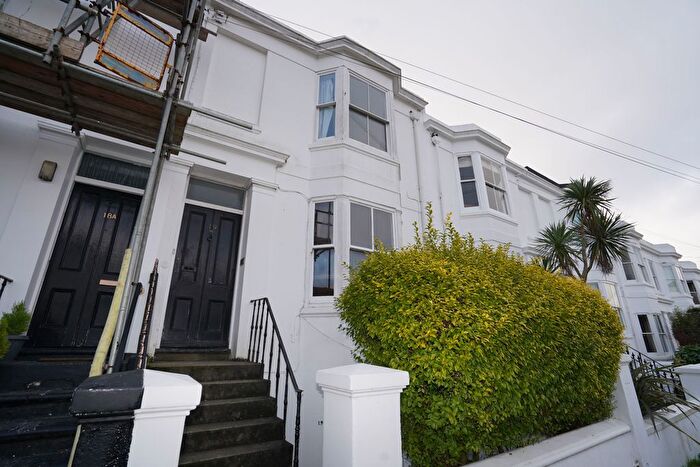
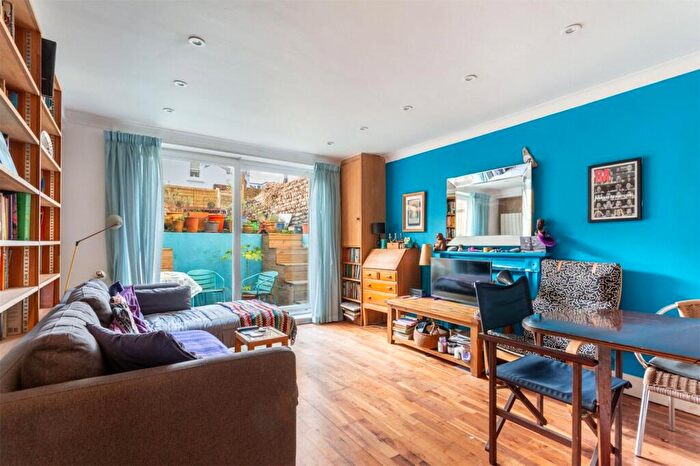
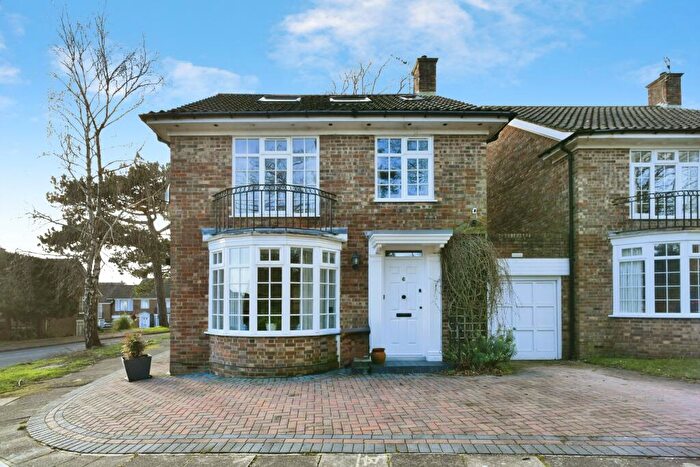
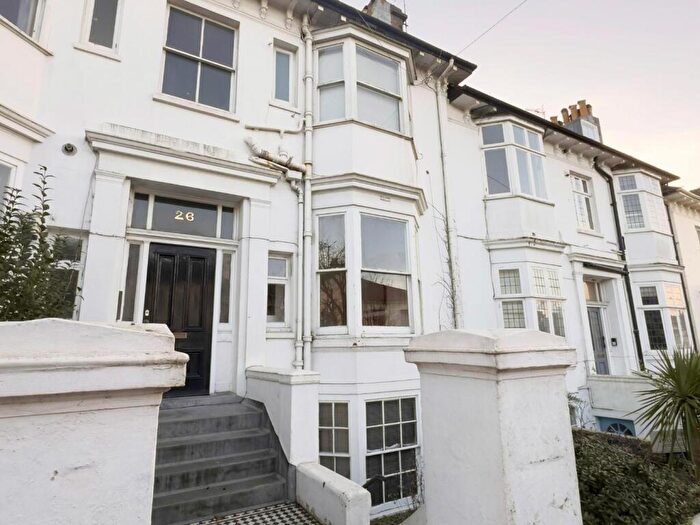
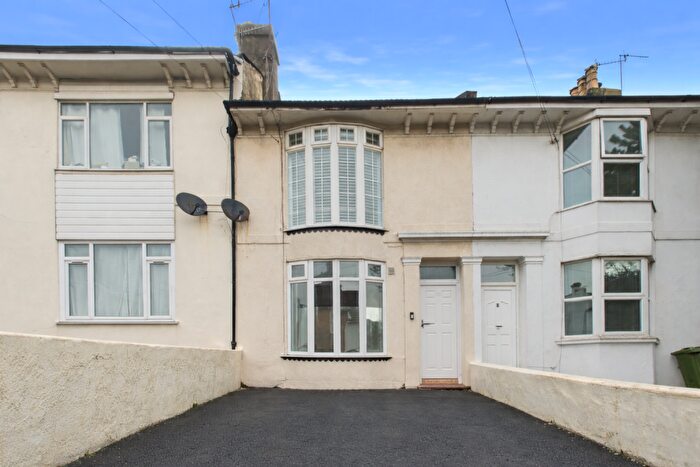
Properties for sale in Brighton
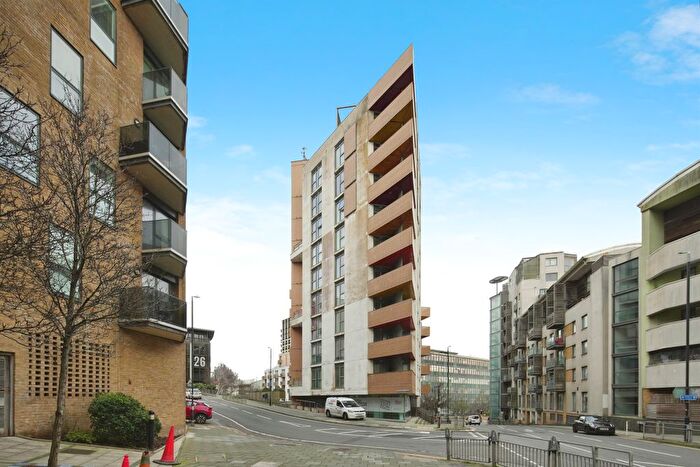


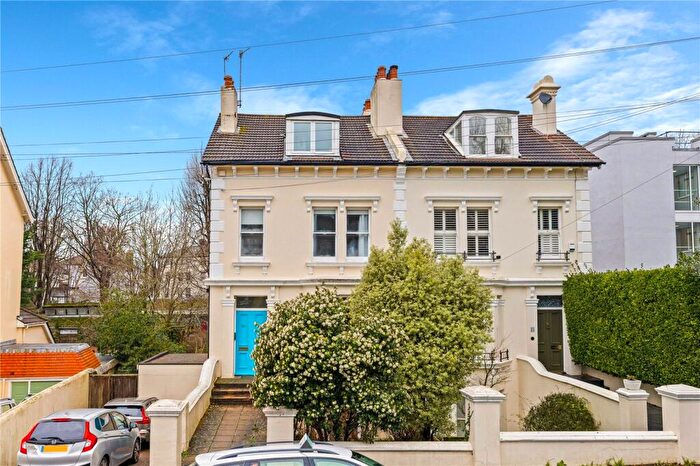
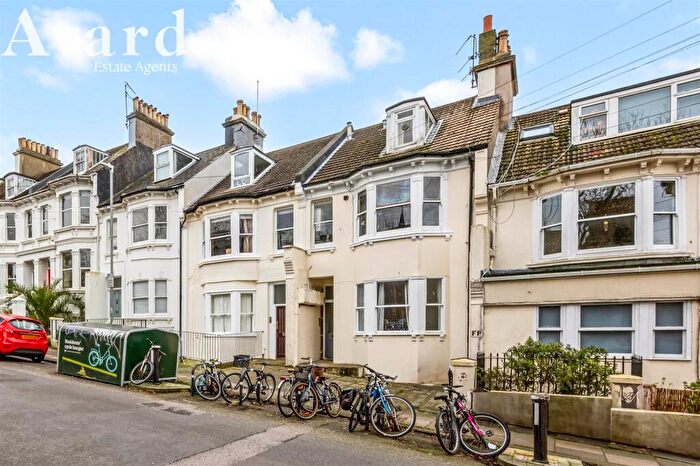

![]()
If you are looking to sell your house, let it out, or receive a property valuation, an expert can help you.
Click the button below to get started.


Neighbourhoods in Brighton
Navigate through our locations to find the location of your next house in Brighton, The City of Brighton and Hove for sale or to rent.
Transport in Brighton
Please see below transportation links in this area:
-
 London Road Brighton Station
 -
Brighton Station
-
Moulsecoomb Station
-
Preston Park Station
-
Hove Station
-
Aldrington Station
-
Falmer Station
- FAQ
- Price Paid By Year
- Property Type Price
Frequently asked questions about Brighton
What is the average price for a property for sale in Brighton?
The average price for a property for sale in Brighton is £459,866. This amount is 6% lower than the average price in The City of Brighton and Hove. There are more than 10,000 property listings for sale in Brighton.
What locations have the most expensive properties for sale in Brighton?
The locations with the most expensive properties for sale in Brighton are Wish at an average of £2,200,000, Withdean at an average of £563,836 and Rottingdean Coastal at an average of £534,988.
What locations have the most affordable properties for sale in Brighton?
The locations with the most affordable properties for sale in Brighton are North Portslade at an average of £353,026, Moulsecoomb And Bevendean at an average of £366,293 and South Portslade at an average of £405,719.
Which train stations are available in or near Brighton?
Some of the train stations available in or near Brighton are London Road Brighton, Brighton and Moulsecoomb.
Property Price Paid in Brighton by Year
The average sold property price by year was:
| Year | Average Sold Price | Price Change |
Sold Properties
|
|---|---|---|---|
| 2025 | £455,635 | - |
1,787 Properties |
| 2024 | £455,633 | -3% |
2,553 Properties |
| 2023 | £468,234 | -1% |
2,195 Properties |
| 2022 | £475,037 | 7% |
3,061 Properties |
| 2021 | £442,489 | 5% |
4,029 Properties |
| 2020 | £420,167 | 6% |
2,449 Properties |
| 2019 | £395,477 | 1% |
2,728 Properties |
| 2018 | £393,087 | 1% |
2,855 Properties |
| 2017 | £389,728 | 6% |
3,161 Properties |
| 2016 | £367,823 | 9% |
3,668 Properties |
| 2015 | £333,731 | 5% |
3,713 Properties |
| 2014 | £316,251 | 10% |
3,812 Properties |
| 2013 | £283,465 | 3% |
3,191 Properties |
| 2012 | £275,191 | 3% |
2,748 Properties |
| 2011 | £267,310 | -1% |
2,841 Properties |
| 2010 | £270,375 | 13% |
2,929 Properties |
| 2009 | £234,224 | -14% |
2,659 Properties |
| 2008 | £266,115 | 4% |
2,283 Properties |
| 2007 | £255,575 | 9% |
4,923 Properties |
| 2006 | £232,021 | 8% |
5,309 Properties |
| 2005 | £214,168 | 7% |
4,175 Properties |
| 2004 | £199,921 | 6% |
4,744 Properties |
| 2003 | £187,968 | 12% |
4,828 Properties |
| 2002 | £165,418 | 15% |
5,511 Properties |
| 2001 | £140,088 | 18% |
5,445 Properties |
| 2000 | £115,219 | 19% |
4,919 Properties |
| 1999 | £93,903 | 17% |
5,703 Properties |
| 1998 | £78,209 | 11% |
4,966 Properties |
| 1997 | £69,957 | 11% |
5,012 Properties |
| 1996 | £62,106 | 6% |
4,462 Properties |
| 1995 | £58,354 | - |
3,464 Properties |
Property Price per Property Type in Brighton
Here you can find historic sold price data in order to help with your property search.
The average Property Paid Price for specific property types in the last three years are:
| Property Type | Average Sold Price | Sold Properties |
|---|---|---|
| Semi Detached House | £498,841.00 | 1,136 Semi Detached Houses |
| Terraced House | £536,753.00 | 2,143 Terraced Houses |
| Detached House | £691,943.00 | 716 Detached Houses |
| Flat | £312,146.00 | 2,540 Flats |