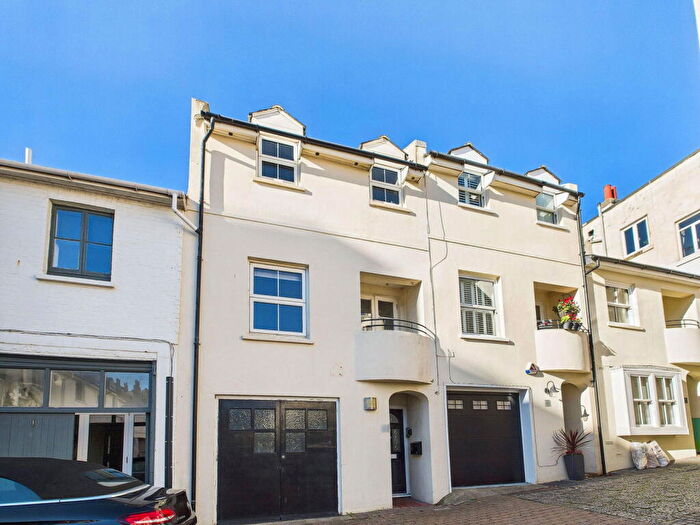
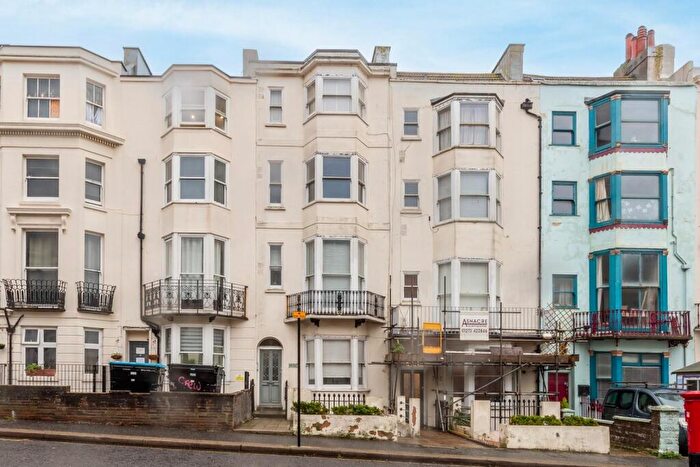
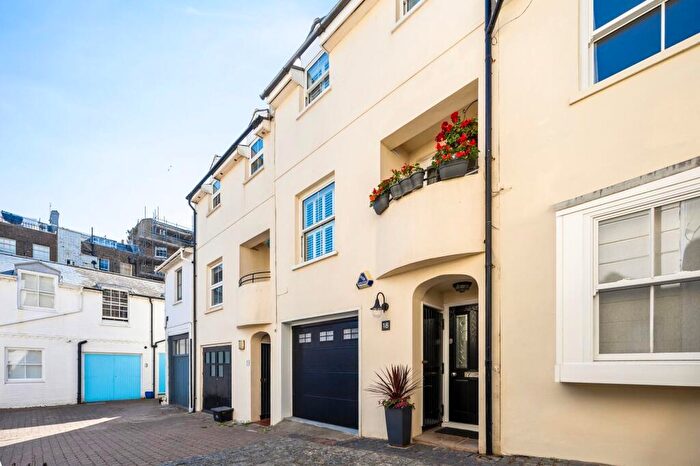
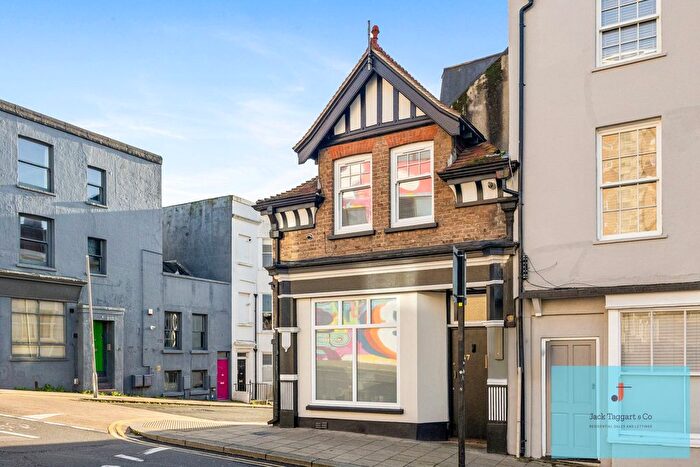
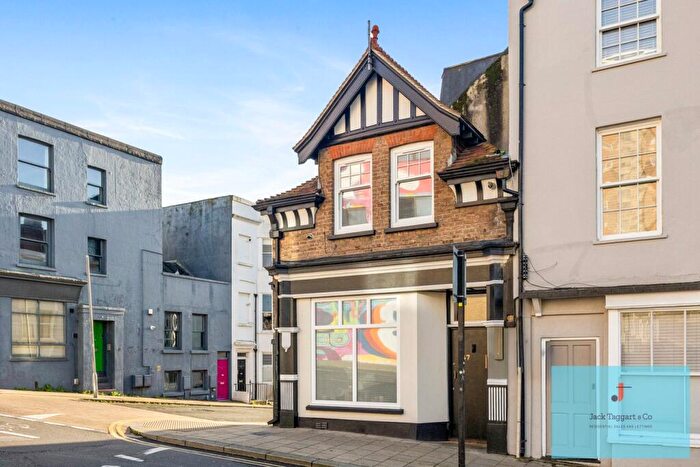
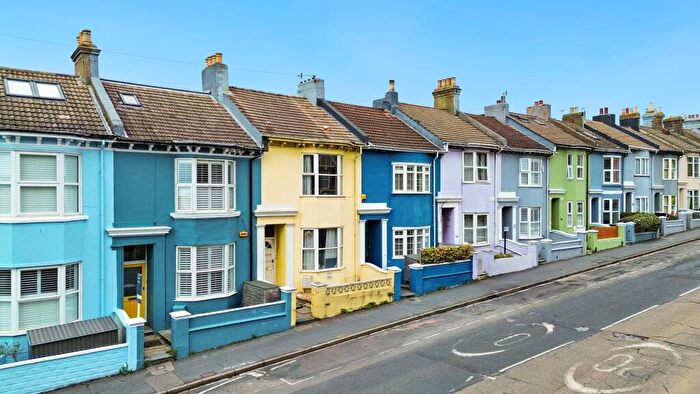
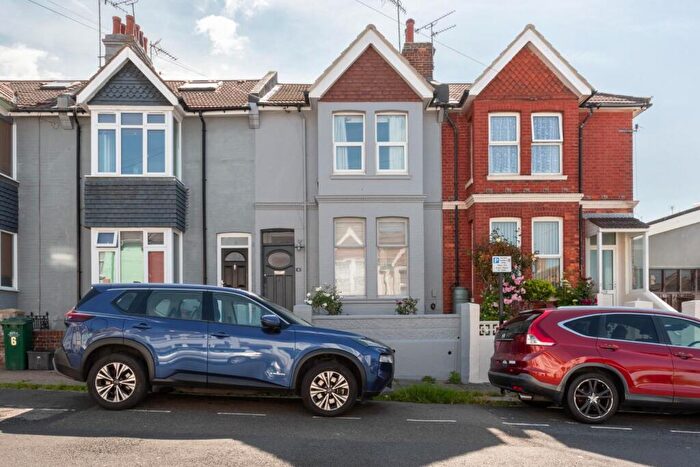
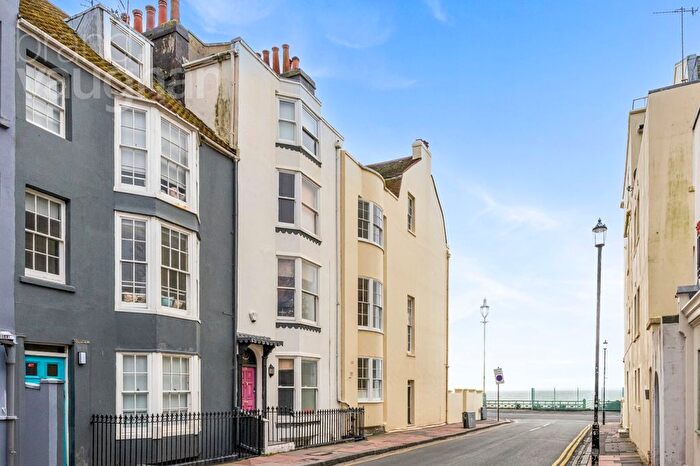
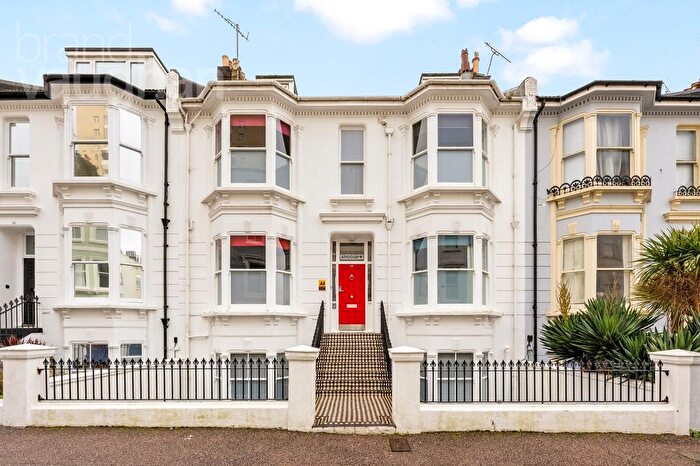
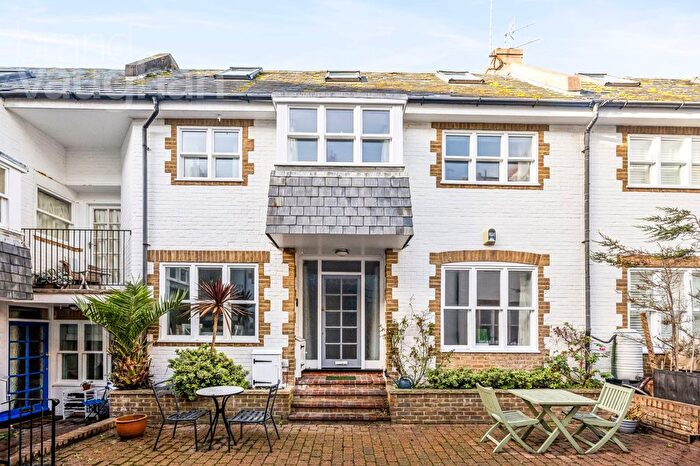
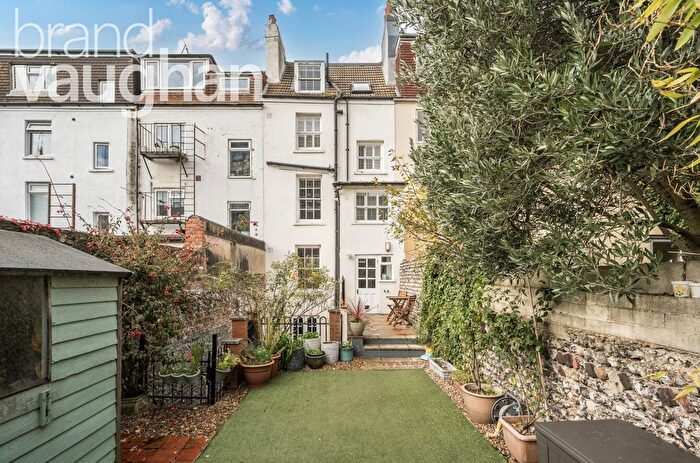
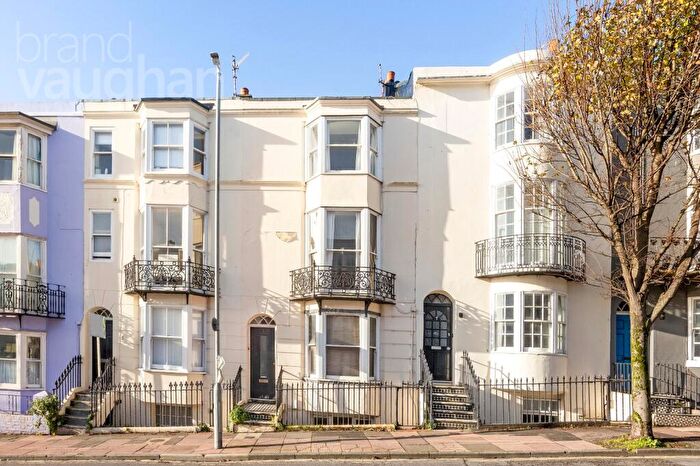
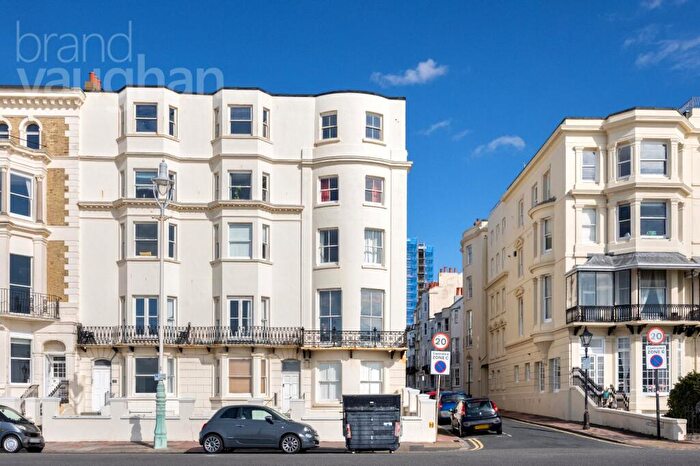
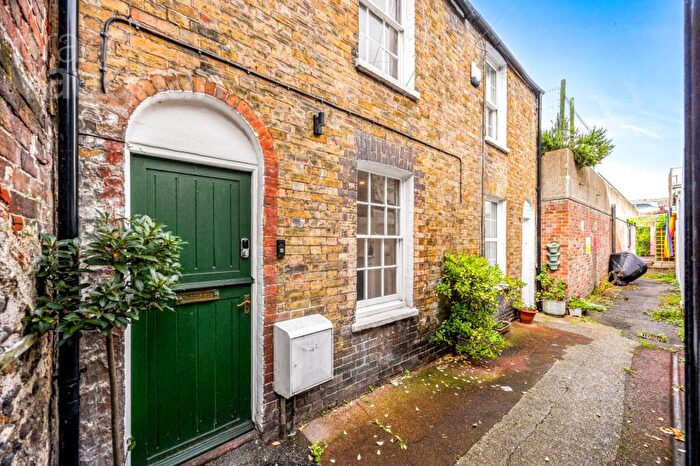
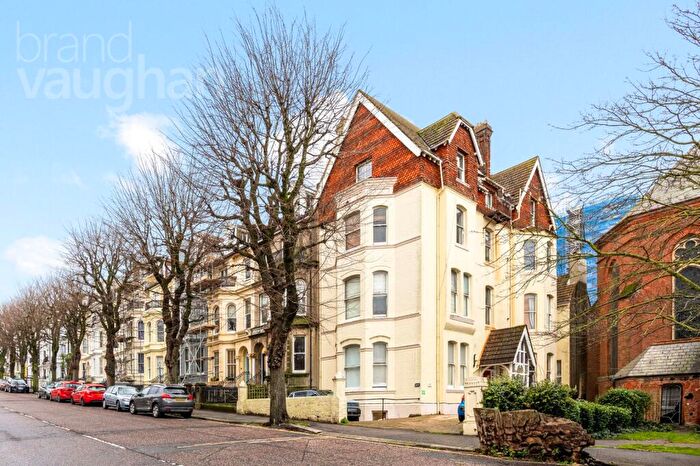
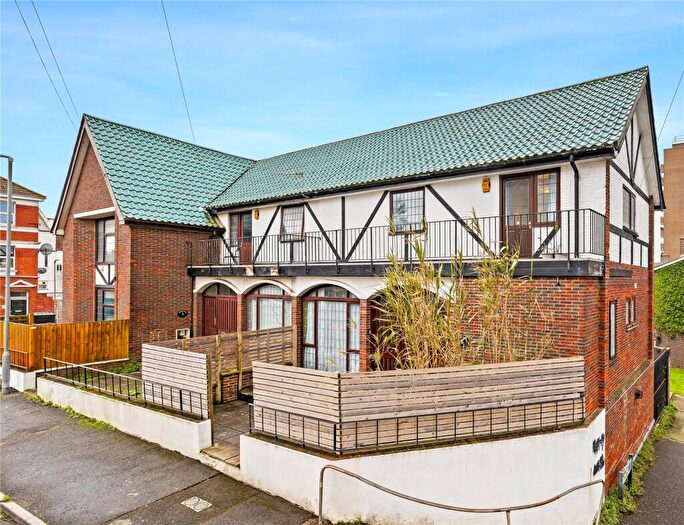
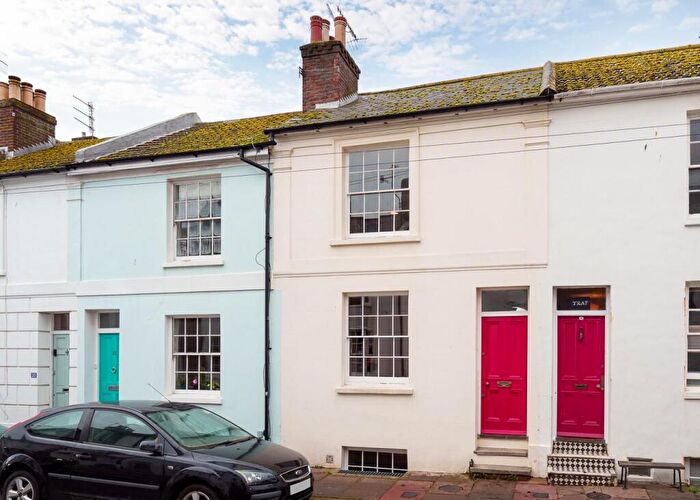
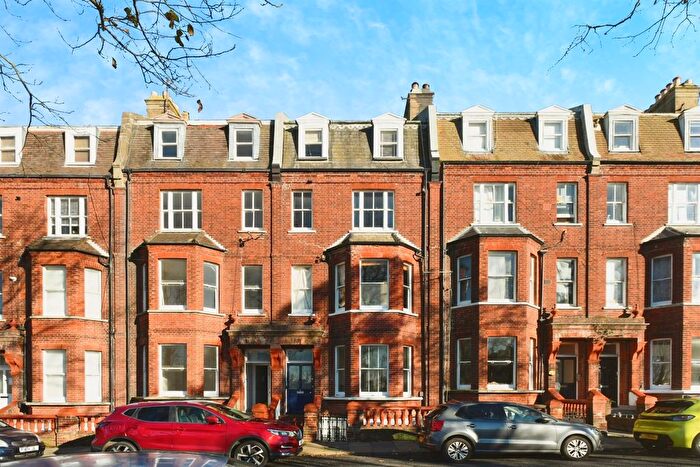
Houses for sale & to rent in Queens Park, Brighton
House Prices in Queens Park
Properties in Queens Park have an average house price of £410,689.42 and had 742 Property Transactions within the last 3 years¹.
Queens Park is an area in Brighton, The City of Brighton and Hove with 8,013 households², where the most expensive property was sold for £2,850,000.00.
Properties for sale in Queens Park
Roads and Postcodes in Queens Park
Navigate through our locations to find the location of your next house in Queens Park, Brighton for sale or to rent.
| Streets | Postcodes |
|---|---|
| Albion Hill | BN2 9NN BN2 9NX BN2 9PA |
| Albion Street | BN2 9NE BN2 9PN BN2 9AJ BN2 9PP BN2 9PS |
| Ardingly Street | BN2 1SS |
| Ashton Rise | BN2 9QP BN2 9QQ BN2 9QR BN2 9RD BN2 9AA BN2 9RE |
| Atlingworth Street | BN2 1PL |
| Attree Drive | BN2 0HN |
| Barnfield Gardens | BN2 0HQ |
| Barry Walk | BN2 0HP |
| Bedford Street | BN2 1AN |
| Blaker Street | BN2 0JJ |
| Bloomsbury Place | BN2 1DA |
| Bristol Road | BN2 1AP |
| Broad Street | BN2 1TJ |
| Burlington Street | BN2 1AA BN2 1AU |
| Bute Street | BN2 0EH |
| Camelford Street | BN2 1TQ BN2 1WQ |
| Canning Street | BN2 0EF |
| Carlton Hill | BN2 0GW BN2 0HA BN2 0DA BN2 0GX BN2 0HF |
| Carlton Place | BN2 0GZ |
| Cavendish Street | BN2 1RN |
| Chapel Street | BN2 1RQ BN2 1SN |
| Charles Street | BN2 1TG |
| Charlotte Street | BN2 1AG |
| Circus Street | BN2 9QF BN2 9AN BN2 9AS BN2 9AL |
| Clarendon Place | BN2 1JD |
| College Place | BN2 1HN |
| College Road | BN2 1JA BN2 1JB |
| College Street | BN2 1JG |
| College Terrace | BN2 0EE BN2 0EX |
| Crescent Place | BN2 1AS |
| Cuthbert Road | BN2 0EN |
| Dawson Terrace | BN2 0EL BN2 0ER |
| Devonshire Place | BN2 1QA BN2 1QB BN2 1QH BN2 1QJ |
| Dolphin Mews | BN2 1TY |
| Dorset Gardens | BN2 1RL BN2 1GS BN2 1SA |
| Dorset Mews | BN2 1WD |
| Dorset Place | BN2 1ST |
| Dorset Street | BN2 1WA |
| Down Terrace | BN2 9ZH |
| East Drive | BN2 0BQ BN2 0BU |
| Eastern Road | BN2 0AJ BN2 0BF BN2 1JQ BN2 0AL |
| Edward Street | BN2 0BB BN2 0JB BN2 0JG BN2 0JL BN2 0JR BN2 0BA BN2 0JD BN2 0LG BN2 0LN |
| Egremont Place | BN2 0GA BN2 0GB |
| Elmore Road | BN2 9QS BN2 9RS |
| Essex Place | BN2 1LB BN2 1LL |
| Essex Street | BN2 1JW |
| Evelyn Terrace | BN2 0EP |
| Freshfield Industrial Estate | BN2 0DF |
| Freshfield Place | BN2 0BN |
| Freshfield Road | BN2 0BJ BN2 0BL BN2 0BR BN2 9YD BN2 9YE |
| Freshfield Street | BN2 9ZG |
| Freshfield Way | BN2 0LE |
| George Street | BN2 1RH BN2 1RJ BN2 1RX |
| Grafton Street | BN2 1AQ |
| Grand Parade | BN2 9JA BN2 9QA BN2 9QB BN2 0JY BN2 9TS BN2 9WY |
| Grand Parade Mews | BN2 9RU |
| Grosvenor Street | BN2 0JQ |
| Grove Bank | BN2 9NF |
| Grove Hill | BN2 9NG BN2 9NJ BN2 9NL |
| Hampshire Court | BN2 1JF BN2 1JZ BN2 1LN |
| Hendon Street | BN2 0EG |
| Hereford Street | BN2 1JT BN2 1LF BN2 1LQ |
| High Street | BN2 1QY BN2 1RP BN2 1RW BN2 1SR BN2 1SU |
| Ivory Place | BN2 9AB BN2 9QE |
| John Street | BN2 9JS BN2 9PJ BN2 9PL BN2 9RB BN2 0LA |
| Kingswood Street | BN2 9QG BN2 9QH BN2 9AQ |
| Lavender Street | BN2 1LE BN2 1LH BN2 1JU BN2 1LG |
| Lee Bank | BN2 9NH |
| Leicester Street | BN2 0AZ |
| Lennox Street | BN2 0GS BN2 0HD |
| Little George Street | BN2 1RR |
| Lower Rock Gardens | BN2 1PG |
| Madeira Drive | BN2 1AY BN2 1ET BN2 1PS BN2 1TB BN2 1TW |
| Madeira Place | BN2 1TN |
| Manchester Street | BN2 1TF |
| Margaret Street | BN2 1TS |
| Marine Gardens | BN2 1AH |
| Marine Parade | BN2 1AB BN2 1AD BN2 1AE BN2 1AJ BN2 1AT BN2 1AX BN2 1AZ BN2 1PE BN2 1PH BN2 1PN BN2 1TL BN2 1TR BN2 1TX BN2 1WP BN2 1TA |
| Marine Terrace Mews | BN2 1AR |
| Marine View | BN2 0HG BN2 0HH |
| Mighell Street | BN2 0JF |
| Montague Place | BN2 1JE |
| Montague Street | BN2 1JX BN2 1NQ |
| Morley Street | BN2 9DH BN2 9RA |
| Mount Pleasant | BN2 0JN BN2 0JP BN2 0JU BN2 0JX |
| Nelson Row | BN2 9AH |
| New Steine | BN2 1PB BN2 1PD |
| New Steine Mews | BN2 1QP |
| North Drive | BN2 0HR |
| Old Steine | BN1 1EJ BN1 1EL BN1 1EN BN1 1FL |
| Olivier Close | BN2 0DY |
| Park Hill | BN2 0BT |
| Park Road Terrace | BN2 0GT BN2 0HB |
| Park Street | BN2 0AQ BN2 0BS BN2 0DE BN2 0DG BN2 0DJ |
| Parochial Mews | BN2 1WF |
| Parochial Terrace | BN2 1WH |
| Pavilion Parade | BN2 1RA BN2 1RY |
| Princes Street | BN2 1RD BN2 1WE |
| Queens Park Mews | BN2 9YY |
| Queens Park Rise | BN2 9ZF |
| Queens Park Road | BN2 0GG BN2 0GJ BN2 0GL BN2 9ZB |
| Queens Park Terrace | BN2 9YA BN2 9YB |
| Richmond Gardens | BN2 9PF |
| Richmond Parade | BN2 9QD BN2 9GB BN2 9PH |
| Richmond Place | BN2 9NA BN2 9LT |
| Richmond Street | BN2 9PD BN2 9PE |
| Rochester Street | BN2 0EJ |
| Rock Place | BN2 1PF |
| Royal Crescent | BN2 1AL |
| Royal Crescent Mews | BN2 1AW |
| Somerset Street | BN2 1HY BN2 1GW BN2 1GX BN2 1JS BN2 1LT |
| South Avenue | BN2 0BP |
| Southdown Mews | BN2 0TG |
| St Georges Road | BN2 1EA BN2 1EB BN2 1EU |
| St Georges Terrace | BN2 1JH BN2 1JJ |
| St James's Avenue | BN2 1QD |
| St James's Place | BN2 1RS |
| St James's Street | BN2 1PR BN2 1RU BN2 1SQ BN2 1PA BN2 1PJ BN2 1QG BN2 1RB BN2 1RE BN2 1RF BN2 1RG BN2 1TH BN2 1TP |
| St James's Street Mews | BN2 1RT |
| St Jamess Gardens | BN2 1RZ |
| St Johns Mews | BN2 1BD |
| St Johns Place | BN2 0GR |
| St Lukes Road | BN2 9ZD |
| St Lukes Terrace | BN2 9ZE |
| Stanley Street | BN2 0GP |
| Steine Gardens | BN2 1WB |
| Steine Street | BN2 1TE |
| Sussex Place | BN2 9QN |
| Sussex Street | BN2 0GQ BN2 9QW BN2 9RR BN2 0AR BN2 0HL BN2 9HS |
| Sussex Terrace | BN2 9QJ |
| Sutherland Road | BN2 0EQ |
| Tarner Road | BN2 9QT |
| Telegraph Street | BN2 1LA |
| Terrace Row | BN2 1SF |
| Thames Close | BN2 0JT |
| The Graperies | BN2 0BW |
| Tilbury Place | BN2 0GY BN2 0RQ |
| Tilbury Way | BN2 9QU |
| Tillstone Street | BN2 0BD |
| Tower Road | BN2 0FZ BN2 0GF |
| Upper Bedford Street | BN2 1JP |
| Upper Park Place | BN2 0GU BN2 0HE |
| Upper Rock Gardens | BN2 1QE BN2 1QF |
| Upper St Jamess Street | BN2 1JN |
| Walpole Terrace | BN2 0EB BN2 0ED |
| Warwick Mount | BN2 1JY |
| Wentworth Street | BN2 1TT |
| West Drive | BN2 0GD BN2 0GE BN2 0QU |
| White Street | BN2 0JH |
| William Street | BN2 0BG BN2 0RF |
| Windmill Street | BN2 0GN |
| Windmill Terrace | BN2 9NZ |
| Wyndham Street | BN2 1AF |
| BN1 1FZ BN2 0JW |
Transport near Queens Park
-
Brighton Station
-
London Road Brighton Station
-
Moulsecoomb Station
-
Preston Park Station
-
Hove Station
-
Aldrington Station
- FAQ
- Price Paid By Year
- Property Type Price
Frequently asked questions about Queens Park
What is the average price for a property for sale in Queens Park?
The average price for a property for sale in Queens Park is £410,689. This amount is 12% lower than the average price in Brighton. There are 4,940 property listings for sale in Queens Park.
What streets have the most expensive properties for sale in Queens Park?
The streets with the most expensive properties for sale in Queens Park are Bristol Road at an average of £1,228,950, West Drive at an average of £1,167,321 and Crescent Place at an average of £1,060,000.
What streets have the most affordable properties for sale in Queens Park?
The streets with the most affordable properties for sale in Queens Park are Eastern Road at an average of £134,080, Grand Parade Mews at an average of £203,333 and Charlotte Street at an average of £205,585.
Which train stations are available in or near Queens Park?
Some of the train stations available in or near Queens Park are Brighton, London Road Brighton and Moulsecoomb.
Property Price Paid in Queens Park by Year
The average sold property price by year was:
| Year | Average Sold Price | Price Change |
Sold Properties
|
|---|---|---|---|
| 2025 | £458,587.81 | 11% |
134 Properties |
| 2024 | £408,931.75 | -3% |
183 Properties |
| 2023 | £422,968.82 | 10% |
170 Properties |
| 2022 | £380,006.08 | -4% |
259 Properties |
| 2021 | £396,681.71 | 2% |
326 Properties |
| 2020 | £390,417.95 | -0,1% |
184 Properties |
| 2019 | £390,681.24 | 7% |
220 Properties |
| 2018 | £365,230.12 | 2% |
244 Properties |
| 2017 | £358,195 | -3% |
262 Properties |
| 2016 | £367,355.52 | 12% |
304 Properties |
| 2015 | £322,710.7 | 11% |
314 Properties |
| 2014 | £286,981.48 | 5% |
306 Properties |
| 2013 | £271,886 | 0,4% |
271 Properties |
| 2012 | £270,816 | 5% |
244 Properties |
| 2011 | £256,377.16 | -5% |
228 Properties |
| 2010 | £269,698 | 13% |
266 Properties |
| 2009 | £234,319 | -16% |
225 Properties |
| 2008 | £272,763 | 8% |
209 Properties |
| 2007 | £250,162 | 11% |
464 Properties |
| 2006 | £221,477 | 9% |
484 Properties |
| 2005 | £201,061 | 3% |
376 Properties |
| 2004 | £195,150 | 5% |
445 Properties |
| 2003 | £185,444 | 11% |
441 Properties |
| 2002 | £165,579.07 | 11% |
528 Properties |
| 2001 | £147,252.33 | 24% |
530 Properties |
| 2000 | £112,479 | 24% |
478 Properties |
| 1999 | £85,347.76 | 16% |
494 Properties |
| 1998 | £71,682 | 12% |
412 Properties |
| 1997 | £62,793.17 | 16% |
405 Properties |
| 1996 | £52,915 | 2% |
349 Properties |
| 1995 | £51,606 | - |
252 Properties |
Property Price per Property Type in Queens Park
Here you can find historic sold price data in order to help with your property search.
The average Property Paid Price for specific property types in the last three years are:
| Property Type | Average Sold Price | Sold Properties |
|---|---|---|
| Flat | £296,043.11 | 505 Flats |
| Semi Detached House | £867,548.00 | 27 Semi Detached Houses |
| Detached House | £1,054,875.00 | 8 Detached Houses |
| Terraced House | £610,727.00 | 202 Terraced Houses |

