
Houses for sale & to rent in Central Hove, Hove
House Prices in Central Hove
Properties in Central Hove have an average house price of £454,768.00 and had 842 Property Transactions within the last 3 years¹.
Central Hove is an area in Hove, The City of Brighton and Hove with 5,397 households², where the most expensive property was sold for £7,500,000.00.
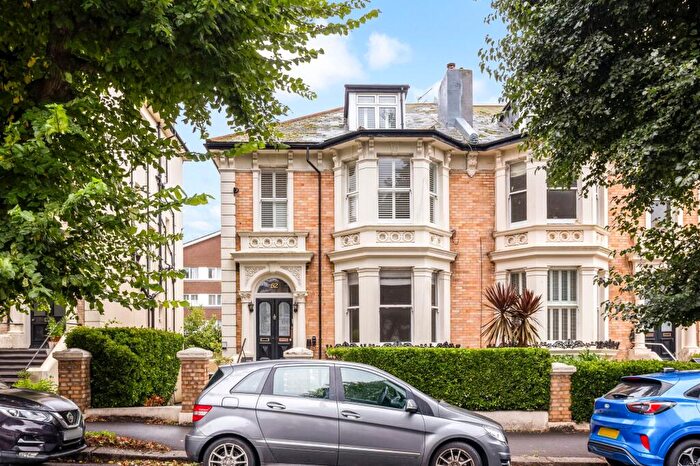
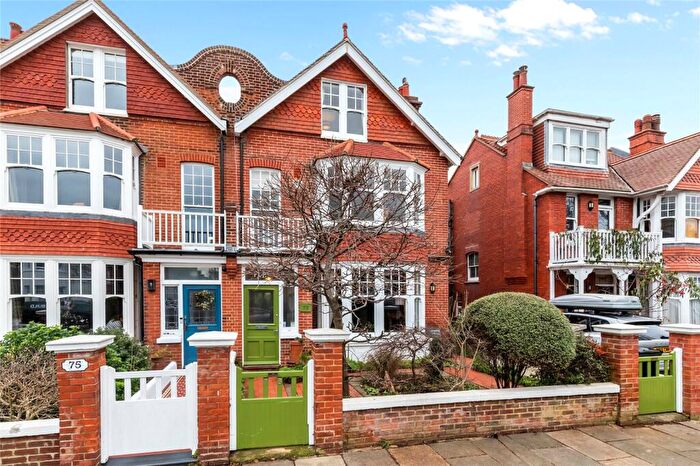
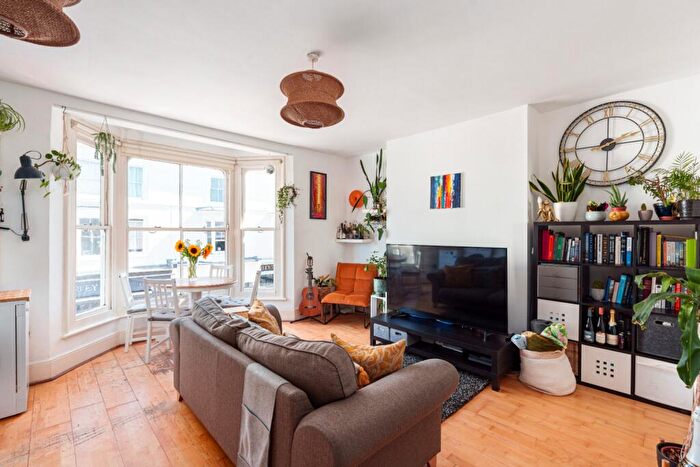
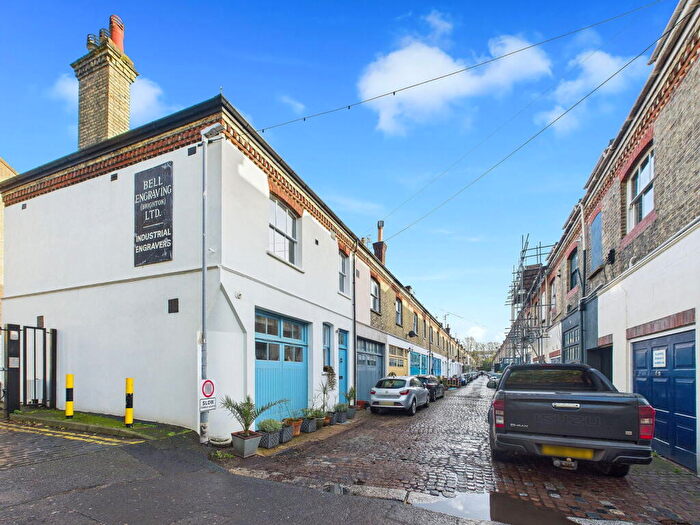
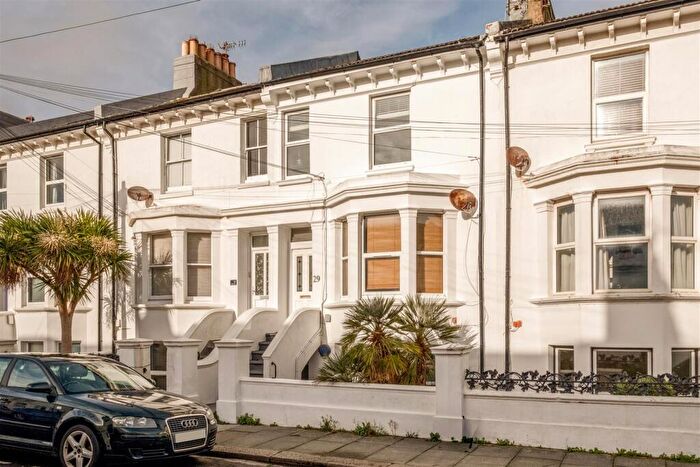
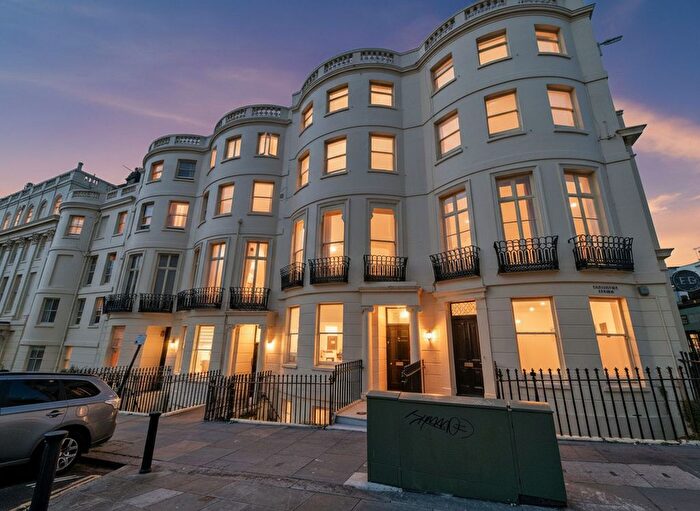
Properties for sale in Central Hove
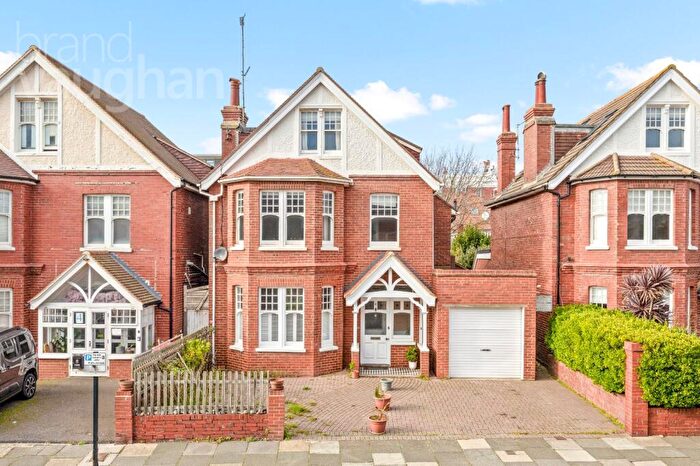


![]()
If you are looking to sell your house, let it out, or receive a property valuation, an expert can help you.
Click the button below to get started.


Roads and Postcodes in Central Hove
Navigate through our locations to find the location of your next house in Central Hove, Hove for sale or to rent.
Transport near Central Hove
-
 Hove Station
 -
Aldrington Station
-
Brighton Station
-
Preston Park Station
-
Portslade Station
-
London Road Brighton Station
-
Fishersgate Station
-
Moulsecoomb Station
-
Southwick Station
- FAQ
- Price Paid By Year
- Property Type Price
Frequently asked questions about Central Hove
What is the average price for a property for sale in Central Hove?
The average price for a property for sale in Central Hove is £454,768. This amount is 16% lower than the average price in Hove. There are 5,587 property listings for sale in Central Hove.
What streets have the most expensive properties for sale in Central Hove?
The streets with the most expensive properties for sale in Central Hove are Courtenay Terrace at an average of £1,422,350, Medina Terrace at an average of £1,320,560 and Vallance Gardens at an average of £837,916.
What streets have the most affordable properties for sale in Central Hove?
The streets with the most affordable properties for sale in Central Hove are Kingsway at an average of £195,812, Blatchington Road at an average of £265,964 and St Aubyns Gardens at an average of £268,095.
Which train stations are available in or near Central Hove?
Some of the train stations available in or near Central Hove are Hove, Aldrington and Brighton.
Property Price Paid in Central Hove by Year
The average sold property price by year was:
| Year | Average Sold Price | Price Change |
Sold Properties
|
|---|---|---|---|
| 2025 | £432,710 | 1% |
127 Properties |
| 2024 | £426,249 | -15% |
235 Properties |
| 2023 | £489,184 | 5% |
199 Properties |
| 2022 | £464,216 | 13% |
281 Properties |
| 2021 | £403,186 | 3% |
337 Properties |
| 2020 | £389,804 | 4% |
213 Properties |
| 2019 | £372,296 | -2% |
211 Properties |
| 2018 | £379,702 | -1% |
242 Properties |
| 2017 | £382,017 | 7% |
257 Properties |
| 2016 | £353,444 | 7% |
278 Properties |
| 2015 | £328,057 | 8% |
307 Properties |
| 2014 | £302,928 | 6% |
293 Properties |
| 2013 | £285,248 | 4% |
249 Properties |
| 2012 | £274,987 | 9% |
265 Properties |
| 2011 | £251,143 | -10% |
255 Properties |
| 2010 | £275,713 | 14% |
234 Properties |
| 2009 | £236,103 | -7% |
209 Properties |
| 2008 | £252,150 | 2% |
182 Properties |
| 2007 | £246,771 | 14% |
422 Properties |
| 2006 | £213,295 | 8% |
436 Properties |
| 2005 | £195,593 | 5% |
389 Properties |
| 2004 | £185,299 | 7% |
422 Properties |
| 2003 | £173,105 | 7% |
384 Properties |
| 2002 | £161,656 | 22% |
447 Properties |
| 2001 | £126,538 | 11% |
446 Properties |
| 2000 | £112,692 | 24% |
482 Properties |
| 1999 | £85,502 | 15% |
483 Properties |
| 1998 | £72,587 | 17% |
437 Properties |
| 1997 | £60,300 | 7% |
463 Properties |
| 1996 | £56,104 | 9% |
379 Properties |
| 1995 | £50,977 | - |
276 Properties |
Property Price per Property Type in Central Hove
Here you can find historic sold price data in order to help with your property search.
The average Property Paid Price for specific property types in the last three years are:
| Property Type | Average Sold Price | Sold Properties |
|---|---|---|
| Flat | £386,230.00 | 742 Flats |
| Semi Detached House | £1,009,416.00 | 18 Semi Detached Houses |
| Detached House | £1,200,000.00 | 10 Detached Houses |
| Terraced House | £918,928.00 | 72 Terraced Houses |