
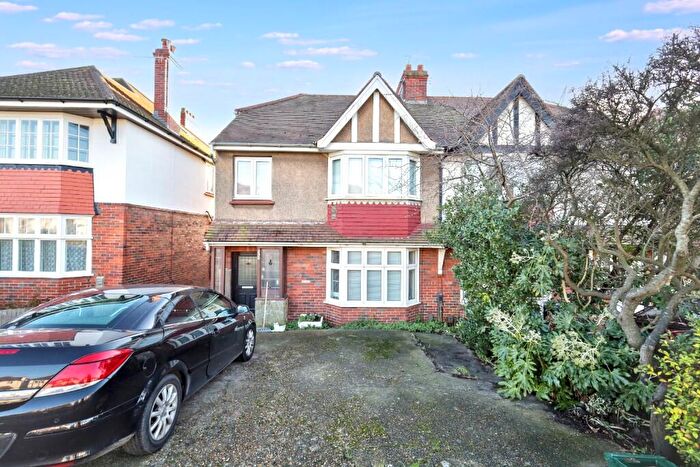
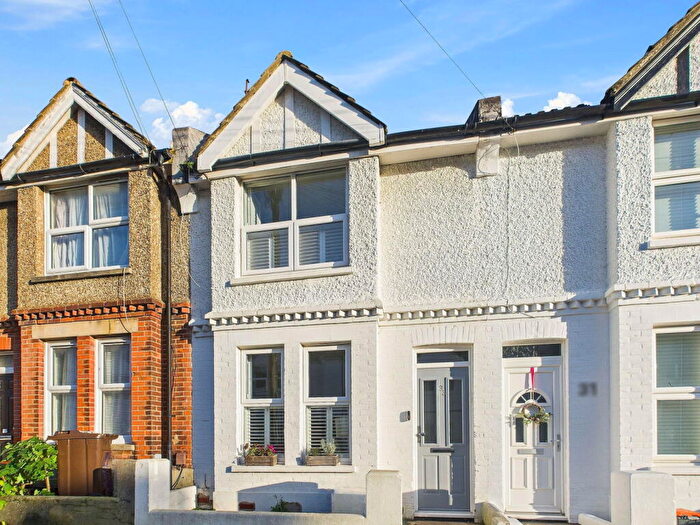
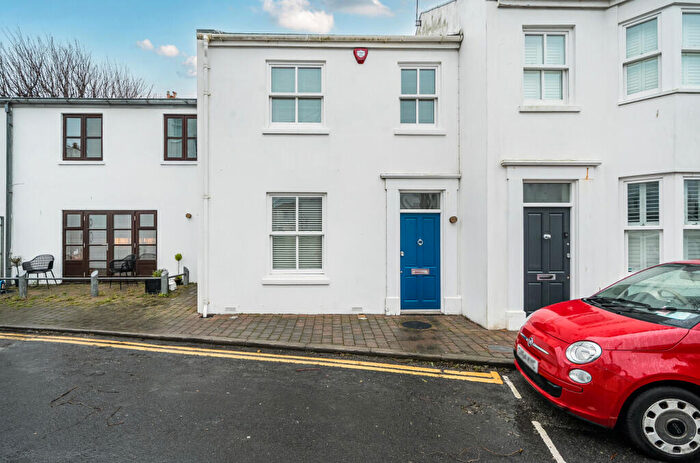
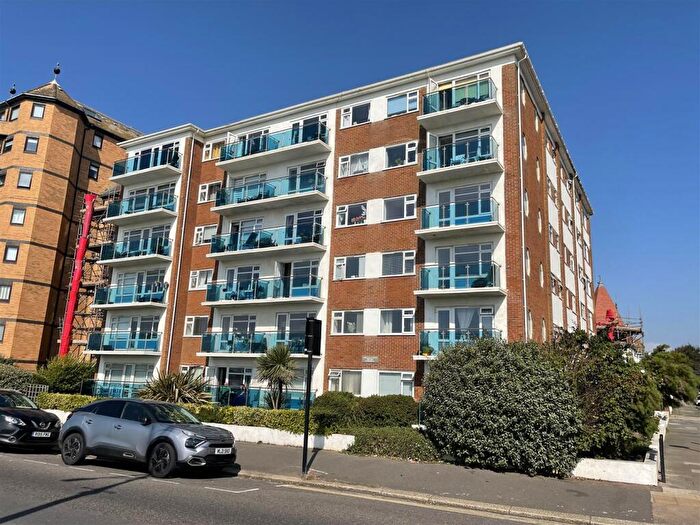
Houses for sale & to rent in Westbourne, Hove
House Prices in Westbourne
Properties in Westbourne have an average house price of £575,983.00 and had 703 Property Transactions within the last 3 years¹.
Westbourne is an area in Hove, The City of Brighton and Hove with 4,608 households², where the most expensive property was sold for £2,795,000.00.
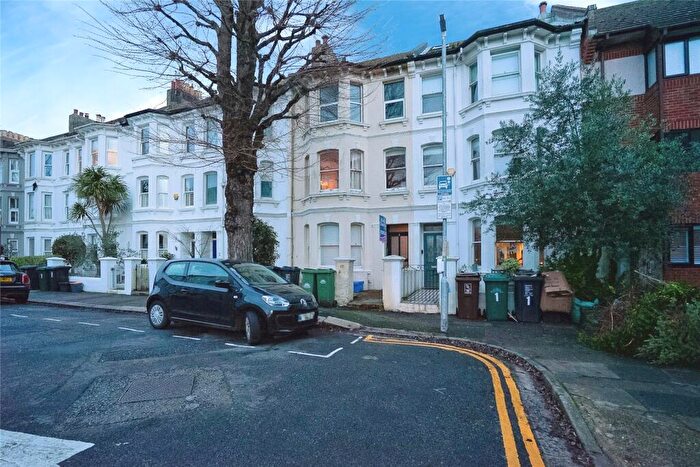
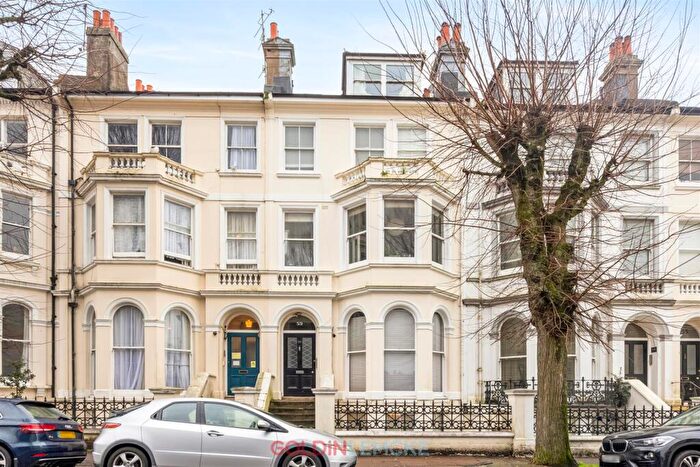
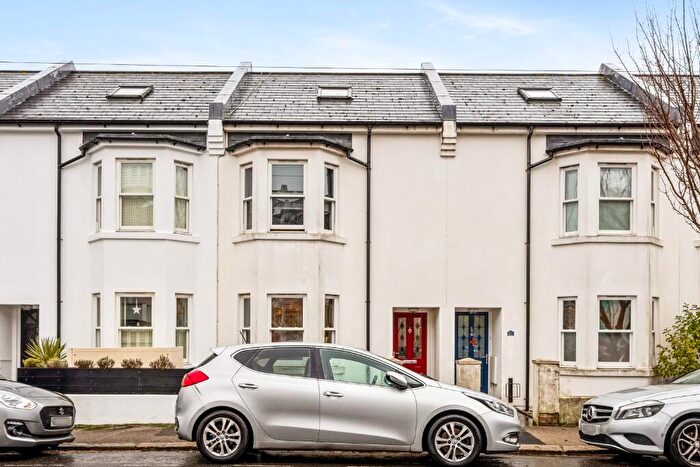
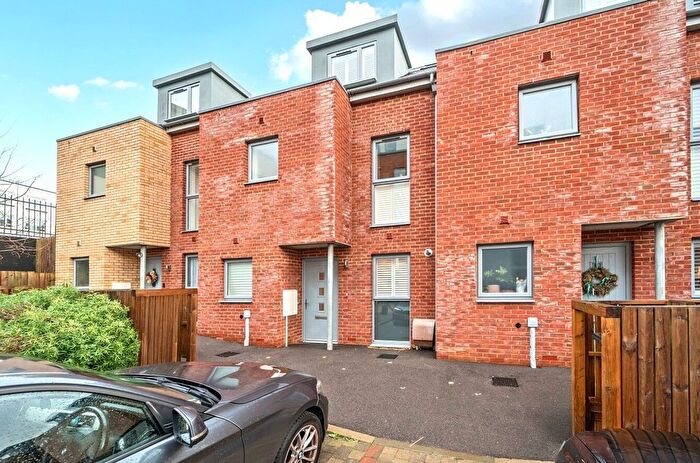
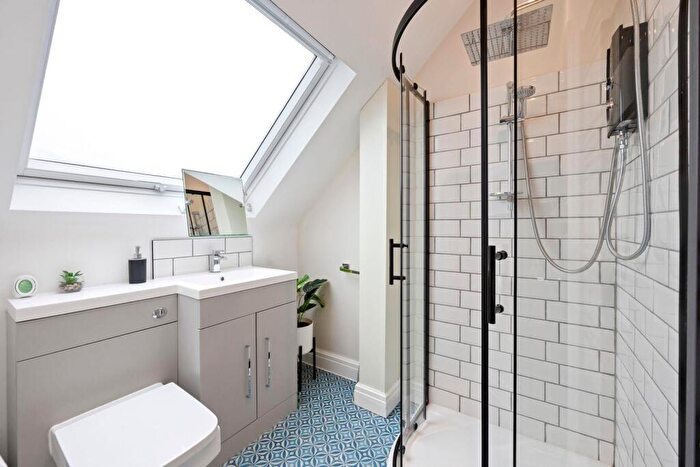
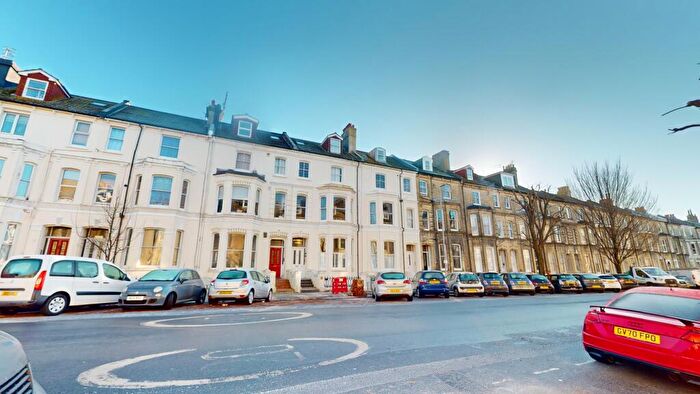
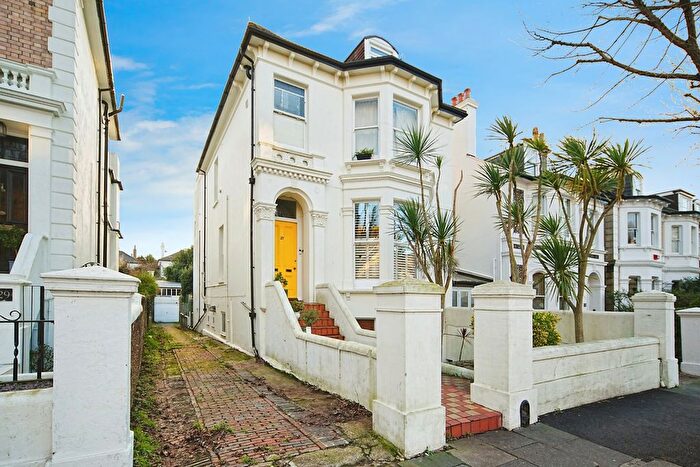
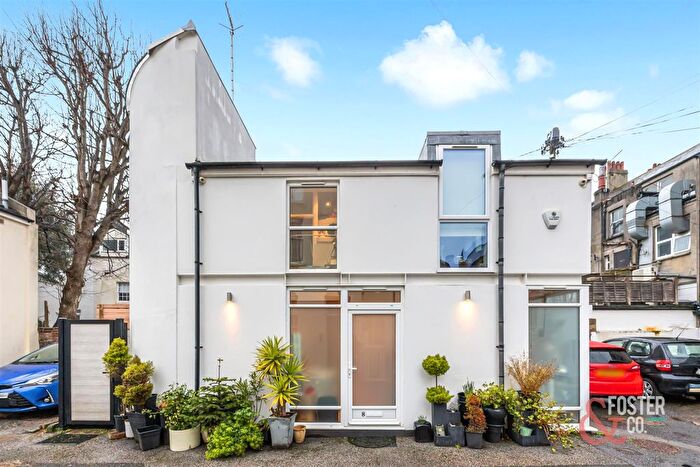
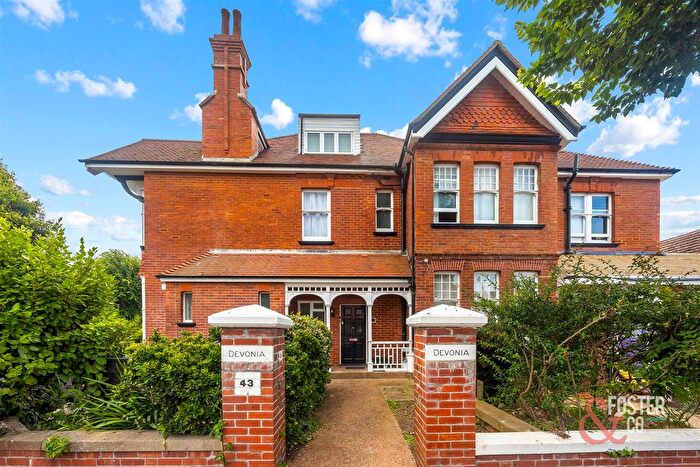
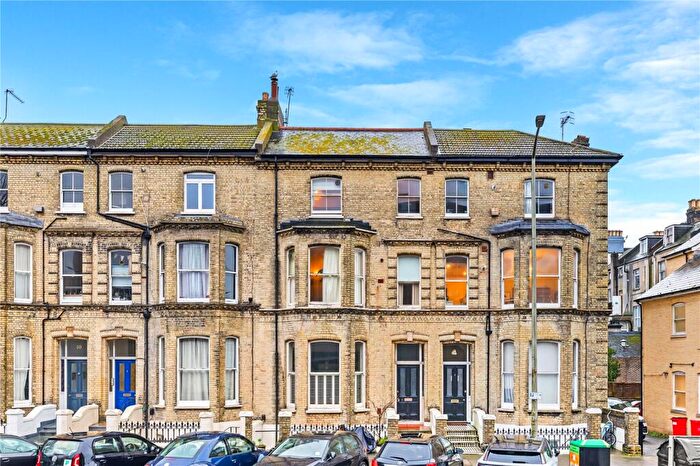
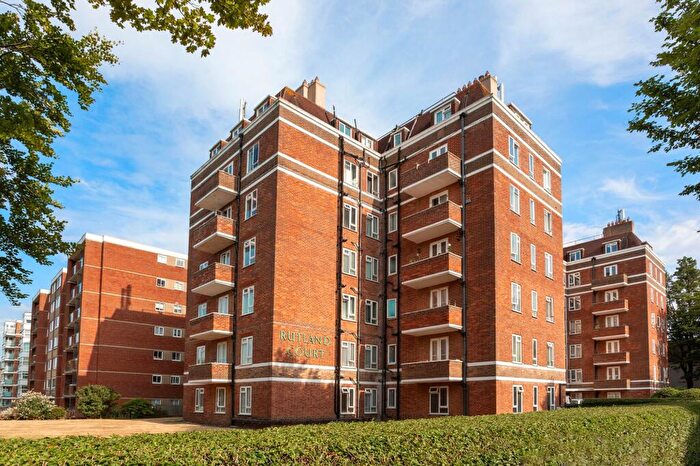
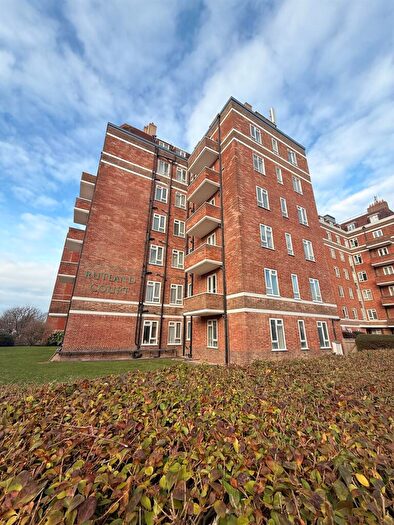
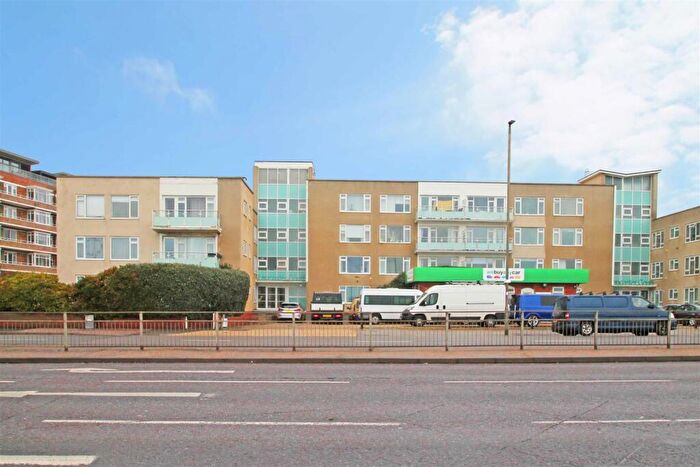
Properties for sale in Westbourne

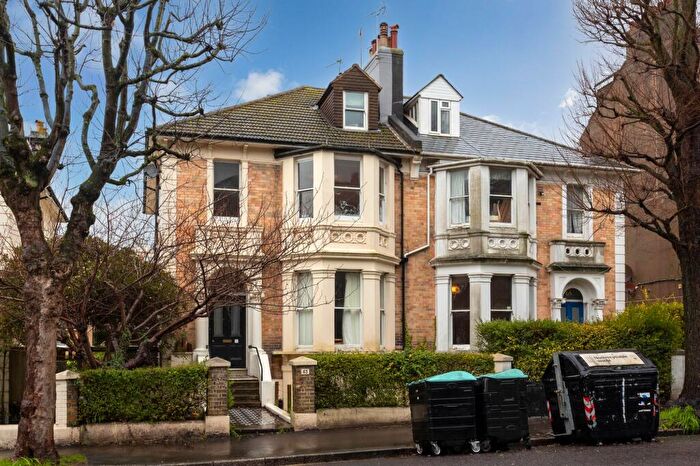
![]()
If you are looking to sell your house, let it out, or receive a property valuation, an expert can help you.
Click the button below to get started.

Roads and Postcodes in Westbourne
Navigate through our locations to find the location of your next house in Westbourne, Hove for sale or to rent.
Transport near Westbourne
-
 Aldrington Station
 -
Hove Station
-
Portslade Station
-
Fishersgate Station
-
Preston Park Station
-
Brighton Station
-
London Road Brighton Station
-
Southwick Station
- FAQ
- Price Paid By Year
- Property Type Price
Frequently asked questions about Westbourne
What is the average price for a property for sale in Westbourne?
The average price for a property for sale in Westbourne is £575,983. This amount is 7% higher than the average price in Hove. There are 3,938 property listings for sale in Westbourne.
What streets have the most expensive properties for sale in Westbourne?
The streets with the most expensive properties for sale in Westbourne are Princes Crescent at an average of £2,050,000, Princes Square at an average of £1,987,500 and Pembroke Avenue at an average of £1,264,285.
What streets have the most affordable properties for sale in Westbourne?
The streets with the most affordable properties for sale in Westbourne are Mortimer Mews at an average of £260,000, Pendragon Court at an average of £265,000 and Princes Avenue at an average of £320,000.
Which train stations are available in or near Westbourne?
Some of the train stations available in or near Westbourne are Aldrington, Hove and Portslade.
Property Price Paid in Westbourne by Year
The average sold property price by year was:
| Year | Average Sold Price | Price Change |
Sold Properties
|
|---|---|---|---|
| 2025 | £531,149 | -12% |
102 Properties |
| 2024 | £593,327 | -1% |
206 Properties |
| 2023 | £600,000 | 6% |
166 Properties |
| 2022 | £562,940 | 8% |
229 Properties |
| 2021 | £516,270 | 3% |
281 Properties |
| 2020 | £500,343 | 13% |
172 Properties |
| 2019 | £436,367 | -7% |
201 Properties |
| 2018 | £468,805 | -1% |
200 Properties |
| 2017 | £473,118 | 7% |
211 Properties |
| 2016 | £441,123 | 13% |
247 Properties |
| 2015 | £382,375 | -4% |
258 Properties |
| 2014 | £396,203 | 16% |
285 Properties |
| 2013 | £331,609 | 6% |
253 Properties |
| 2012 | £313,008 | -11% |
218 Properties |
| 2011 | £346,742 | 13% |
208 Properties |
| 2010 | £301,396 | 17% |
196 Properties |
| 2009 | £251,055 | -2% |
226 Properties |
| 2008 | £254,928 | -16% |
162 Properties |
| 2007 | £296,620 | 15% |
331 Properties |
| 2006 | £251,703 | 6% |
335 Properties |
| 2005 | £237,487 | 9% |
303 Properties |
| 2004 | £217,122 | 8% |
334 Properties |
| 2003 | £200,527 | 8% |
378 Properties |
| 2002 | £183,703 | 22% |
422 Properties |
| 2001 | £143,809 | 16% |
388 Properties |
| 2000 | £120,368 | 23% |
368 Properties |
| 1999 | £92,564 | 10% |
392 Properties |
| 1998 | £83,234 | 16% |
379 Properties |
| 1997 | £69,996 | 10% |
381 Properties |
| 1996 | £63,208 | 14% |
299 Properties |
| 1995 | £54,211 | - |
283 Properties |
Property Price per Property Type in Westbourne
Here you can find historic sold price data in order to help with your property search.
The average Property Paid Price for specific property types in the last three years are:
| Property Type | Average Sold Price | Sold Properties |
|---|---|---|
| Semi Detached House | £1,285,214.00 | 60 Semi Detached Houses |
| Detached House | £1,384,750.00 | 44 Detached Houses |
| Terraced House | £652,184.00 | 178 Terraced Houses |
| Flat | £358,160.00 | 421 Flats |