
Houses for sale in Brentwood, Thurrock
House Prices in Brentwood
Properties in Brentwood have no sales history available within the last 3 years.
Brentwood is an area in Thurrock with 19 households².
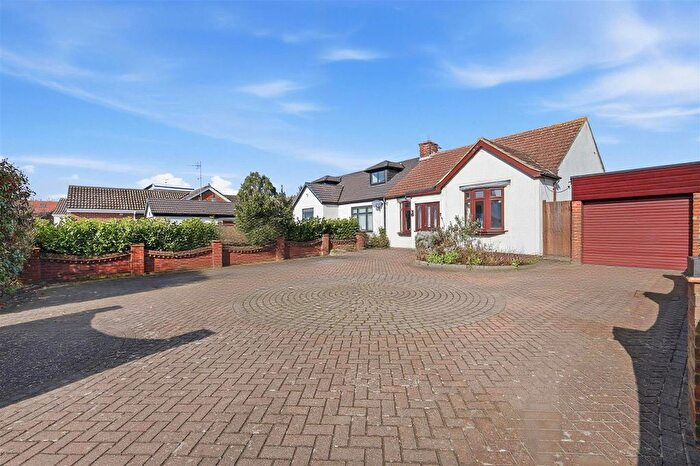
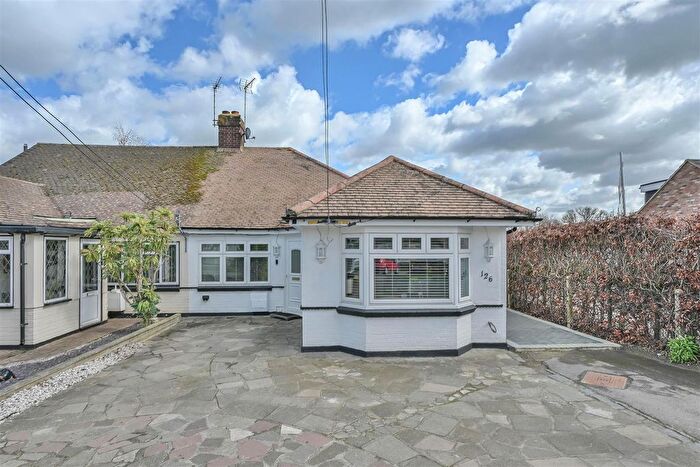
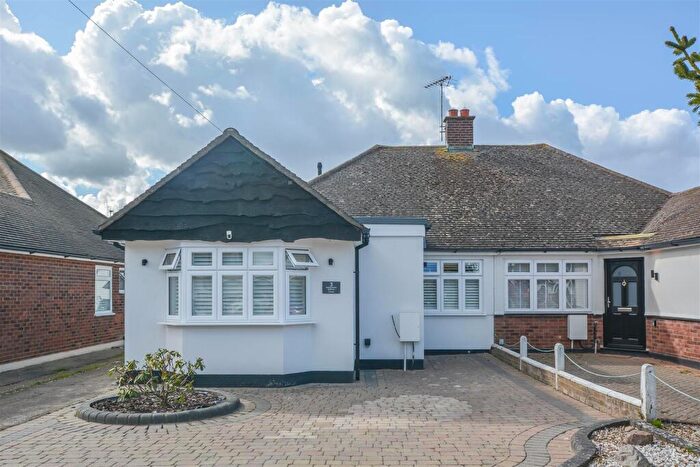
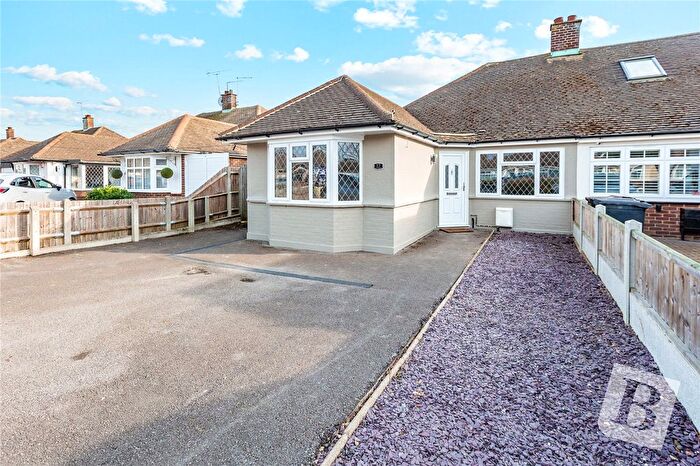
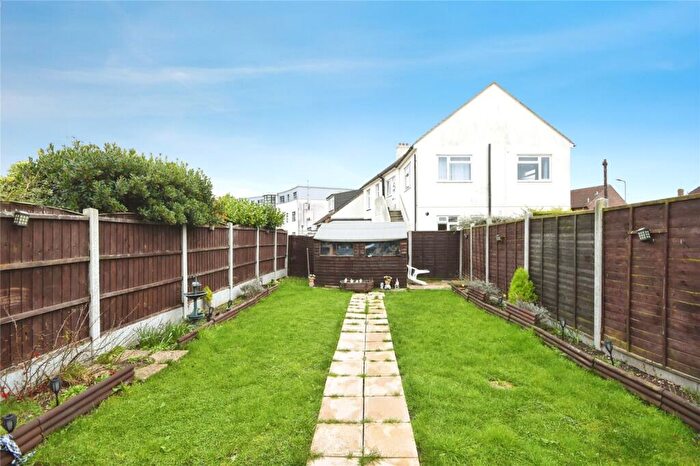
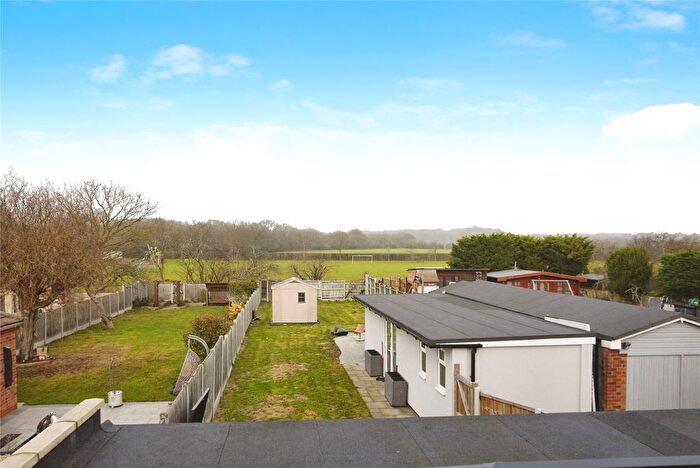
Properties for sale in Brentwood
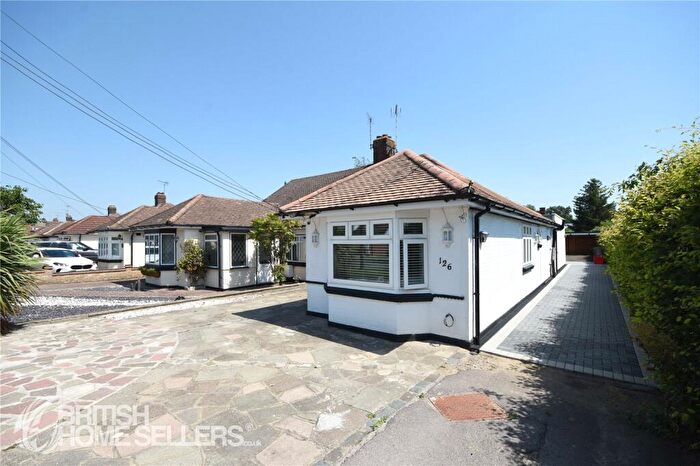
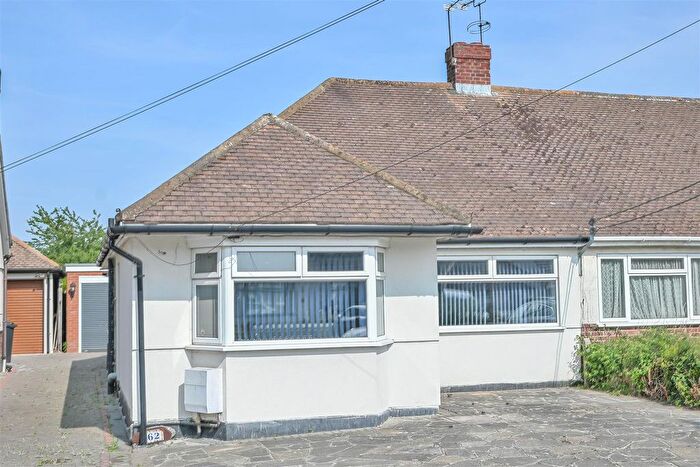
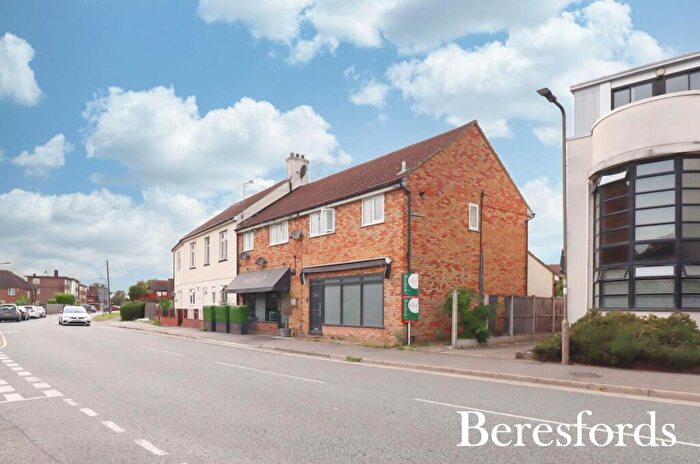
![]()
If you are looking to sell your house, let it out, or receive a property valuation, an expert can help you.
Click the button below to get started.
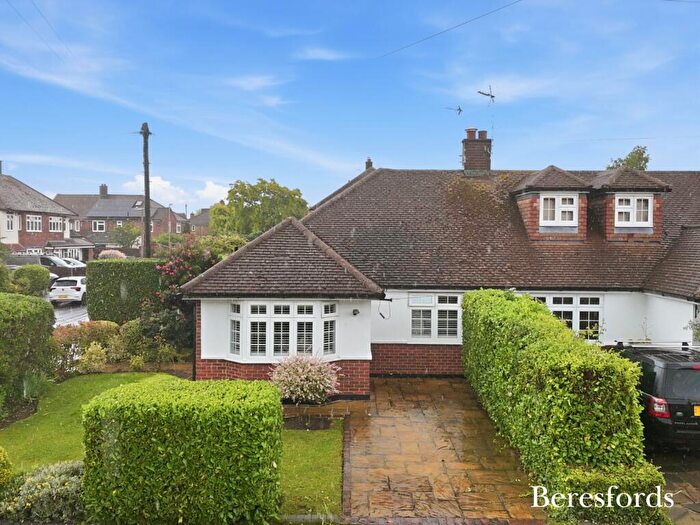
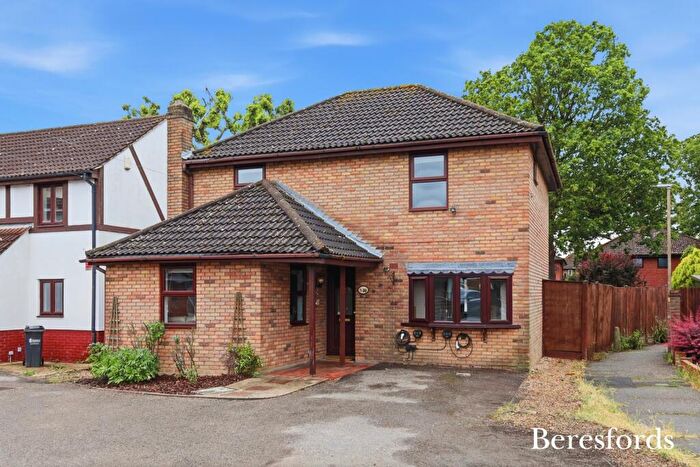
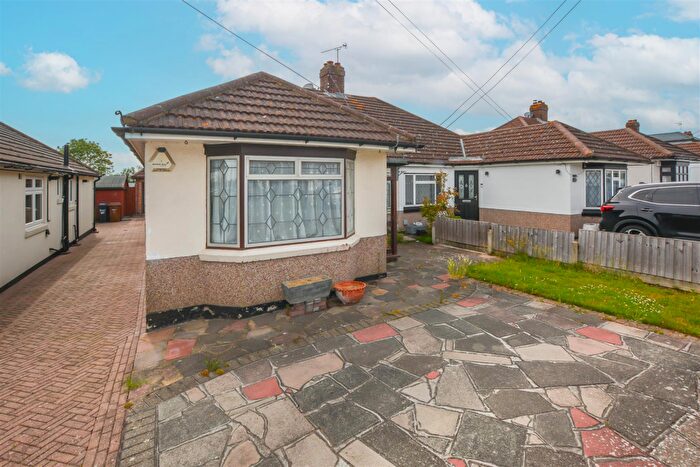
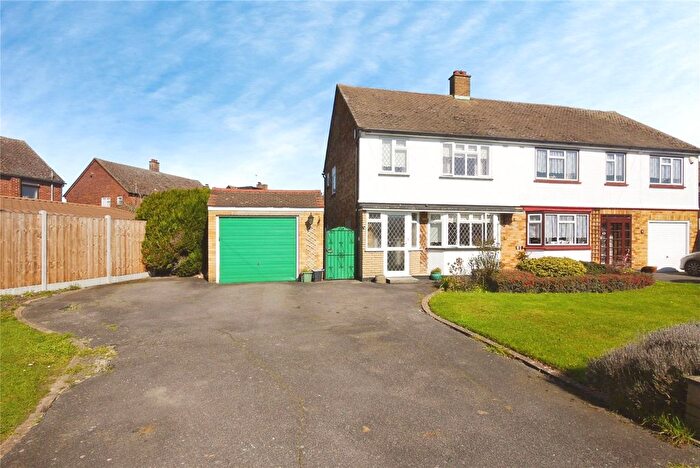
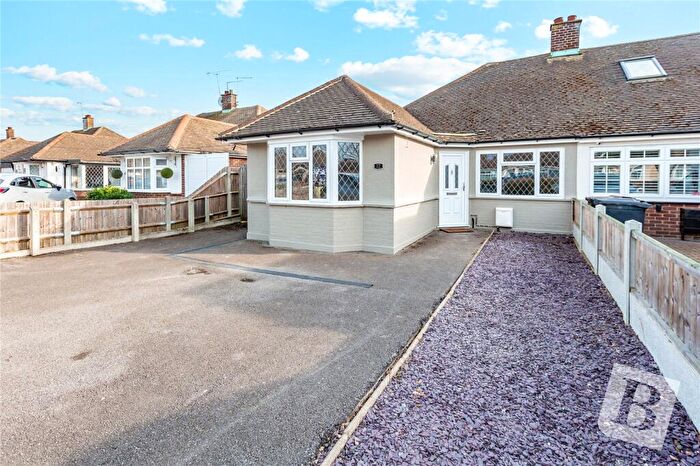
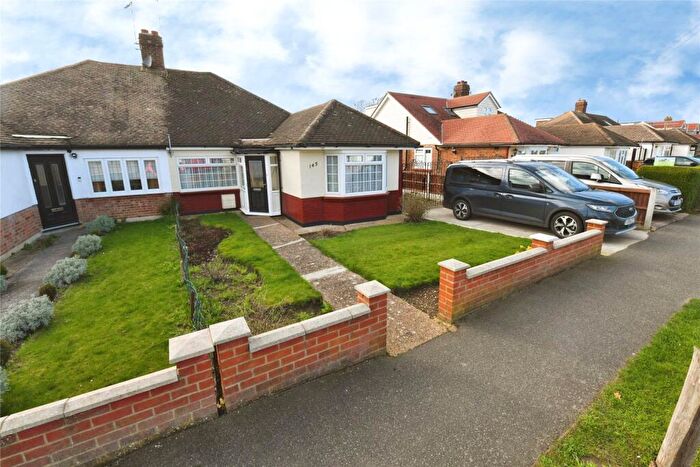
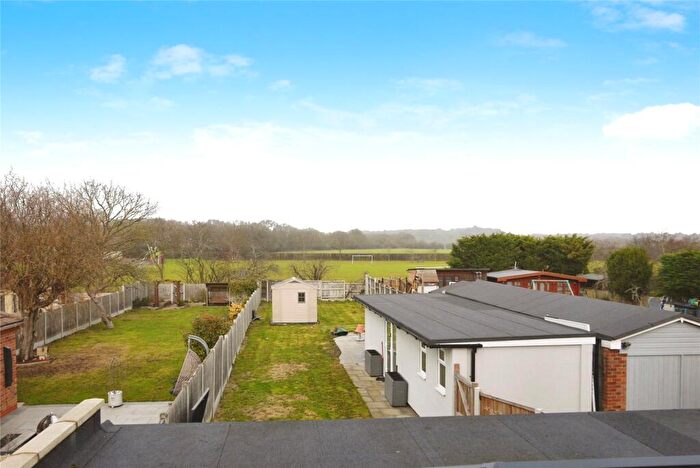
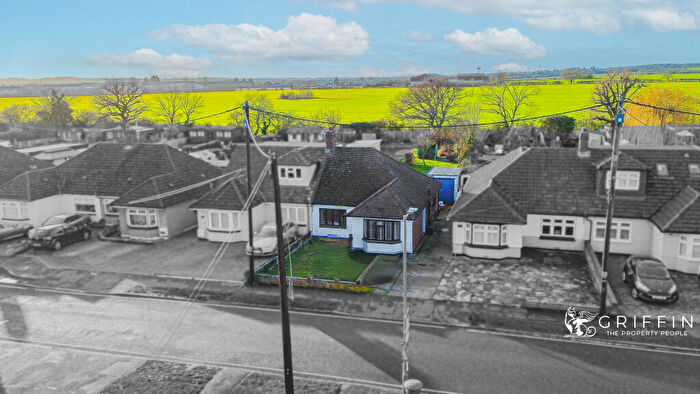
Previously listed properties in Brentwood

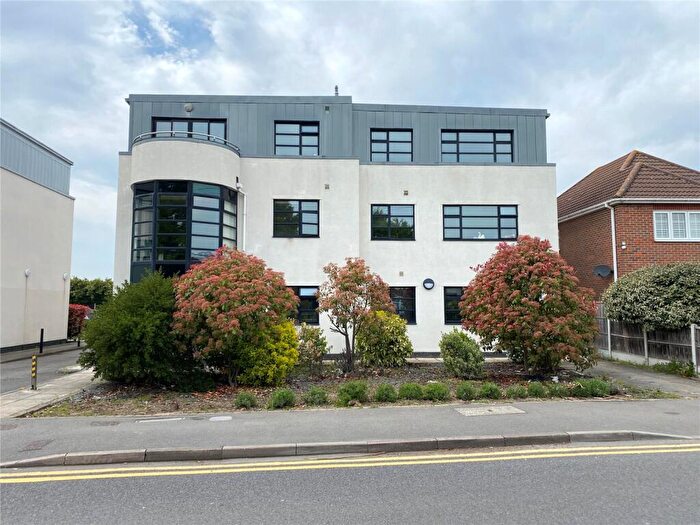
![]()
If you are looking to sell your house, let it out, or receive a property valuation, an expert can help you.
Click the button below to get started.

Neighbourhoods in Brentwood
Navigate through our locations to find the location of your next house in Brentwood, Thurrock for sale or to rent.
Property price trends in Brentwood
According to the latest Land Registry data, the average home in Brentwood sold for £315,000 in 2019. That figure comes from 13 sales logged over the past 23 years.
Prices have fallen back over the last three years. Compared with 2016, when the typical sale came in around £388,000, that's a fall of roughly 18.8%.
Zoom out to the past decade for the fuller picture. Back in 2007, homes here averaged £617,500, so the typical sold price has fallen about 49% since then, around 5.5% a year lower. Stretch the view to fifteen years and that annual pace edges up closer to -2.4%.
Frequently asked questions about Brentwood
Which train stations are available in or near Brentwood?
Some of the train stations available in or near Brentwood are West Horndon, Laindon and Ockendon.
Which tube stations are available in or near Brentwood?
Some of the tube stations available in or near Brentwood are Upminster and Upminster Bridge.
Property Price Paid in Brentwood by Year
The average sold property price by year was:
| Year | Average Sold Price | Price Change |
Sold Properties
|
|---|---|---|---|
| 2019 | £315,000 | -23% |
2 Properties |
| 2016 | £388,000 | -59% |
1 Property |
| 2007 | £617,500 | 20% |
1 Property |
| 2005 | £494,477 | 6% |
1 Property |
| 2003 | £465,000 | 37% |
2 Properties |
| 2002 | £295,000 | -32% |
2 Properties |
| 2000 | £390,000 | 39% |
1 Property |
| 1999 | £239,500 | 46% |
2 Properties |
| 1996 | £130,000 | - |
1 Property |
Transport in Brentwood
Please see below transportation links in this area:


