
Houses for sale in Thurrock, England
House Prices in Thurrock
Properties in Thurrock have
an average house price of
£351k
and had 6,245 Property Transactions
within the last 3 years.¹
Thurrock is a location in
England with
66,187 households², where the most expensive property was sold for £1.65M.
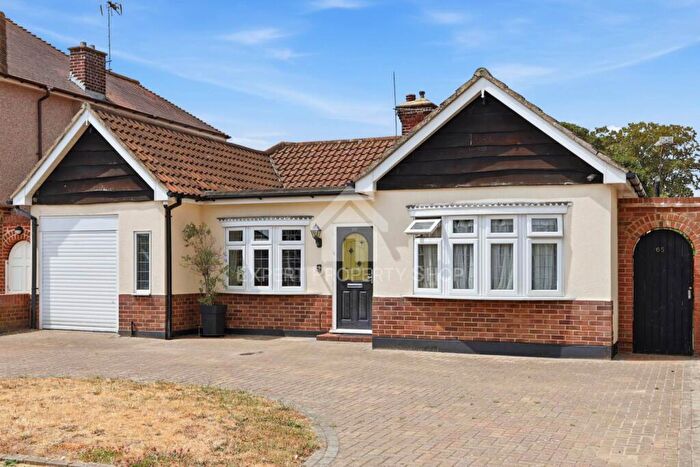
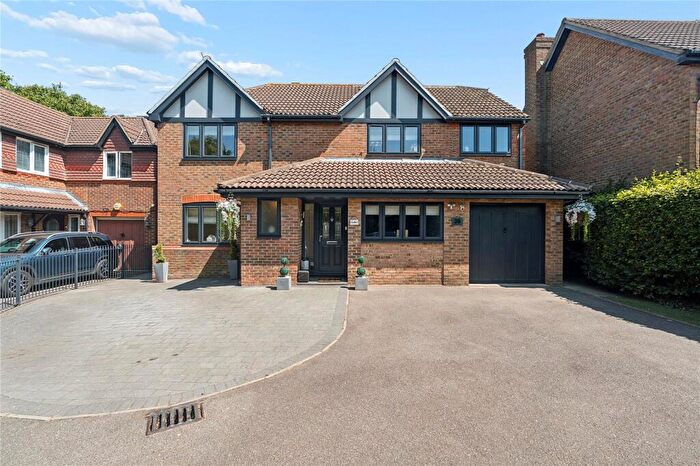
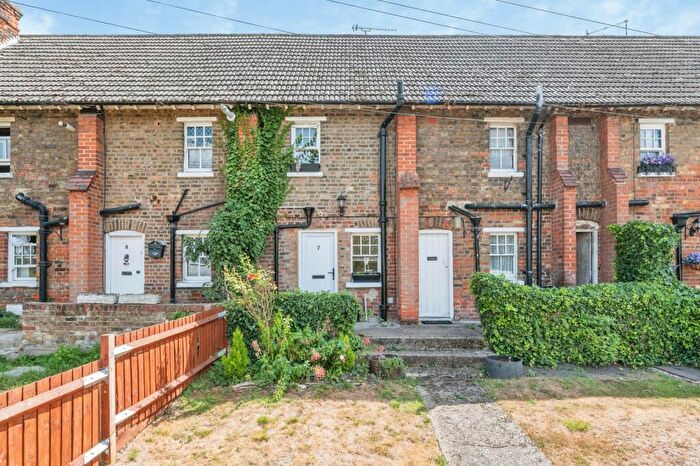
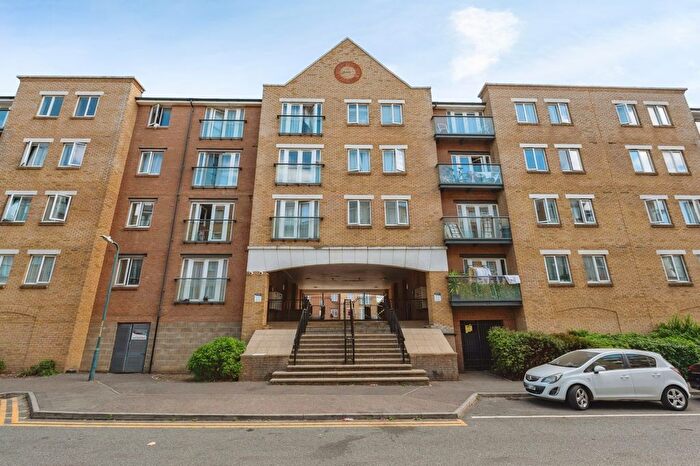
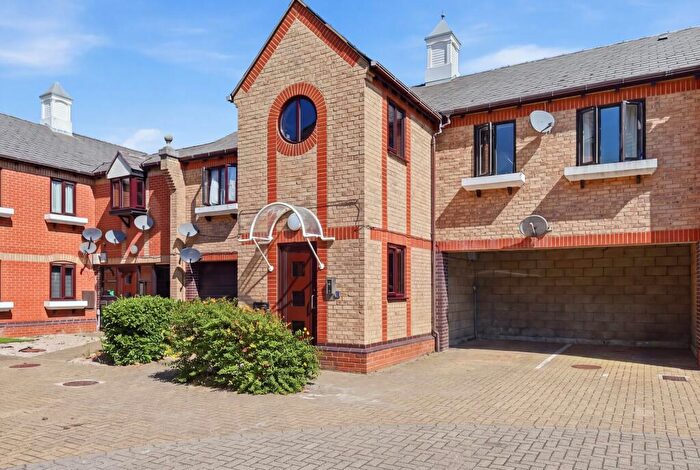
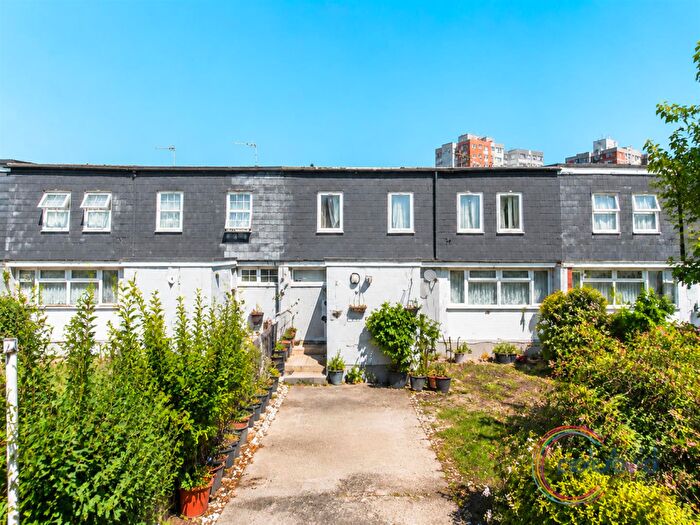
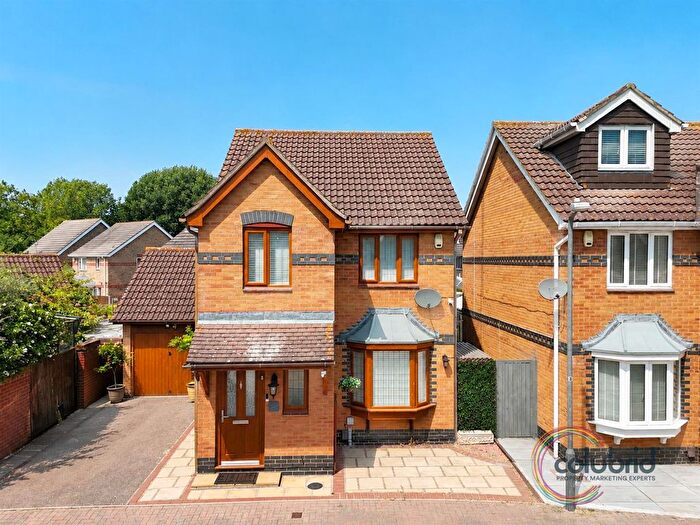
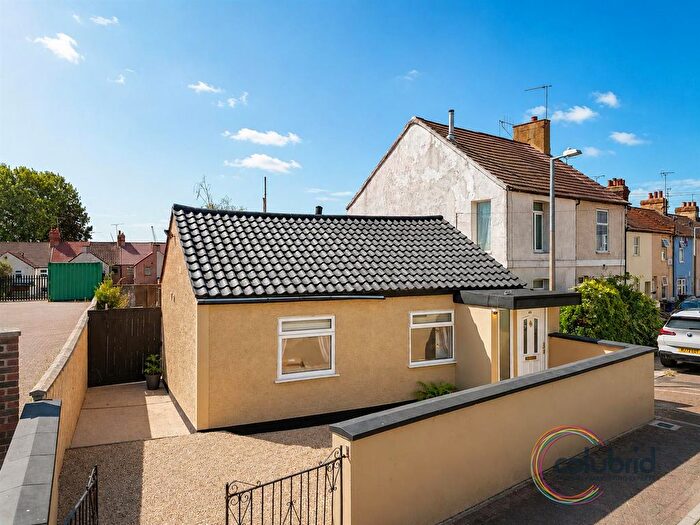
Properties for sale in Thurrock
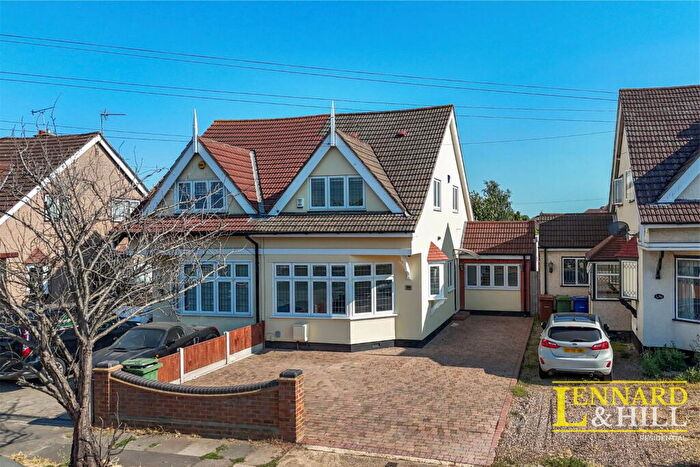
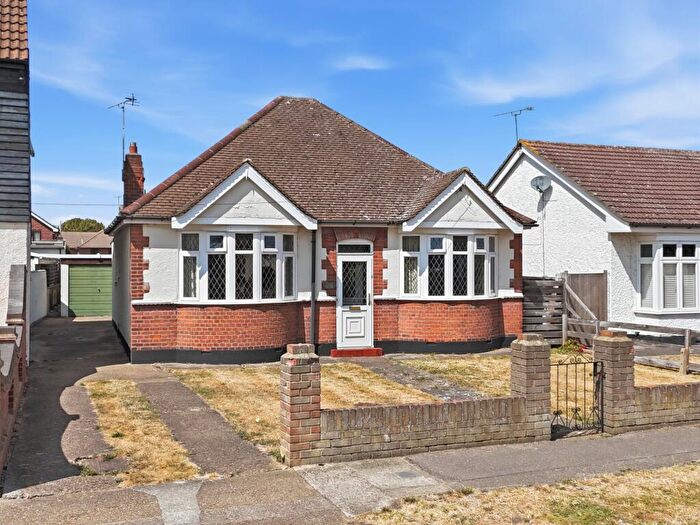
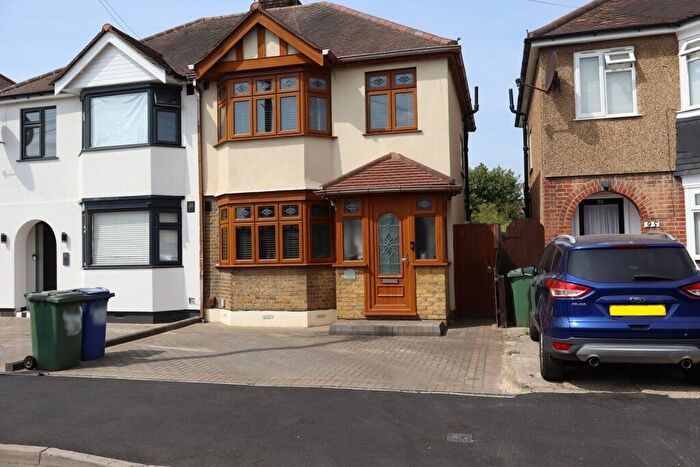
![]()
If you are looking to sell your house, let it out, or receive a property valuation, an expert can help you.
Click the button below to get started.


Towns in Thurrock
Navigate through our locations to find the location of your next house in Thurrock, England for sale or to rent.
Property price trends in Thurrock
According to the latest Land Registry data, the average home in Thurrock sold for £362,159 in 2026. That figure comes from a substantial record of 90,049 sales logged over the past 31 years.
Prices have moved up over the last three years. Compared with 2023, when the typical sale came in around £346,788, that's a rise of roughly 4.4%.
Looking back five years, average prices are up about 9.7% since 2021, a gain of around £31,989 in cash terms.
Zoom out to the past decade for the fuller picture. Back in 2016, homes here averaged £262,597, so the typical sold price has climbed about 37.9% since then, roughly 3.3% a year. Stretch the view to fifteen years and that annual pace edges up closer to 4.7%.
Frequently asked questions about Thurrock
What is the average price for a property for sale in Thurrock?
The average price for a property for sale in Thurrock is £351,134. This amount is 2% lower than the average price in England. There are more than 10,000 property listings for sale in Thurrock.
What locations have the most expensive properties for sale in Thurrock?
The locations with the most expensive properties for sale in Thurrock are Upminster at an average of £736,588, Basildon at an average of £715,000 and Stanford-le-hope at an average of £372,410.
What locations have the most affordable properties for sale in Thurrock?
The locations with the most affordable properties for sale in Thurrock are Purfleet at an average of £250,955, Tilbury at an average of £309,243 and South Ockendon at an average of £345,968.
Which train stations are available in or near Thurrock?
Some of the train stations available in or near Thurrock are Grays, Tilbury Town and Chafford Hundred.
Property Price Paid in Thurrock by Year
The average sold property price by year was:
| Year | Average Sold Price | Price Change |
Sold Properties
|
|---|---|---|---|
| 2026 | £362,159 | 2% |
363 Properties |
| 2025 | £356,479 | 3% |
2,139 Properties |
| 2024 | £347,197 | 0,1% |
2,029 Properties |
| 2023 | £346,788 | 1% |
1,714 Properties |
| 2022 | £344,244 | 4% |
2,359 Properties |
| 2021 | £330,170 | 6% |
3,088 Properties |
| 2020 | £309,972 | 6% |
2,256 Properties |
| 2019 | £291,821 | -1% |
2,573 Properties |
| 2018 | £294,617 | 4% |
2,661 Properties |
| 2017 | £283,267 | 7% |
2,932 Properties |
Property Price per Property Type in Thurrock
Here you can find historic sold price data in order to help with your property search.
The average Property Paid Price for specific property types in the last three years are:
| Property Type | Average Sold Price | Sold Properties |
|---|---|---|
| Semi Detached House | £399,588.00 | 1,901 Semi Detached Houses |
| Terraced House | £337,451.00 | 2,294 Terraced Houses |
| Detached House | £564,416.00 | 684 Detached Houses |
| Flat | £199,883.00 | 1,366 Flats |
Transport in Thurrock
Please see below transportation links in this area:
