Houses for sale & to rent in Orsett, Grays
House Prices in Orsett
Properties in Orsett have an average house price of £482,159.00 and had 109 Property Transactions within the last 3 years¹.
Orsett is an area in Grays, Thurrock with 1,230 households², where the most expensive property was sold for £1,100,000.00.
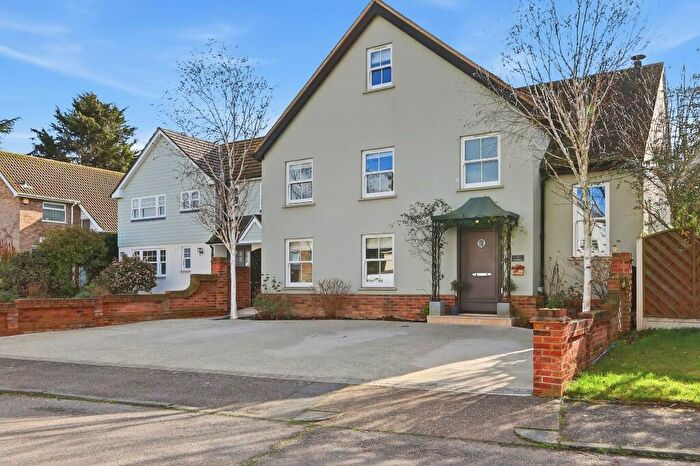
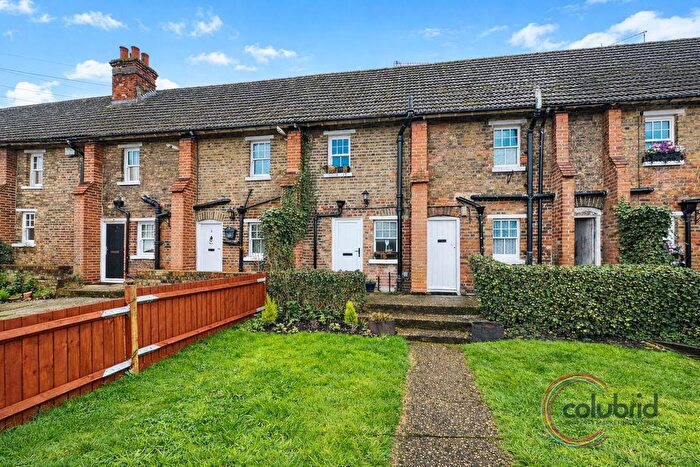
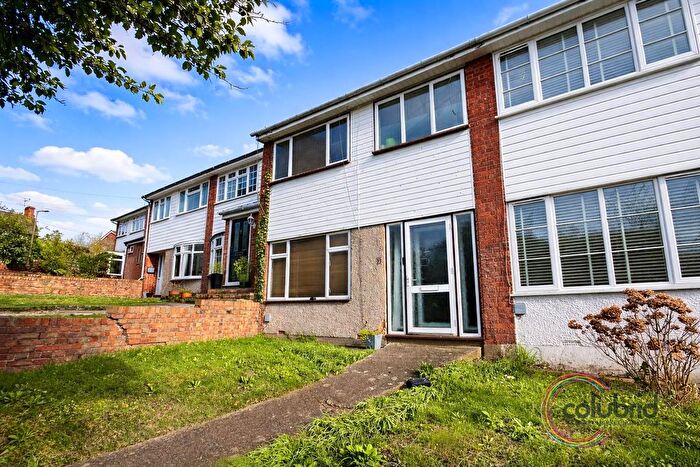
Properties for sale in Orsett
Roads and Postcodes in Orsett
Navigate through our locations to find the location of your next house in Orsett, Grays for sale or to rent.
| Streets | Postcodes |
|---|---|
| A13 Eastbound | RM16 3AY |
| A13 Westbound | RM16 3BW |
| Alderton Road | RM16 3DZ |
| Annabell Avenue | RM16 3BY |
| Ashby Close | RM16 3DX |
| Baker Street | RM16 3LJ RM16 3LS RM16 3NR |
| Beverley Close | RM16 3EA |
| Bloomfield Walk | RM16 3GW |
| Bonham Drive | RM16 3HF RM16 3HG |
| Borley Court | RM16 3DE |
| Brentwood Road | RM16 3BD RM16 3HU RM16 3BP |
| Bristowe Drive | RM16 3DB |
| Cassell Close | RM16 3HQ |
| Conways Road | RM16 3EL |
| Criton Industrial Estate | RM16 3DH |
| Daltons Shaw | RM16 3GY |
| Ellis Close | RM16 3DN |
| Fen Lane | RM16 3LT |
| Fordhams Row | RM16 3LA |
| Gammonfields Way | RM16 2FA |
| Green Lane | RM16 3AN |
| Grosvenor Road | RM16 3BT |
| Hemley Road | RM16 3DG RM16 3DQ |
| Herga Hyll | RM16 3JA |
| Hew Watt Close | RM16 3GU |
| High Road | RM16 3ER RM16 3HB RM16 3LD RM16 3LH RM16 3NS |
| Jason Close | RM16 3DY |
| Lodysons Close | RM16 3HZ |
| Malting Lane | RM16 3HH RM16 3HJ RM16 3HL |
| Medbree Court | RM16 3GZ |
| Mill Lane | RM16 3JP |
| Nelson Road | RM16 3BU |
| Orsett Road | RM16 3BE RM16 3BH |
| Paddock Close | RM16 3DL |
| Parkers Farm Road | RM16 3HX |
| Parkway | RM16 3HA |
| Penn Close | RM16 3ED |
| Pound Lane | RM16 3HD |
| Prince Charles Avenue | RM16 3HS RM16 3HT |
| Randall Drive | RM16 3GT |
| Rectory Fields | RM16 3JN |
| Rectory Road | RM16 3EH RM16 3JT RM16 3JU RM16 3JX RM16 3LB |
| Ridgewell Avenue | RM16 3HR |
| Ridgwell Avenue | RM16 3HP |
| Rowley Road | RM16 3ET RM16 3EU |
| Rutledge Close | RM16 3GS |
| Sandown Close | RM16 3AQ |
| Sandown Road | RM16 3DD |
| School Lane | RM16 3JS RM16 3JR |
| Shelford Close | RM16 3HN |
| St Giles Close | RM16 3EB |
| Stanford Road | RM16 3BA RM16 3BB RM16 3BS RM16 3BX RM16 3BL RM16 3DU RM16 3JL |
| Stifford Clays Road | RM16 3LX RM16 3NH RM16 3NB RM16 3ND |
| The Green | RM16 3EX |
| The Paddocks | RM16 3AE |
| The Spinney | RM16 3EJ |
| Welling Road | RM16 3AZ RM16 3BF RM16 3DF RM16 3DW |
| Whitmore Close | RM16 3JE |
| Wingfield Drive | RM16 3HE RM16 3HW |
| Woolings Close | RM16 3AT |
| Woolings Row | RM16 3AS |
Transport near Orsett
-
Stanford-Le-Hope Station
-
East Tilbury Station
-
Grays Station
-
Tilbury Town Station
-
Ockendon Station
-
Chafford Hundred Station
-
West Horndon Station
-
Laindon Station
-
Gravesend Station
-
Northfleet Station
- FAQ
- Price Paid By Year
- Property Type Price
Frequently asked questions about Orsett
What is the average price for a property for sale in Orsett?
The average price for a property for sale in Orsett is £482,159. This amount is 37% higher than the average price in Grays. There are 1,838 property listings for sale in Orsett.
What streets have the most expensive properties for sale in Orsett?
The streets with the most expensive properties for sale in Orsett are Fordhams Row at an average of £775,000, Daltons Shaw at an average of £760,000 and Rectory Road at an average of £721,944.
What streets have the most affordable properties for sale in Orsett?
The streets with the most affordable properties for sale in Orsett are Parkers Farm Road at an average of £305,750, Randall Drive at an average of £328,000 and Borley Court at an average of £329,166.
Which train stations are available in or near Orsett?
Some of the train stations available in or near Orsett are Stanford-Le-Hope, East Tilbury and Grays.
Property Price Paid in Orsett by Year
The average sold property price by year was:
| Year | Average Sold Price | Price Change |
Sold Properties
|
|---|---|---|---|
| 2025 | £481,145 | 5% |
39 Properties |
| 2024 | £458,250 | -10% |
31 Properties |
| 2023 | £502,179 | -2% |
39 Properties |
| 2022 | £512,116 | 15% |
43 Properties |
| 2021 | £433,422 | 8% |
77 Properties |
| 2020 | £400,738 | -17% |
46 Properties |
| 2019 | £470,030 | 0,5% |
50 Properties |
| 2018 | £467,835 | 18% |
56 Properties |
| 2017 | £381,659 | -1% |
58 Properties |
| 2016 | £384,060 | 17% |
66 Properties |
| 2015 | £317,774 | 5% |
72 Properties |
| 2014 | £300,800 | -6% |
90 Properties |
| 2013 | £318,549 | 15% |
40 Properties |
| 2012 | £269,723 | 5% |
38 Properties |
| 2011 | £256,098 | 6% |
43 Properties |
| 2010 | £240,840 | -10% |
36 Properties |
| 2009 | £265,340 | -11% |
47 Properties |
| 2008 | £295,840 | 4% |
41 Properties |
| 2007 | £285,188 | 3% |
103 Properties |
| 2006 | £275,598 | 7% |
151 Properties |
| 2005 | £256,480 | 2% |
119 Properties |
| 2004 | £251,114 | 17% |
87 Properties |
| 2003 | £207,557 | 16% |
72 Properties |
| 2002 | £174,533 | 23% |
83 Properties |
| 2001 | £133,792 | 22% |
76 Properties |
| 2000 | £104,824 | -12% |
49 Properties |
| 1999 | £117,738 | 7% |
73 Properties |
| 1998 | £109,702 | 14% |
53 Properties |
| 1997 | £94,297 | 14% |
110 Properties |
| 1996 | £81,505 | -14% |
91 Properties |
| 1995 | £93,038 | - |
99 Properties |
Property Price per Property Type in Orsett
Here you can find historic sold price data in order to help with your property search.
The average Property Paid Price for specific property types in the last three years are:
| Property Type | Average Sold Price | Sold Properties |
|---|---|---|
| Semi Detached House | £439,336.00 | 26 Semi Detached Houses |
| Detached House | £608,716.00 | 47 Detached Houses |
| Terraced House | £364,362.00 | 29 Terraced Houses |
| Flat | £279,500.00 | 7 Flats |

