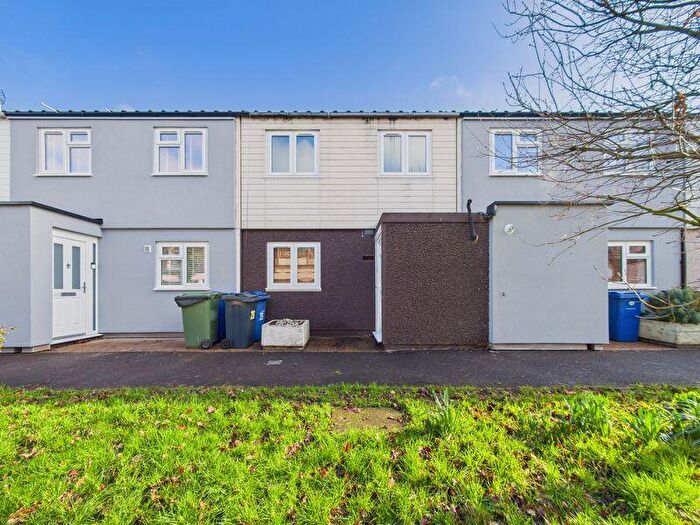
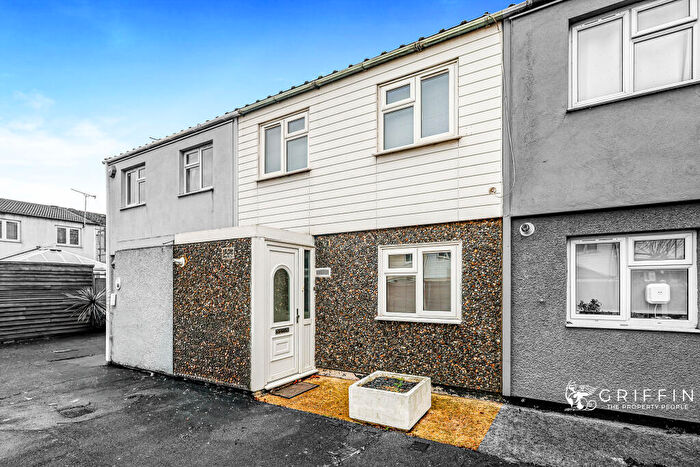
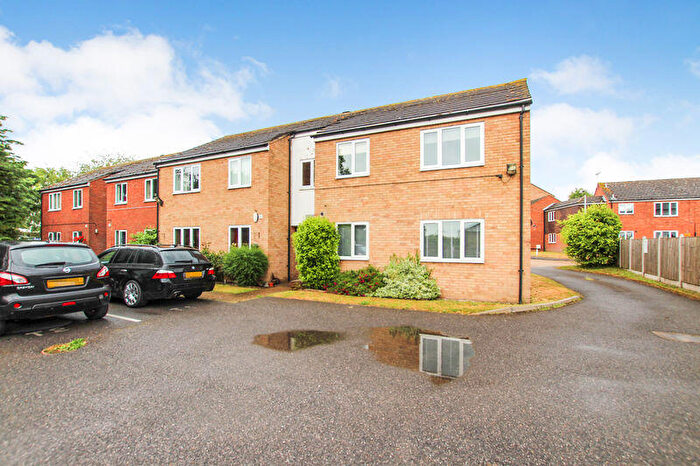
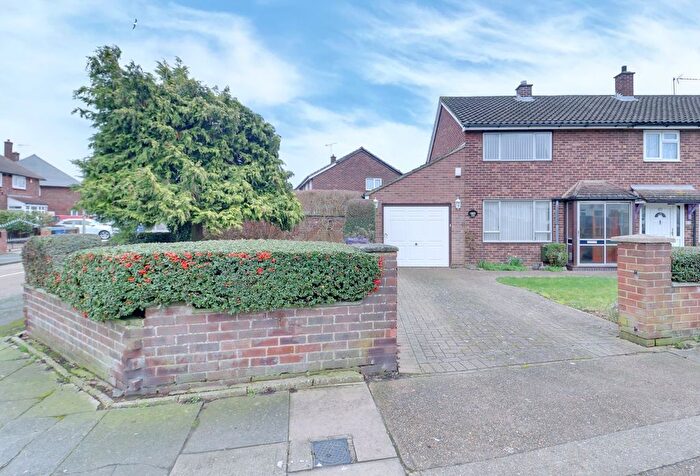
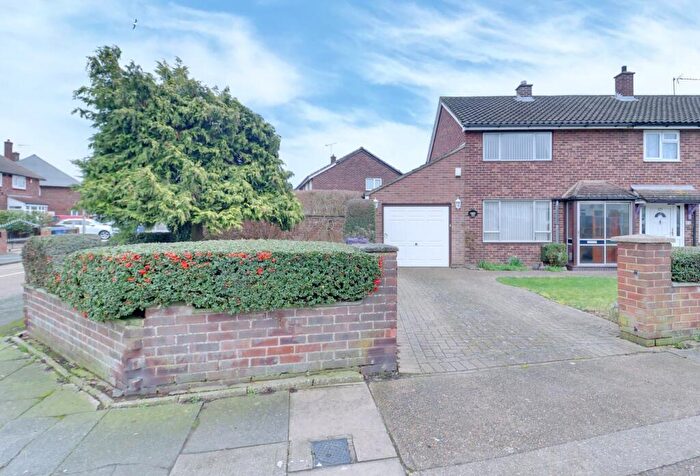
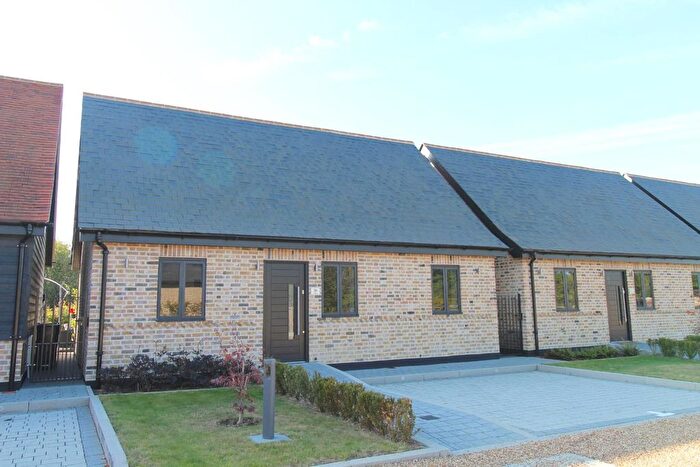
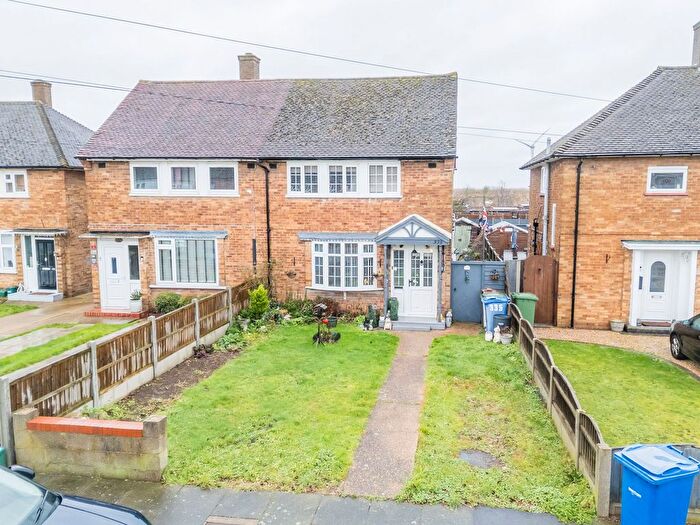
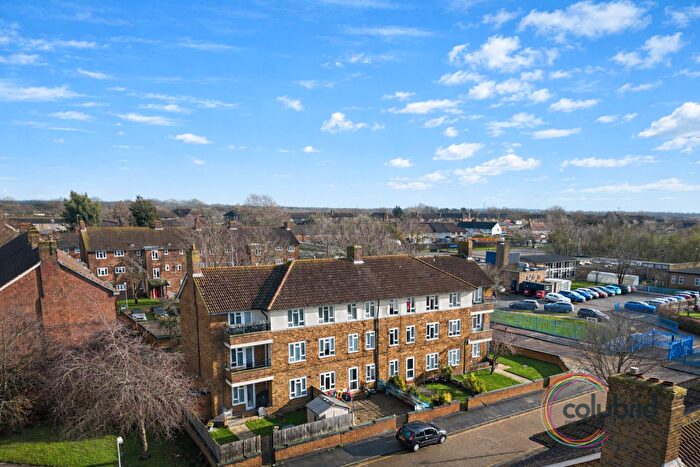
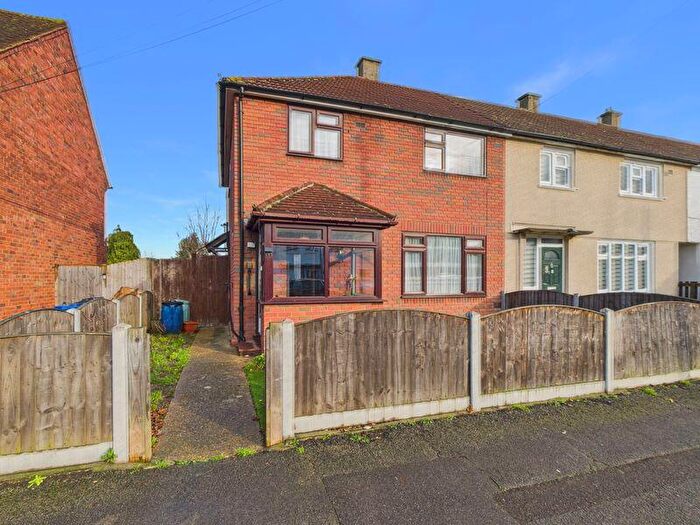
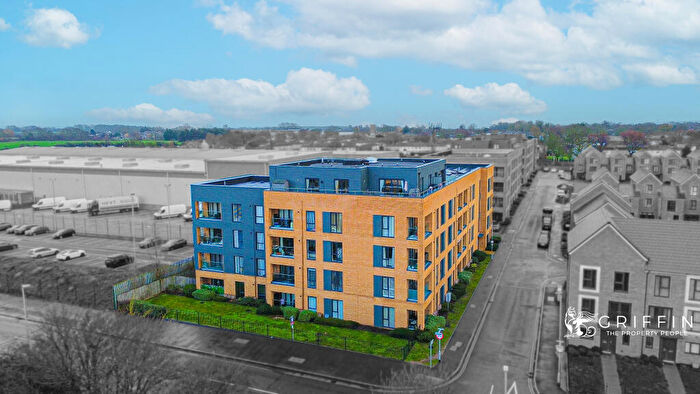
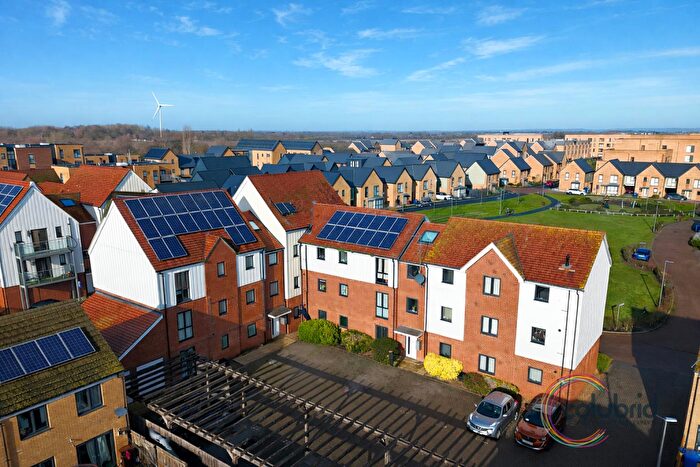
Houses for sale & to rent in Ockendon, South Ockendon
House Prices in Ockendon
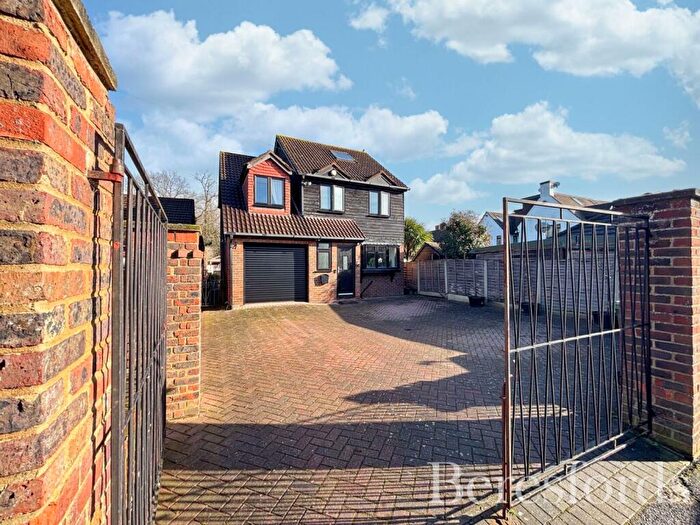
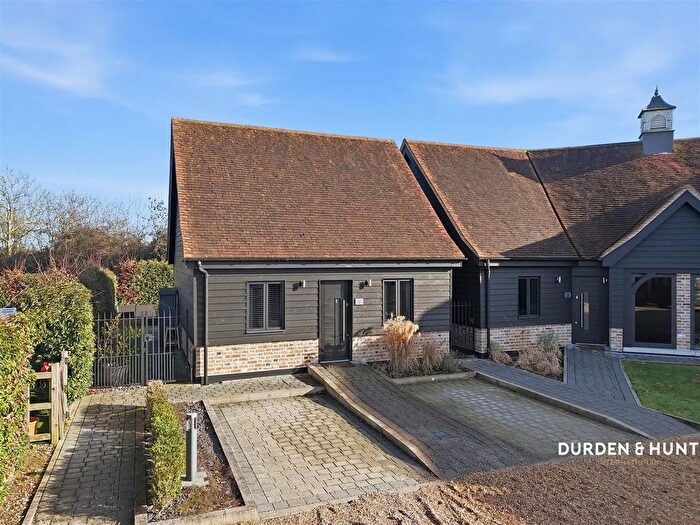
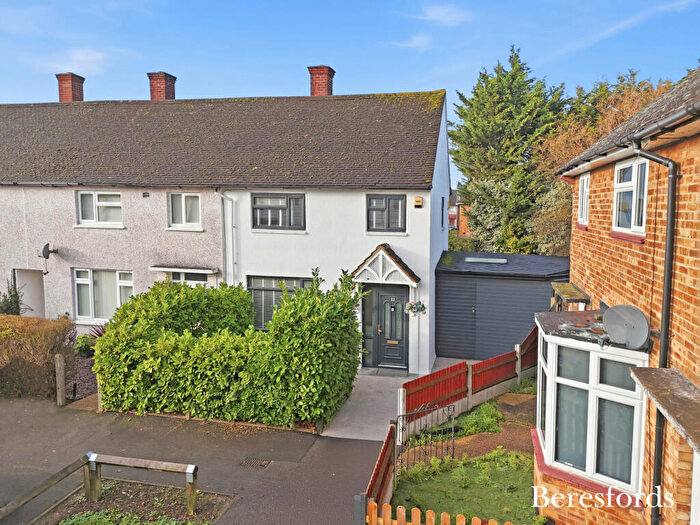
Properties in Ockendon have an average house price of £344,271.00 and had 394 Property Transactions within the last 3 years¹.
Ockendon is an area in South Ockendon, Thurrock with 4,024 households², where the most expensive property was sold for £652,000.00.
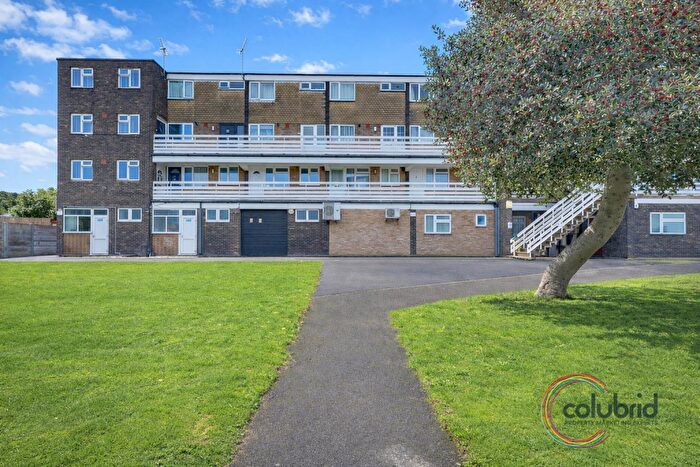
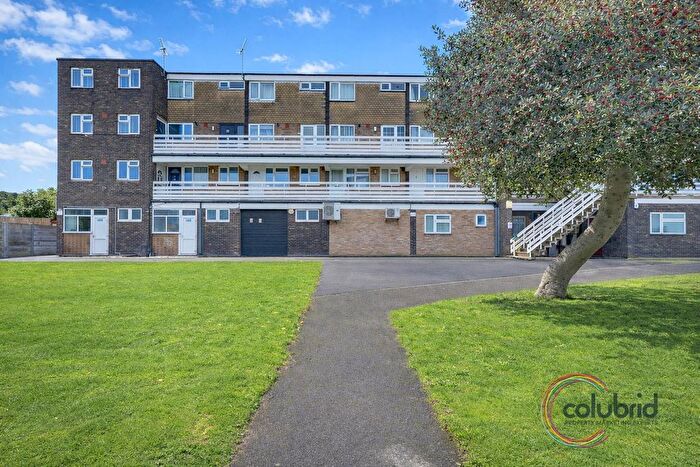
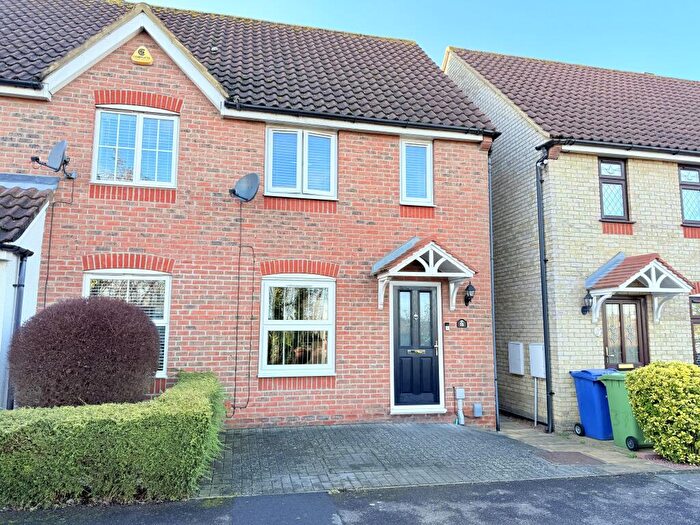
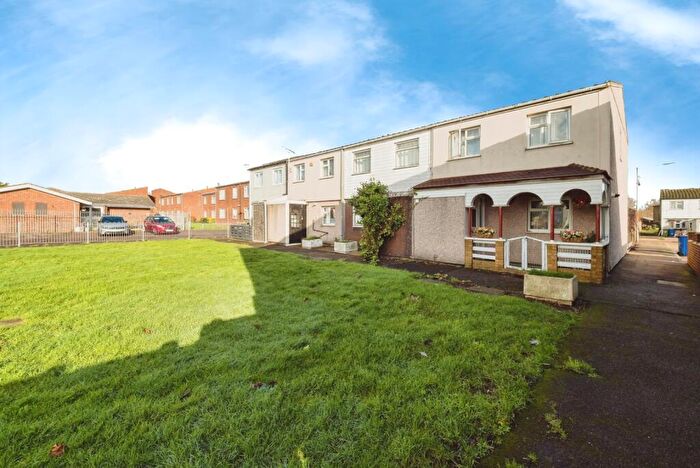
Properties for sale in Ockendon
Roads and Postcodes in Ockendon
Navigate through our locations to find the location of your next house in Ockendon, South Ockendon for sale or to rent.
| Streets | Postcodes |
|---|---|
| Aire Drive | RM15 5AP |
| Alder Drive | RM15 6RD |
| Aldham Drive | RM15 5BU |
| Alwen Grove | RM15 5DN RM15 5DW |
| Anglia Way | RM15 5FL RM15 5FN |
| Annalee Gardens | RM15 5DE RM15 5DF |
| Annalee Road | RM15 5BY RM15 5BZ RM15 5DJ |
| Annifer Way | RM15 5BT |
| Anton Road | RM15 5AT RM15 5AU |
| Araglen Avenue | RM15 5DA RM15 5DB RM15 5DD RM15 5DG RM15 5DQ |
| Arcany Road | RM15 5FF RM15 5FG RM15 5FP RM15 5TB RM15 5SX |
| Ardmore Road | RM15 5TH |
| Arisdale Avenue | RM15 5AS RM15 5BA RM15 5BD RM15 5FE RM15 5SJ RM15 5TT RM15 5LE |
| Arisdale Close | RM15 5FR |
| Ash Walk | RM15 6TY |
| Ashdon Close | RM15 5JE |
| Aspen Way | RM15 6TX |
| Avontar Road | RM15 5AX RM15 5FD |
| Ayron Road | RM15 5FJ |
| Benyon Path | RM15 6PE |
| Birch Close | RM15 6XD |
| Birch Crescent | RM15 6TZ |
| Bovey Way | RM15 5BS |
| Bradd Close | RM15 6SA |
| Brandon Groves Avenue | RM15 6TD RM15 6SB |
| Canterbury Parade | RM15 6NH |
| Cedar Rise | RM15 6RB |
| Celandine Close | RM15 6JA RM15 6JB |
| Cheelson Road | RM15 6QD |
| Cherry Tree Drive | RM15 6TP |
| Church Crescent | RM15 6QP |
| Cliff Place | RM15 6QR |
| Copper Beech Road | RM15 6QS |
| Daiglen Drive | RM15 5AD RM15 5AE RM15 5AF RM15 5AG RM15 5AJ RM15 5AL RM15 5AQ RM15 5AR RM15 5BB RM15 5EH |
| Daines Close | RM15 5RX |
| Dalroy Close | RM15 5LR |
| Darenth Lane | RM15 5LN RM15 5LY |
| Dart Green | RM15 5DH |
| Dawley Green | RM15 5LW |
| Dene Path | RM15 5LZ |
| Dennises Lane | RM15 5SD |
| Derry Avenue | RM15 5DL RM15 5DU RM15 5DX RM15 5DZ RM15 5FU RM15 5GN |
| Derwent Parade | RM15 5EE RM15 5EF RM15 5EB |
| Deveron Gardens | RM15 5ET |
| Dunkellin Grove | RM15 5EZ |
| Dunkellin Way | RM15 5ES RM15 5EY |
| Easington Way | RM15 5EJ RM15 5EP RM15 5ER |
| Eden Green | RM15 5BN RM15 5BW |
| Elan Road | RM15 5EG RM15 5EQ |
| Elmdon Road | RM15 5BF |
| Enborne Green | RM15 5EL |
| Ernan Close | RM15 5EN |
| Ernan Road | RM15 5EW |
| Erriff Drive | RM15 5AN RM15 5AW RM15 5AY RM15 5AZ |
| Eskley Gardens | RM15 5AB RM15 5AH |
| Fairlane Drive | RM15 5FA |
| Fairmount Drive | RM15 5GP |
| Falcon Avenue | RM15 5FQ |
| Falcon Way | RM15 5FW |
| Foyle Drive | RM15 5HE RM15 5HF RM15 5HH |
| Galey Green | RM15 5BP |
| Garth Road | RM15 6AF RM15 6QU |
| Gidea Close | RM15 6PF |
| Groves Farm Cottages | RM15 6SS |
| Hall Lane | RM15 6SH RM15 6SJ RM15 6SL |
| Hamble Lane | RM15 5HG RM15 5HP RM15 5HQ |
| Hazel Drive | RM15 6JT |
| Holly Drive | RM15 6TG |
| Hornbeam Chase | RM15 6TT |
| Juniper Drive | RM15 6TW |
| Laburnum Grove | RM15 6RA RM15 6TA |
| Larkspur Close | RM15 6JG RM15 6JQ |
| Laurel Drive | RM15 6XH |
| Lavender Close | RM15 6TH |
| Lime Close | RM15 6NN RM15 6NW |
| Little Belhus Close | RM15 5BG RM15 5BQ |
| Magnolia Close | RM15 6TE |
| Maple Drive | RM15 6XE |
| Mar Road | RM15 6QT |
| Maverick Drive | RM15 5FY |
| Mayflower Close | RM15 6HY RM15 6HZ |
| Medlar Drive | RM15 6TS |
| Mollands Lane | RM15 6DB RM15 6DH RM15 6DJ RM15 6DL |
| Nelson Road | RM15 6PX |
| Nicholas Close | RM15 6NJ |
| Nordmann Place | RM15 6XA |
| North Road | RM15 6PT RM15 6QA RM15 6QH RM15 6QJ RM15 6SP RM15 6SR RM15 5BE RM15 6BQ RM15 6QL |
| Nursery Close | RM15 6DD |
| Oak Court | RM15 6PN |
| Park Way | RM15 5GR |
| Peartree Close | RM15 6PR RM15 6PU RM15 6PS RM15 6PY |
| Poplar Close | RM15 6TU |
| Quince Tree Close | RM15 6NL |
| Redwood Chase | RM15 6RE |
| Rosemary Close | RM15 6JH RM15 6JJ |
| Rosewood Close | RM15 6TJ |
| Rowan Way | RM15 6TB |
| South Road | RM15 6NP RM15 6NR RM15 6NS RM15 6NT RM15 6NU RM15 6NX |
| Station Approach | RM15 6PD |
| Sunliner Way | RM15 5FS |
| Sycamore Way | RM15 6XB |
| Tamarisk Road | RM15 6HU RM15 6HX RM15 6JD |
| The Green | RM15 6SD |
| Torino Way | RM15 5FT RM15 5FX |
| Tyssen Place | RM15 6PG |
| Verona Way | RM15 5GS |
| Viola Close | RM15 6JE RM15 6JF |
| West Road | RM15 6PB RM15 6PH RM15 6BL RM15 6PL |
| White Beam Drive | RM15 6JS |
| Wilsman Road | RM15 6QB |
| Windstar Drive | RM15 5GU |
| RM15 4BN RM15 4WH RM15 5WE RM15 6WZ RM15 9AY RM15 9BD RM15 9BL RM15 9BQ RM15 9BR RM15 9BS |
Transport near Ockendon
- FAQ
- Price Paid By Year
- Property Type Price
Frequently asked questions about Ockendon
What is the average price for a property for sale in Ockendon?
The average price for a property for sale in Ockendon is £344,271. This amount is 0.45% lower than the average price in South Ockendon. There are 1,446 property listings for sale in Ockendon.
What streets have the most expensive properties for sale in Ockendon?
The streets with the most expensive properties for sale in Ockendon are Aspen Way at an average of £630,000, Hornbeam Chase at an average of £555,833 and Medlar Drive at an average of £539,000.
What streets have the most affordable properties for sale in Ockendon?
The streets with the most affordable properties for sale in Ockendon are Tyssen Place at an average of £150,000, Eden Green at an average of £152,666 and Dart Green at an average of £162,500.
Which train stations are available in or near Ockendon?
Some of the train stations available in or near Ockendon are Ockendon and Chafford Hundred.
Property Price Paid in Ockendon by Year
The average sold property price by year was:
| Year | Average Sold Price | Price Change |
Sold Properties
|
|---|---|---|---|
| 2025 | £345,348 | -2% |
119 Properties |
| 2024 | £351,317 | 5% |
148 Properties |
| 2023 | £335,051 | -1% |
127 Properties |
| 2022 | £339,882 | 9% |
150 Properties |
| 2021 | £310,783 | -4% |
214 Properties |
| 2020 | £323,915 | 8% |
169 Properties |
| 2019 | £296,625 | -2% |
303 Properties |
| 2018 | £302,895 | 4% |
157 Properties |
| 2017 | £289,347 | 6% |
178 Properties |
| 2016 | £272,984 | 17% |
291 Properties |
| 2015 | £227,023 | 5% |
213 Properties |
| 2014 | £216,303 | 11% |
161 Properties |
| 2013 | £193,481 | 11% |
173 Properties |
| 2012 | £171,787 | 6% |
138 Properties |
| 2011 | £161,158 | -6% |
126 Properties |
| 2010 | £171,127 | 4% |
96 Properties |
| 2009 | £164,674 | -9% |
92 Properties |
| 2008 | £179,226 | -1% |
87 Properties |
| 2007 | £181,709 | 12% |
201 Properties |
| 2006 | £159,983 | 0,2% |
187 Properties |
| 2005 | £159,728 | 3% |
163 Properties |
| 2004 | £154,507 | 8% |
206 Properties |
| 2003 | £142,030 | 15% |
195 Properties |
| 2002 | £121,435 | 14% |
225 Properties |
| 2001 | £103,956 | 17% |
237 Properties |
| 2000 | £86,003 | -6% |
205 Properties |
| 1999 | £91,472 | -8% |
230 Properties |
| 1998 | £98,367 | 16% |
355 Properties |
| 1997 | £82,317 | 18% |
284 Properties |
| 1996 | £67,630 | 5% |
199 Properties |
| 1995 | £64,540 | - |
209 Properties |
Property Price per Property Type in Ockendon
Here you can find historic sold price data in order to help with your property search.
The average Property Paid Price for specific property types in the last three years are:
| Property Type | Average Sold Price | Sold Properties |
|---|---|---|
| Flat | £209,977.00 | 87 Flats |
| Semi Detached House | £402,382.00 | 83 Semi Detached Houses |
| Detached House | £516,173.00 | 44 Detached Houses |
| Terraced House | £340,364.00 | 180 Terraced Houses |

