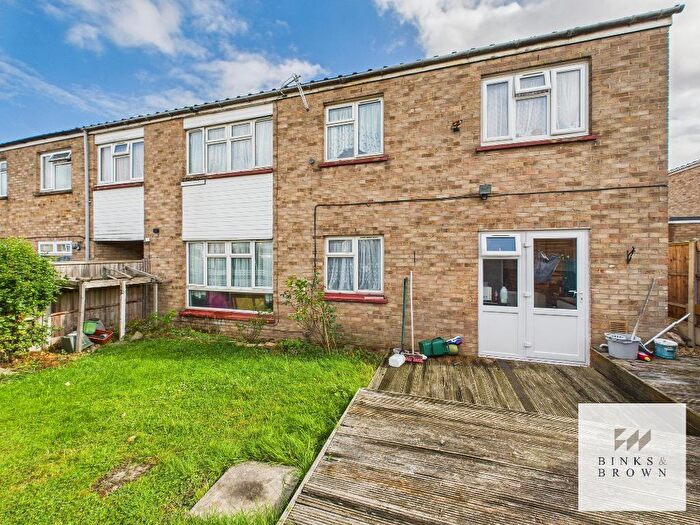
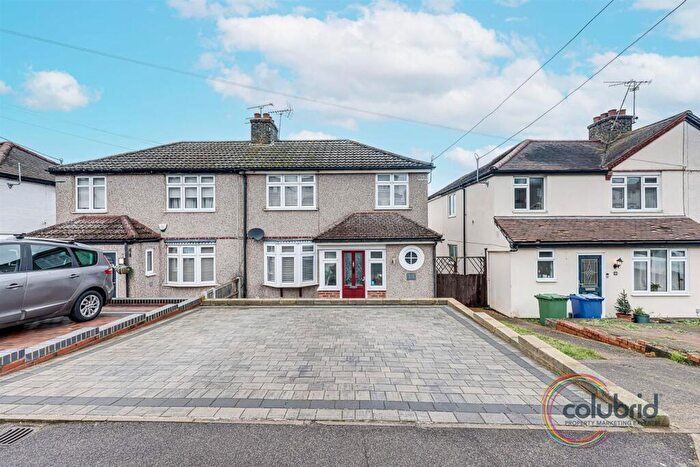
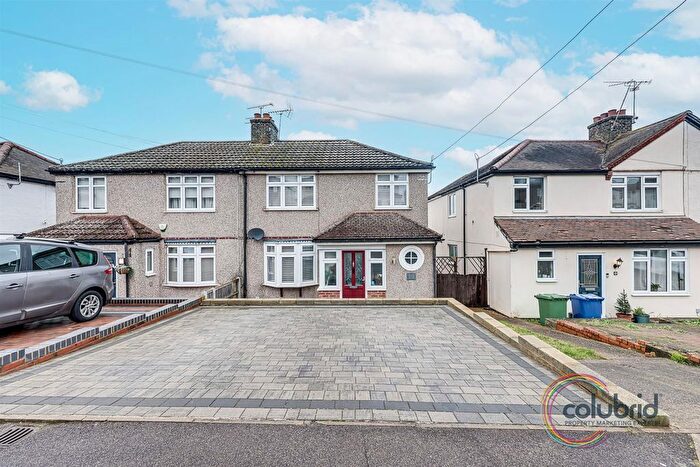
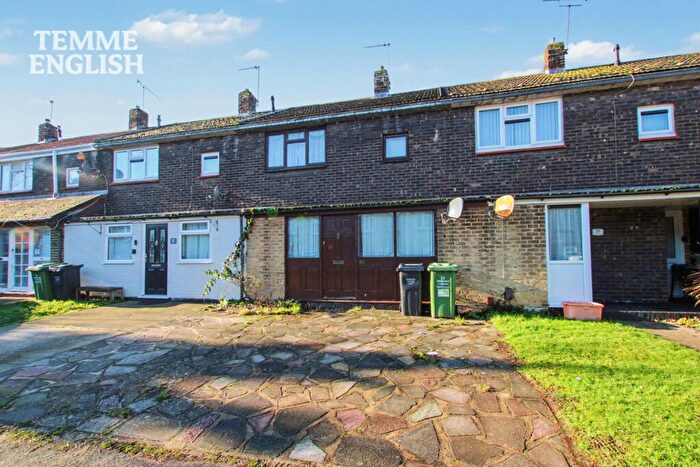
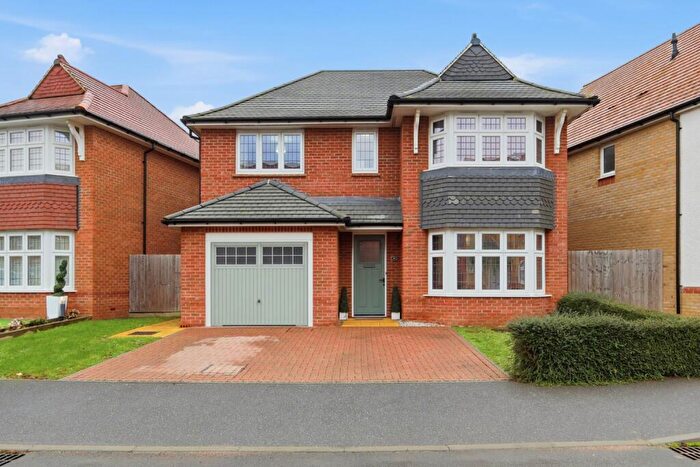
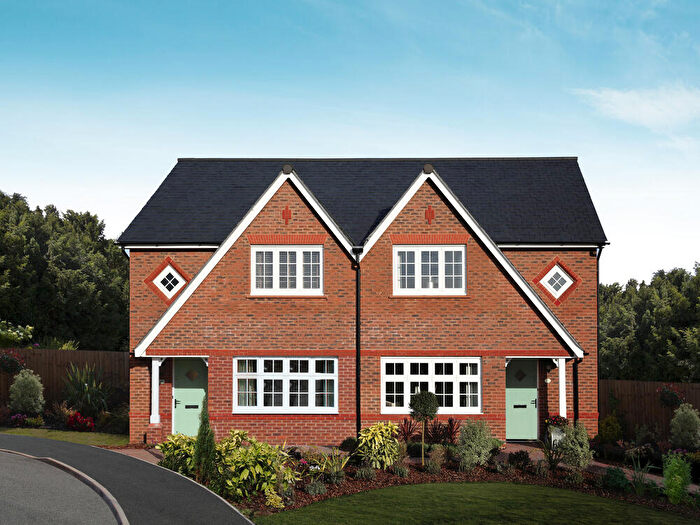
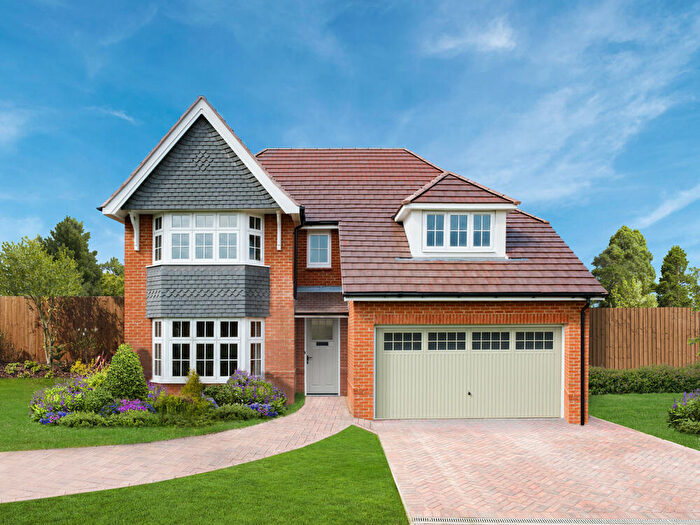
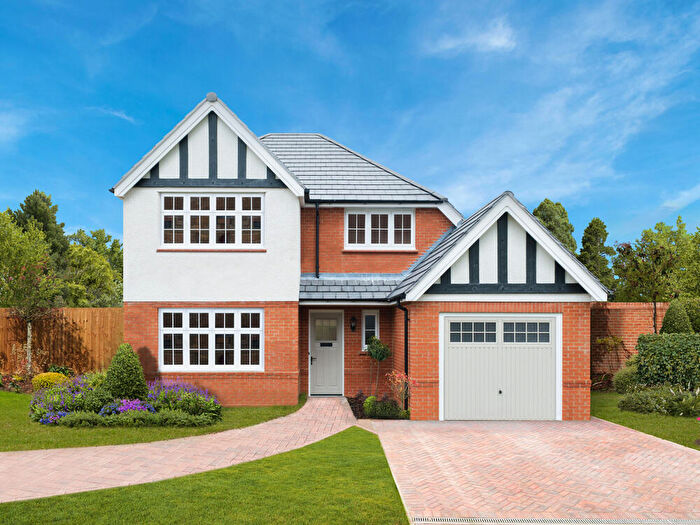
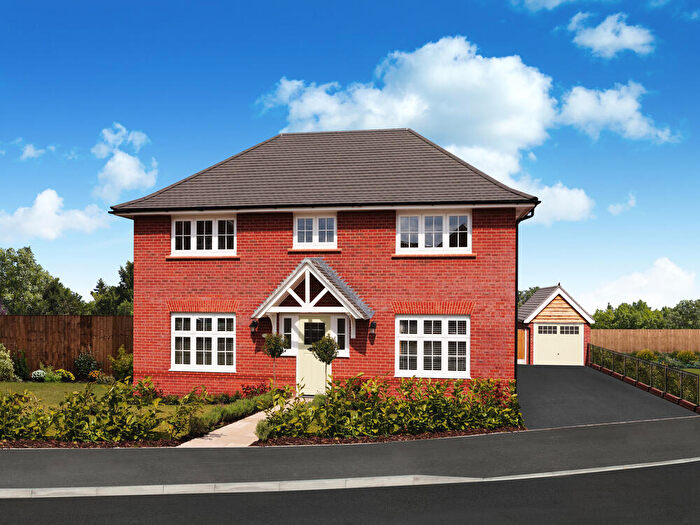
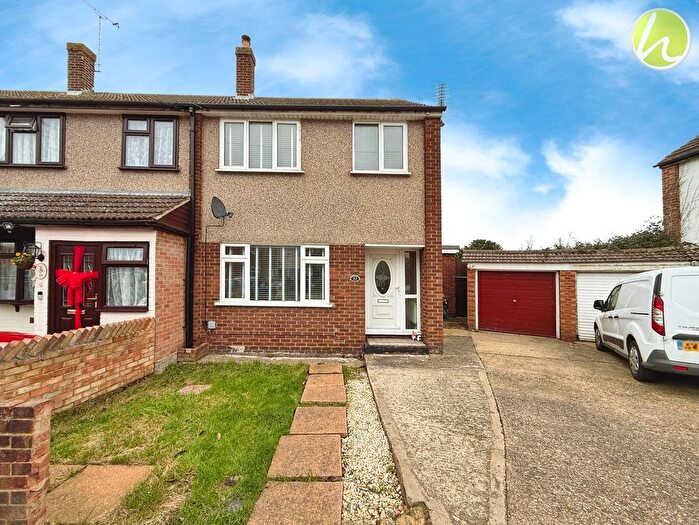
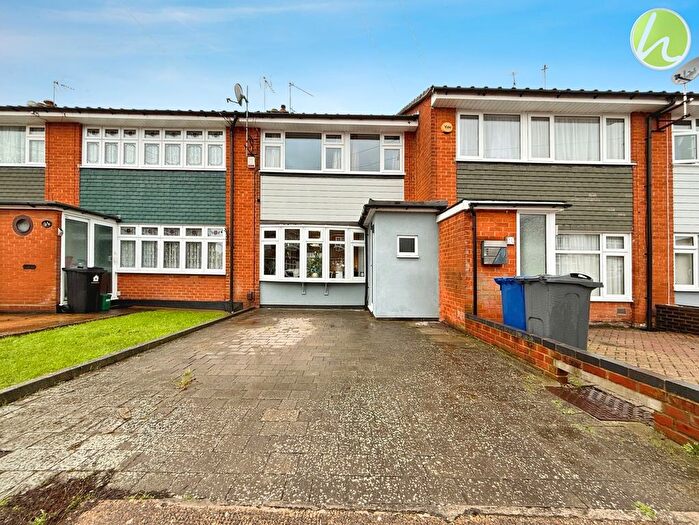
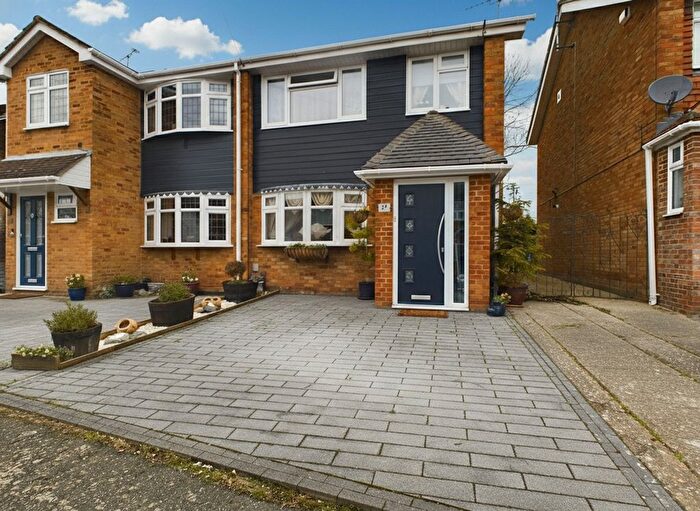
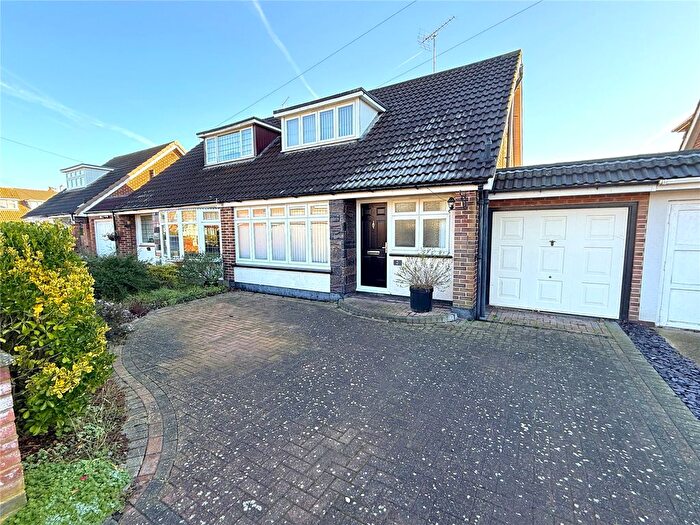
Houses for sale & to rent in Corringham And Fobbing, Stanford-le-hope
House Prices in Corringham And Fobbing
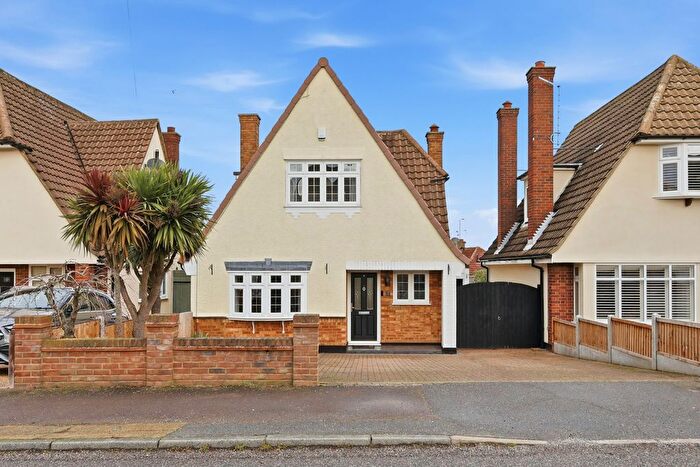
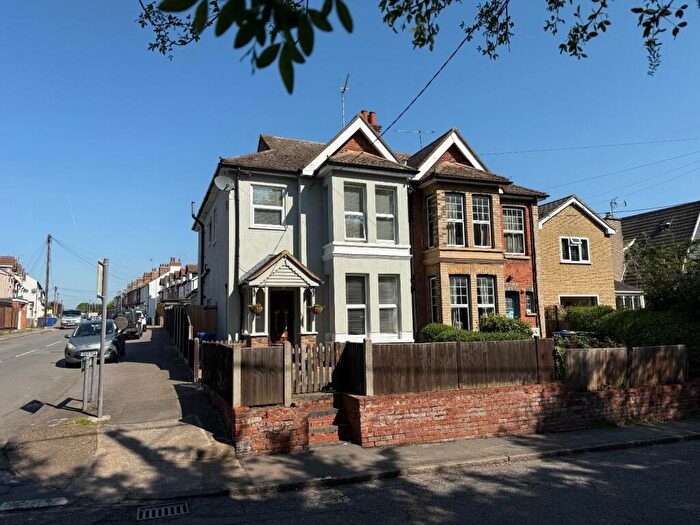
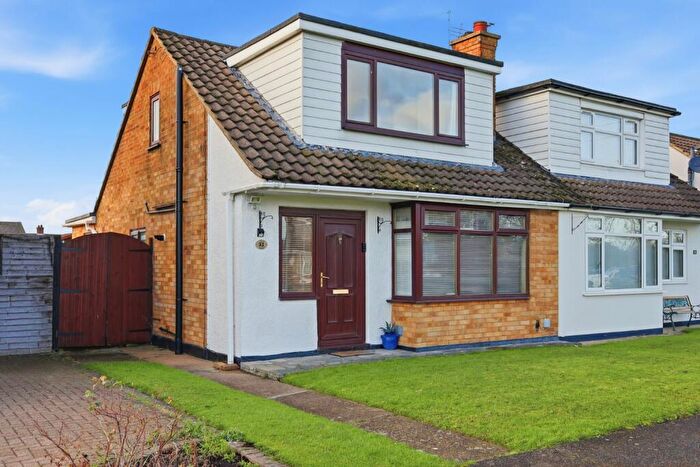
Properties in Corringham And Fobbing have an average house price of £415,758.00 and had 259 Property Transactions within the last 3 years¹.
Corringham And Fobbing is an area in Stanford-le-hope, Thurrock with 2,207 households², where the most expensive property was sold for £1,145,000.00.
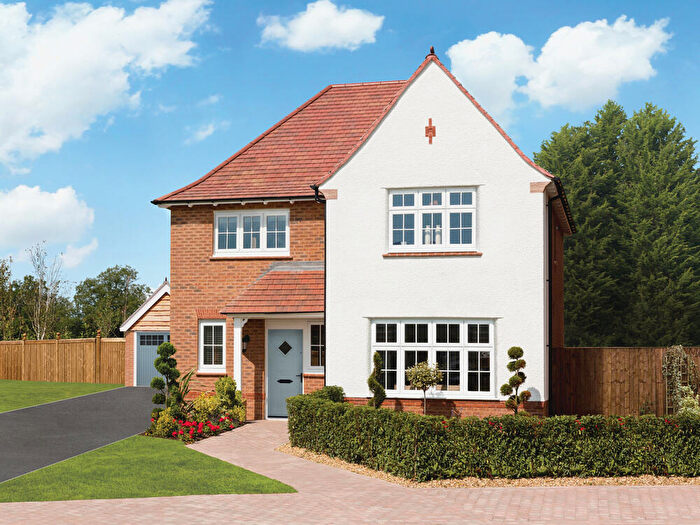
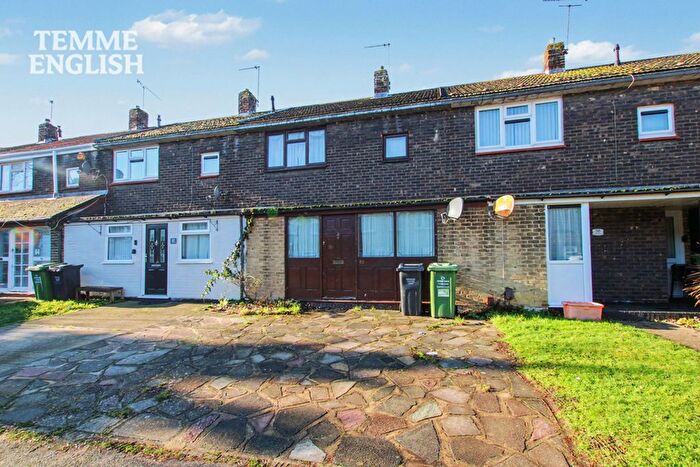
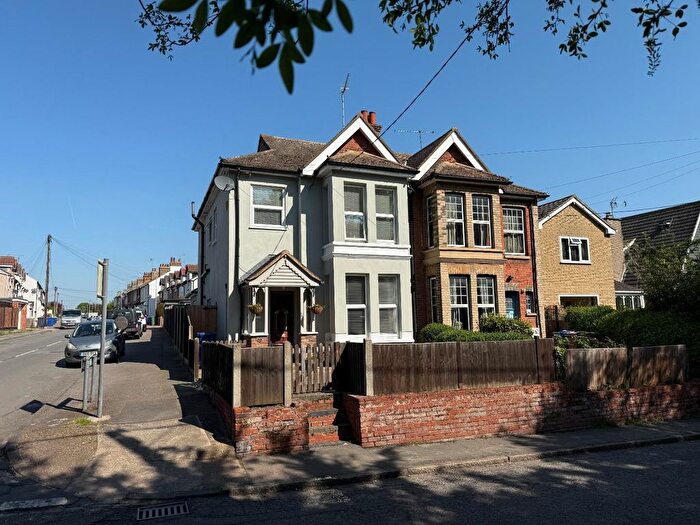
Properties for sale in Corringham And Fobbing
Roads and Postcodes in Corringham And Fobbing
Navigate through our locations to find the location of your next house in Corringham And Fobbing, Stanford-le-hope for sale or to rent.
| Streets | Postcodes |
|---|---|
| Arundel Drive | SS17 7PG |
| Ashway | SS17 9EB |
| Balmoral Avenue | SS17 7PB SS17 7PD |
| Barker Boulevard | SS17 9GA |
| Beechcombe | SS17 9DN |
| Birchwood Road | SS17 9ED |
| Brampton Close | SS17 7NR SS17 7NS |
| Burrs Way | SS17 9DE |
| Carisbrooke Drive | SS17 7PL SS17 7PQ |
| Central Avenue | SS17 7PH SS17 7PJ |
| Chamberlain Avenue | SS17 7NX SS17 7PA |
| Chase Road | SS17 7QH |
| Chestnut Walk | SS17 9EP |
| Church Road | SS17 9AP SS17 9AT SS17 9AW SS17 9AS SS17 9AR |
| Clarence Road | SS17 9BL |
| Digby Road | SS17 9BS SS17 9BT SS17 9BU |
| Edith Way | SS17 9AF |
| Elmstead Close | SS17 9EL |
| Fernside Close | SS17 9EJ |
| Finches Close | SS17 9BX |
| Fobbing Road | SS17 9BG SS17 9BN SS17 9BW |
| Giffords Cross Avenue | SS17 7NH SS17 7NJ SS17 7NL SS17 7NQ |
| Giffords Cross Road | SS17 7QD SS17 7QG SS17 7QQ |
| Gildborne Close | SS17 9JS |
| Glenfield | SS17 9EG |
| Greathouse Chase | SS17 9HU |
| Halston Court | SS17 9BB |
| Harris Close | SS17 7QW |
| Herd Lane | SS17 9BH SS17 9BQ SS17 9BJ |
| High Road | SS17 9HF SS17 9HG SS17 9HN SS17 9HT SS17 9HY SS17 9HZ SS17 9JB SS17 9JD SS17 9JE SS17 9JF SS17 9JH SS17 9JJ SS17 9JA |
| Highland Road | SS17 9HA |
| Hill Terrace | SS17 9BP |
| Inglefield Road | SS17 9HW |
| Kenwood Road | SS17 9AY SS17 9AZ SS17 9BA |
| Kersbrooke Way | SS17 9EH SS17 9EN |
| Kings Terrace | SS17 9HB |
| Laburnum Drive | SS17 7QE SS17 7QF |
| Lampits Hill | SS17 9AA SS17 9AB SS17 9AG SS17 9AH SS17 9AJ SS17 9AL SS17 9AN SS17 9NG SS17 9AQ SS17 9FL |
| Lampits Hill Avenue | SS17 7NY SS17 7NZ |
| Lampits Lane | SS17 9AD SS17 9AE |
| Langdon Way | SS17 9DS |
| Larkfield | SS17 9EA |
| Larkswood Road | SS17 9DD SS17 9DF SS17 9DG |
| Lion Hill | SS17 9JR |
| London Gateway Drive | SS17 9DY |
| Marie Close | SS17 9EX |
| Mill Lane North | SS17 9HP |
| Mill Lane South | SS17 9HS |
| North Sea Crossing | SS17 9ER |
| Oakwood Road | SS17 9AX |
| Ocean Boulevard | SS17 9FD |
| One Tree Hill | SS17 9NH |
| Parkgate Road | SS17 9EU |
| Parkway | SS17 9BY |
| Patricia Drive | SS17 9HR |
| Paynes Cottages | SS17 9JQ |
| Pembroke Avenue | SS17 7PN |
| Priory Mews | SS17 7QN |
| Recreation Avenue | SS17 9BZ |
| Rookery Hill | SS17 9LB |
| Sheldon Close | SS17 9DA |
| Shell Haven | SS17 9LP SS17 9LR |
| Southend Road | SS17 8JT SS17 9ET SS17 9EY SS17 8JS SS17 9HD |
| Thames Crescent | SS17 9DT SS17 9DU SS17 9DZ |
| Thames Haven Road | SS17 7RN |
| The Avenue | SS17 9JG |
| The Hawthorns | SS17 9DB |
| The Manorway | SS17 9FB SS17 9GN SS17 9LA SS17 9LE SS17 9LG SS17 9LL SS17 9LN SS17 9LW |
| Tripat Close | SS17 9JT |
| Vange Bells Corner | SS17 9HE |
| Vincent Close | SS17 7QL |
| Waterworks Lane | SS17 9HX |
| Weydale | SS17 9EE |
| Wharf Road | SS17 9JL SS17 9JN SS17 9JP SS17 9JW |
| Wheatley Road | SS17 9EF SS17 9EQ |
| Windsor Avenue | SS17 7NT SS17 7NU |
| Woodbrooke Way | SS17 9DP SS17 9DR SS17 9DW |
| Woolifers Avenue | SS17 9AU |
| York Avenue | SS17 7NN SS17 7NP |
| SS17 9FJ SS17 9LQ |
Transport near Corringham And Fobbing
- FAQ
- Price Paid By Year
- Property Type Price
Frequently asked questions about Corringham And Fobbing
What is the average price for a property for sale in Corringham And Fobbing?
The average price for a property for sale in Corringham And Fobbing is £415,758. This amount is 12% higher than the average price in Stanford-le-hope. There are 3,443 property listings for sale in Corringham And Fobbing.
What streets have the most expensive properties for sale in Corringham And Fobbing?
The streets with the most expensive properties for sale in Corringham And Fobbing are Inglefield Road at an average of £884,000, Patricia Drive at an average of £805,000 and Windsor Avenue at an average of £627,833.
What streets have the most affordable properties for sale in Corringham And Fobbing?
The streets with the most affordable properties for sale in Corringham And Fobbing are Finches Close at an average of £192,333, The Avenue at an average of £295,000 and Tripat Close at an average of £311,000.
Which train stations are available in or near Corringham And Fobbing?
Some of the train stations available in or near Corringham And Fobbing are Stanford-Le-Hope, Basildon and Pitsea.
Property Price Paid in Corringham And Fobbing by Year
The average sold property price by year was:
| Year | Average Sold Price | Price Change |
Sold Properties
|
|---|---|---|---|
| 2025 | £425,932 | -2% |
49 Properties |
| 2024 | £434,685 | 9% |
85 Properties |
| 2023 | £396,177 | -1% |
59 Properties |
| 2022 | £401,331 | 5% |
66 Properties |
| 2021 | £382,978 | 3% |
107 Properties |
| 2020 | £372,272 | 6% |
75 Properties |
| 2019 | £349,454 | 10% |
77 Properties |
| 2018 | £314,062 | -6% |
79 Properties |
| 2017 | £332,962 | 7% |
95 Properties |
| 2016 | £309,017 | 9% |
82 Properties |
| 2015 | £281,610 | 16% |
89 Properties |
| 2014 | £237,551 | 5% |
94 Properties |
| 2013 | £226,766 | -2% |
90 Properties |
| 2012 | £231,972 | 13% |
63 Properties |
| 2011 | £202,449 | -18% |
50 Properties |
| 2010 | £238,590 | 6% |
44 Properties |
| 2009 | £223,151 | -1% |
43 Properties |
| 2008 | £224,462 | -9% |
56 Properties |
| 2007 | £244,904 | 6% |
101 Properties |
| 2006 | £229,158 | 7% |
88 Properties |
| 2005 | £212,926 | 3% |
79 Properties |
| 2004 | £206,187 | 9% |
102 Properties |
| 2003 | £188,198 | 14% |
104 Properties |
| 2002 | £161,035 | 19% |
99 Properties |
| 2001 | £130,782 | 20% |
100 Properties |
| 2000 | £104,537 | 6% |
70 Properties |
| 1999 | £98,548 | 21% |
91 Properties |
| 1998 | £77,590 | 1% |
93 Properties |
| 1997 | £76,804 | 5% |
83 Properties |
| 1996 | £72,991 | 2% |
77 Properties |
| 1995 | £71,698 | - |
74 Properties |
Property Price per Property Type in Corringham And Fobbing
Here you can find historic sold price data in order to help with your property search.
The average Property Paid Price for specific property types in the last three years are:
| Property Type | Average Sold Price | Sold Properties |
|---|---|---|
| Semi Detached House | £413,924.00 | 154 Semi Detached Houses |
| Detached House | £601,315.00 | 38 Detached Houses |
| Terraced House | £348,489.00 | 50 Terraced Houses |
| Flat | £215,444.00 | 17 Flats |

