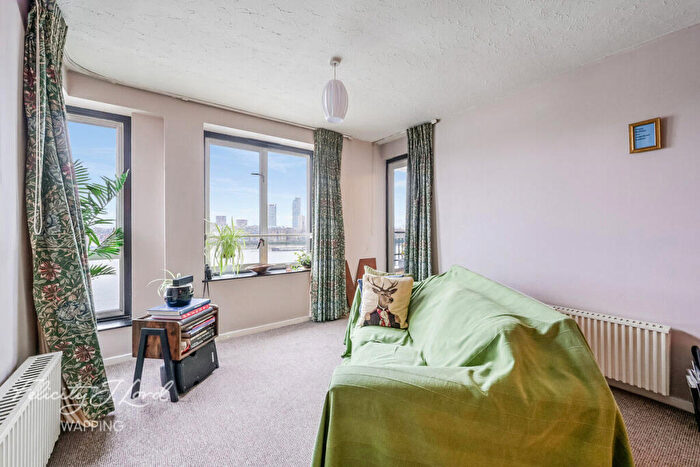
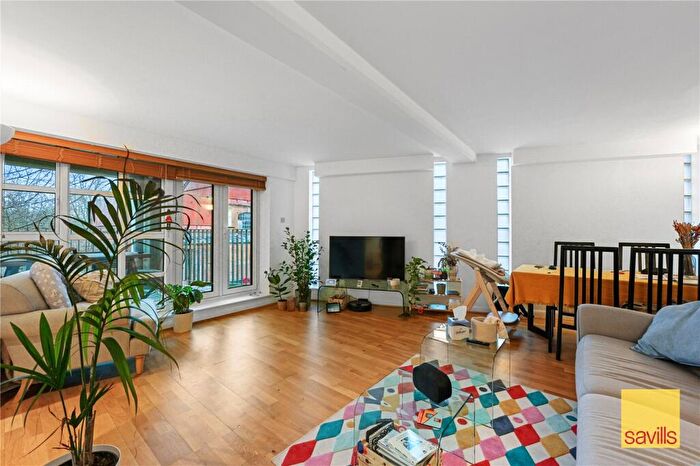
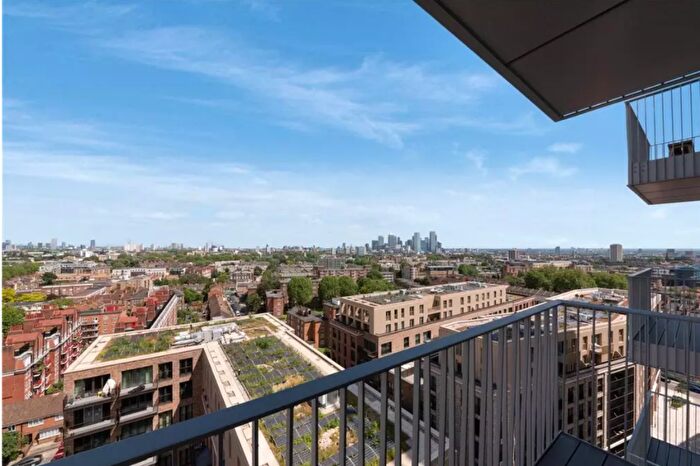
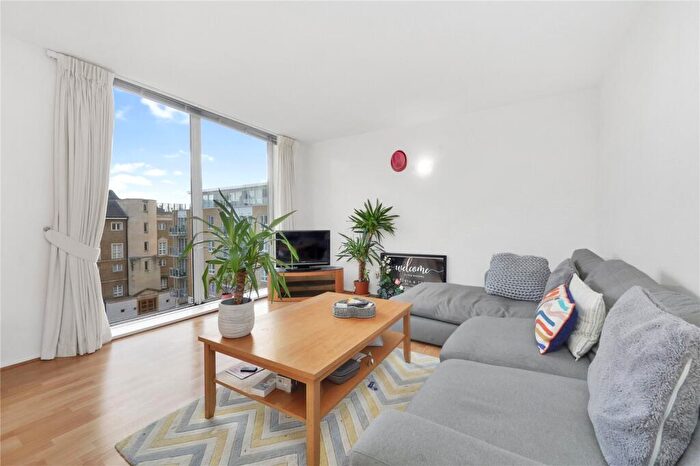
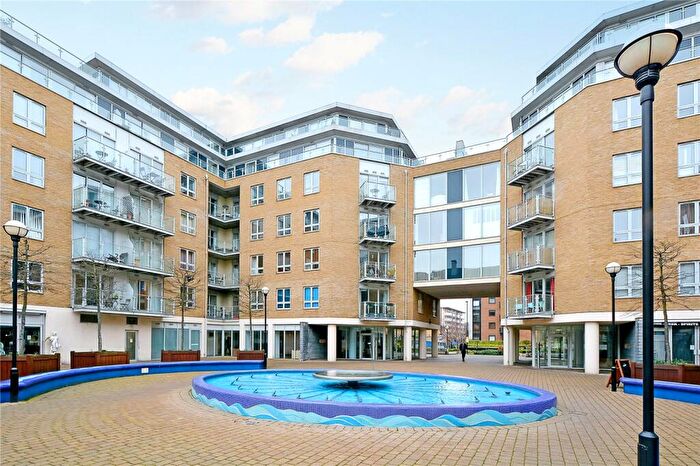
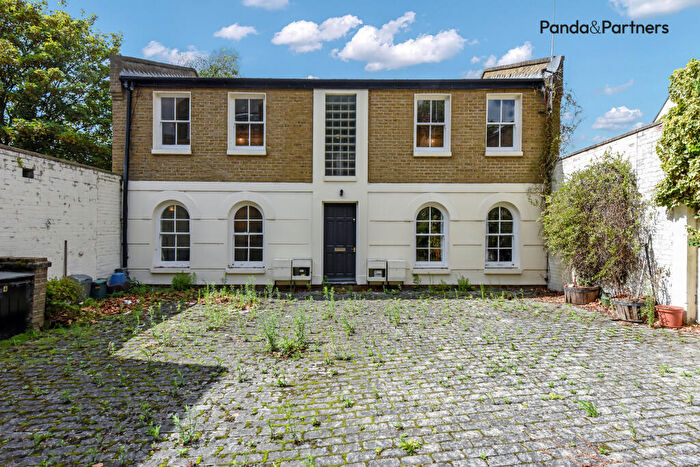
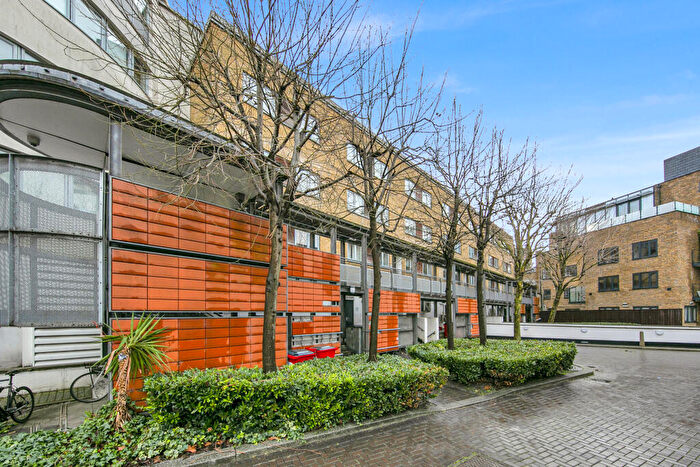
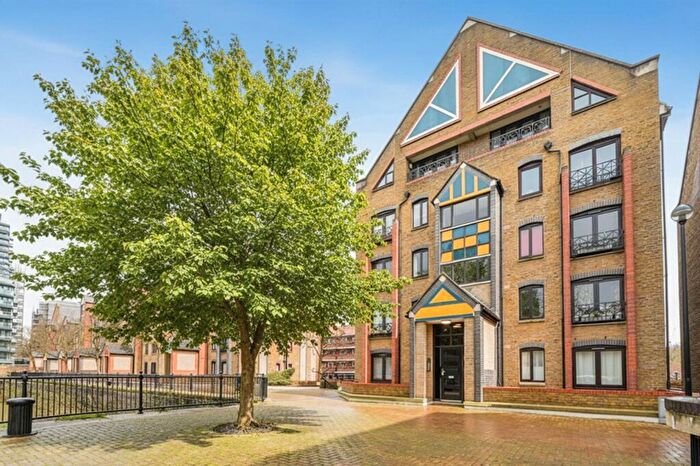
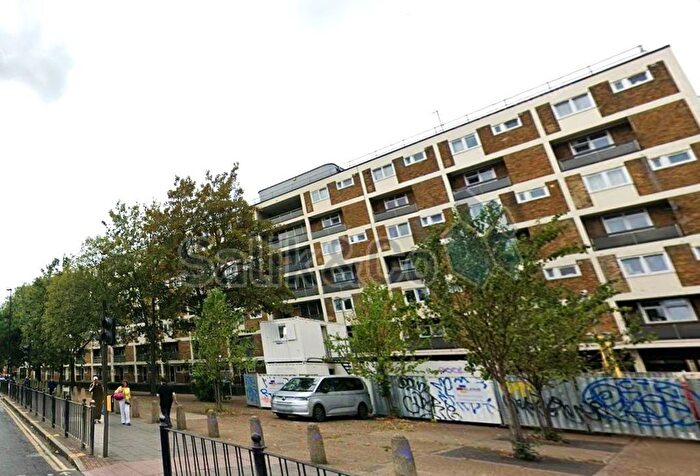
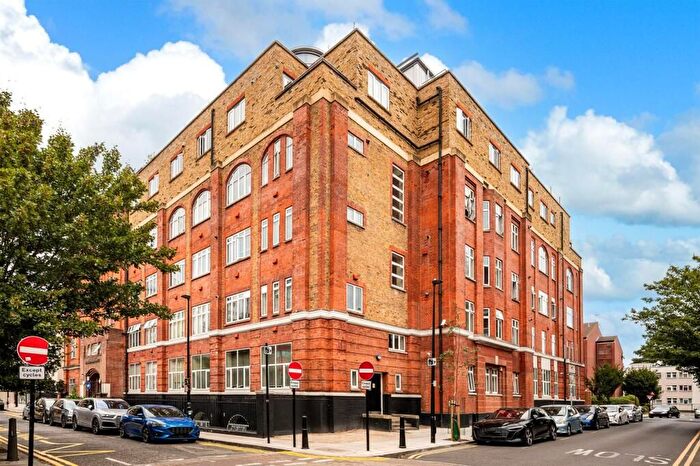
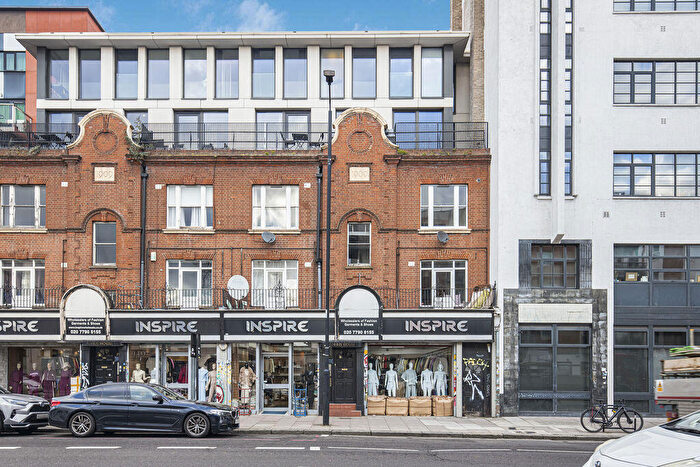
Houses for sale & to rent in Shadwell, London
House Prices in Shadwell
Properties in this part of Shadwell within London have an average house price of £412,000.00 and had 120 Property Transactions within the last 3 years¹. This area has 4,369 households² , where the most expensive property was sold for £1,010,000.00.
Properties for sale in Shadwell
Roads and Postcodes in Shadwell
Navigate through our locations to find the location of your next house in Shadwell, London for sale or to rent.
| Streets | Postcodes |
|---|---|
| Albert Gardens | E1 0LH |
| Angel Mews | E1 0DH |
| Barnardo Gardens | E1 0LN E1 0LW |
| Barnardo Street | E1 0LT |
| Barnett Street | E1 2FE |
| Bekesbourne Street | E14 7JQ |
| Bewley Street | E1 0BS E1 0BT |
| Bigland Street | E1 2ND E1 2NG E1 2PL |
| Boulcott Street | E1 0HR |
| Bower Street | E1 0LD E1 0LE |
| Brodlove Lane | E1W 3DB E1W 3EL E1W 3DA E1W 3DT E1W 3DU E1W 3DW E1W 3DX E1W 3DY E1W 3DZ E1W 3EA |
| Buross Street | E1 2FA |
| Burwell Close | E1 2NT |
| Butcher Row | E14 8DS |
| Cable Street | E1 0AE E1 0AF E1 0AJ E1 0AL E1 0AN E1 0AP E1 0AR E1 0AS E1 0AW E1 0BL E1 0DR E1W 3AG E1W 3DE E1W 3DR E1W 3ER E1W 3EW E1 0AH E1 0BX E1 2QF E1W 3AF E1W 3DP E1W 3EN E1W 3EP E1W 3HB |
| Cannon Street Road | E1 0BH E1 2LH E1 2LF |
| Caroline Street | E1 0JG |
| Chapman Street | E1 2NN E1 2NW E1 2BF |
| Coburg Dwellings | E1 0DZ |
| Commercial Road | E1 0HY E1 0JN E1 0LB E1 0LQ E1 2NB E1 2PY E14 7JD E1 0HX E1 0LR E1 0LS E1 2FB E1 2JR E1 2JT E1 2JY E1 2NX |
| Cornwall Street | E1 2QN E1 2QP E1 2QW E1 2FF |
| Cranford Street | E1W 3HQ |
| Deancross Street | E1 2QS E1 2QA E1 2QR |
| Dellow Street | E1 0BW E1 0BP |
| Devonport Street | E1 0DQ E1 0EA E1 0EF E1 0EG E1 0EL |
| Edward Mann Close East | E1 0JS |
| Edward Mann Close West | E1 0JR |
| Elf Row | E1W 3EH E1W 3AP |
| Fenton Street | E1 2NE |
| Flintlock Close | E1 2FD |
| Frances Wharf | E14 7GA |
| Glamis Place | E1W 3EF E1W 3EJ |
| Glamis Road | E1W 3EB E1W 3ED E1W 3EE E1W 3EG |
| Glasshouse Fields | E1W 3AB E1W 3AD E1W 3AE E1W 3AX E1W 3HD E1W 3HG E1W 3HX E1W 3HY |
| Glastonbury Place | E1 0DS |
| Hainton Close | E1 2QZ |
| Hardinge Street | E1 0EB |
| Havering Street | E1 0LP |
| Hawksmoor Mews | E1 0DG |
| Heckford Street Business Centre | E1W 3HS |
| James Voller Way | E1 2PF E1 2PJ |
| Jane Street | E1 2EX |
| Johnson Street | E1 0AQ E1 0BE E1 0BQ |
| Kinder Street | E1 2LG |
| King David Lane | E1 0DY E1 0EH |
| Lipton Road | E1 0LJ |
| Lowood Street | E1 0BU E1 0DA |
| Lukin Street | E1 0AA E1 0BN |
| Martha Street | E1 2EJ E1 2ER E1 2PA E1 2PG E1 2PX |
| Montpelier Place | E1 0DB |
| Morris Street | E1 2NP |
| Morton Close | E1 2QT |
| Oyster Row | E1 0BG |
| Philpot Street | E1 2FG |
| Pique Mews | E1W 3AW |
| Pitsea Street | E1 0JH E1 0JJ E1 0JL |
| Rampart Street | E1 2LA E1 2LS |
| Ratcliffe Cross Street | E1 0HS E1 0FD E1 0FE |
| Ratcliffe Lane | E14 7JF E14 7JH E14 7JE |
| Redcastle Close | E1W 3DQ |
| Richard Street | E1 2JP |
| Ronald Street | E1 0DT E1 0DU |
| Sage Street | E1 0BY E1 0BZ E1 0DD |
| School Mews | E1 0EW |
| Schoolhouse Lane | E1W 3AJ E1W 3AH |
| Shadwell Gardens | E1 2QG E1 2QH E1 2QJ E1 2QL E1 2QQ |
| Sly Street | E1 2BE |
| Solander Gardens | E1 0DF E1 0DN E1 0DW E1 0DE |
| Spencer Way | E1 2PN E1 2PW |
| Steels Lane | E1 0DP |
| Stepney Causeway | E1 0JP E1 0JW |
| Sutton Street | E1 0AU E1 0AX E1 0BB E1 0AG E1 0AY E1 0BD |
| Tait Street | E1 2NR |
| Tarbert Walk | E1 0ED E1 0EE |
| Tarling Street | E1 0AD E1 0AZ E1 0BA E1 0BF E1 2PD E1 2PE E1 0AT E1 2PU |
| The Highway | E1W 3HT E1W 3BB E1W 3BP E1W 3HJ E1W 3HN E1W 3HP |
| The Highway Trading Centre | E1W 3HR |
| Tillman Street | E1 2NH E1 2NL E1 2NQ |
| Walburgh Street | E1 2NJ E1 2NF |
| Warren Place | E1 0JQ |
| Watney Market | E1 2QX E1 2QY E1 2PP E1 2PR |
| Watney Street | E1 2QE E1 2QU E1 2QD |
| E1 0LL E1 2PH E1 2QB |
Transport near Shadwell
-
Shadwell Station
-
Limehouse Station
-
Wapping Station
-
Whitechapel Station
-
Rotherhithe Station
-
Stepney Green Station
-
Bethnal Green Station
-
Aldgate East Station
-
Canada Water Station
-
Tower Gateway Station
- FAQ
- Price Paid By Year
- Property Type Price
Frequently asked questions about Shadwell
What is the average price for a property for sale in Shadwell?
The average price for a property for sale in Shadwell is £412,000. This amount is 21% lower than the average price in London. There are 6,060 property listings for sale in Shadwell.
What streets have the most expensive properties for sale in Shadwell?
The streets with the most expensive properties for sale in Shadwell are Rampart Street at an average of £796,785, School Mews at an average of £705,333 and Johnson Street at an average of £636,571.
What streets have the most affordable properties for sale in Shadwell?
The streets with the most affordable properties for sale in Shadwell are Bigland Street at an average of £242,500, Edward Mann Close West at an average of £246,000 and Tarling Street at an average of £279,083.
Which train stations are available in or near Shadwell?
Some of the train stations available in or near Shadwell are Shadwell, Limehouse and Wapping.
Which tube stations are available in or near Shadwell?
Some of the tube stations available in or near Shadwell are Whitechapel, Stepney Green and Aldgate East.
Property Price Paid in Shadwell by Year
The average sold property price by year was:
| Year | Average Sold Price | Price Change |
Sold Properties
|
|---|---|---|---|
| 2025 | £387,257 | -19% |
33 Properties |
| 2024 | £459,251 | 17% |
45 Properties |
| 2023 | £380,815 | -17% |
42 Properties |
| 2022 | £446,560 | 9% |
54 Properties |
| 2021 | £406,136 | -16% |
55 Properties |
| 2020 | £472,085 | 19% |
57 Properties |
| 2019 | £380,739 | 9% |
55 Properties |
| 2018 | £348,110 | -13% |
52 Properties |
| 2017 | £394,751 | -7% |
59 Properties |
| 2016 | £423,379 | 8% |
104 Properties |
| 2015 | £389,305 | 18% |
90 Properties |
| 2014 | £321,131 | 2% |
119 Properties |
| 2013 | £315,879 | 13% |
110 Properties |
| 2012 | £275,457 | -21% |
64 Properties |
| 2011 | £331,944 | 21% |
86 Properties |
| 2010 | £262,080 | 9% |
54 Properties |
| 2009 | £238,025 | -11% |
20 Properties |
| 2008 | £263,707 | 7% |
81 Properties |
| 2007 | £245,768 | 10% |
143 Properties |
| 2006 | £220,260 | 11% |
171 Properties |
| 2005 | £195,442 | 5% |
98 Properties |
| 2004 | £185,347 | 6% |
170 Properties |
| 2003 | £173,743 | 2% |
67 Properties |
| 2002 | £170,062 | 9% |
78 Properties |
| 2001 | £154,240 | 13% |
108 Properties |
| 2000 | £134,088 | 19% |
81 Properties |
| 1999 | £109,255 | 38% |
67 Properties |
| 1998 | £68,145 | -8% |
36 Properties |
| 1997 | £73,873 | -3% |
46 Properties |
| 1996 | £75,843 | 34% |
43 Properties |
| 1995 | £49,837 | - |
20 Properties |
Property Price per Property Type in Shadwell
Here you can find historic sold price data in order to help with your property search.
The average Property Paid Price for specific property types in the last three years are:
| Property Type | Average Sold Price | Sold Properties |
|---|---|---|
| Flat | £390,757.00 | 111 Flats |
| Terraced House | £674,000.00 | 9 Terraced Houses |

