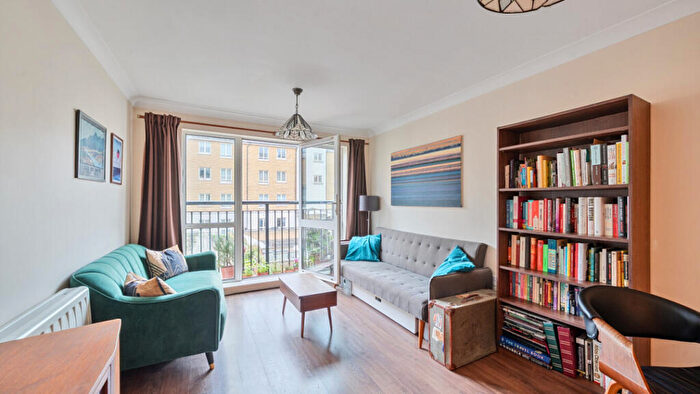
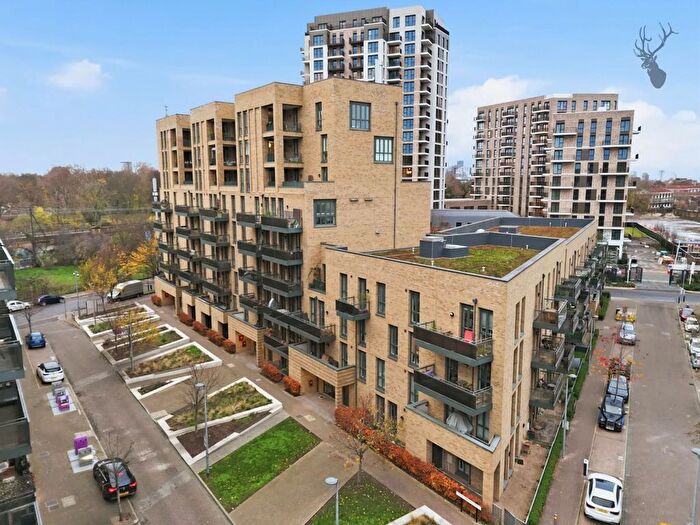
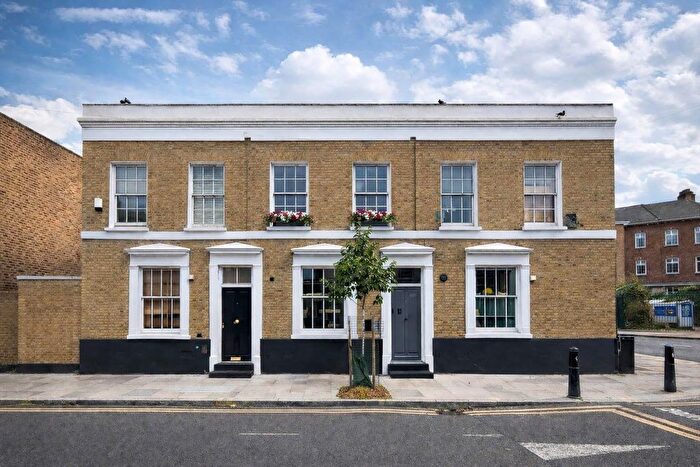
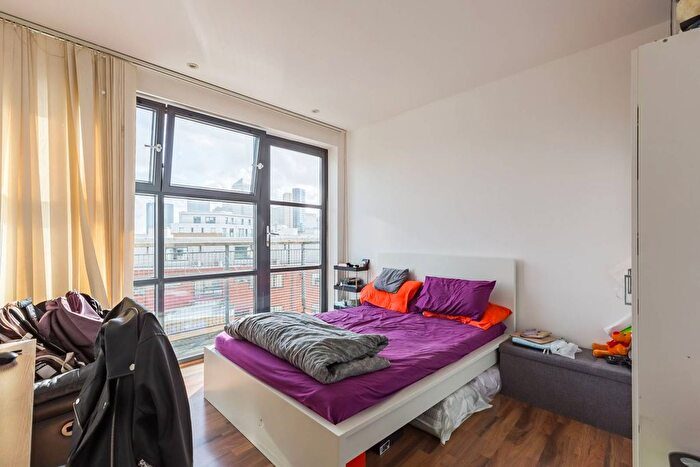
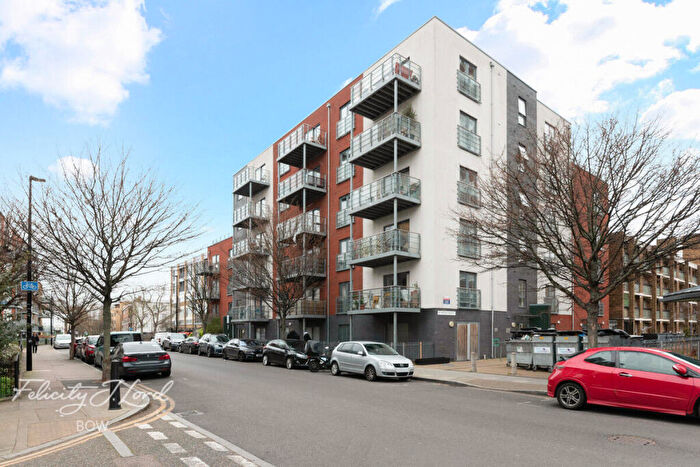
Houses for sale & to rent in St Dunstan's, London
House Prices in St Dunstan's
Properties in this part of St Dunstan's within London have an average house price of £411,212.00 and had 27 Property Transactions within the last 3 years¹. This area has 527 households² , where the most expensive property was sold for £795,000.00.
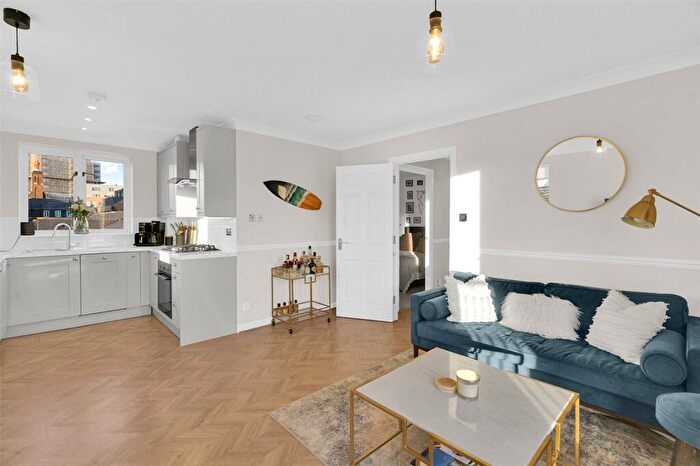
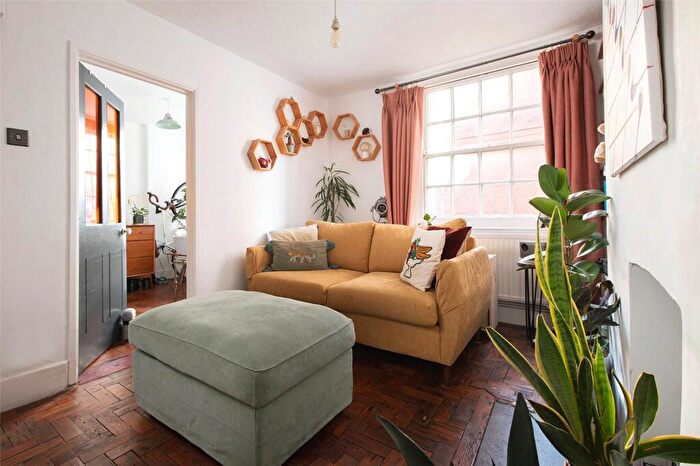
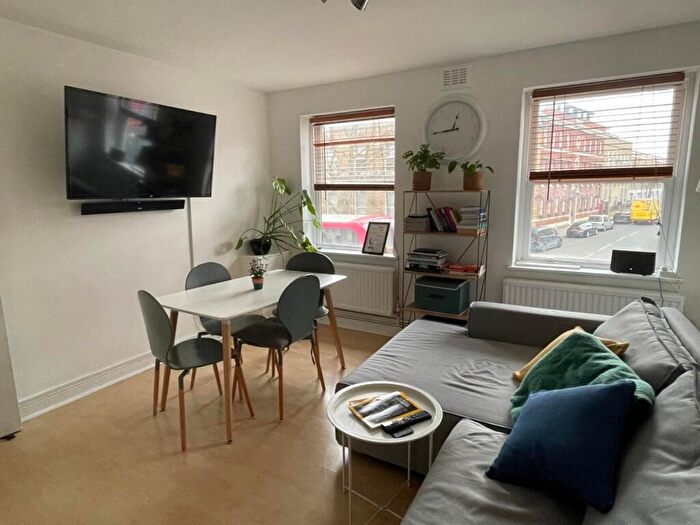
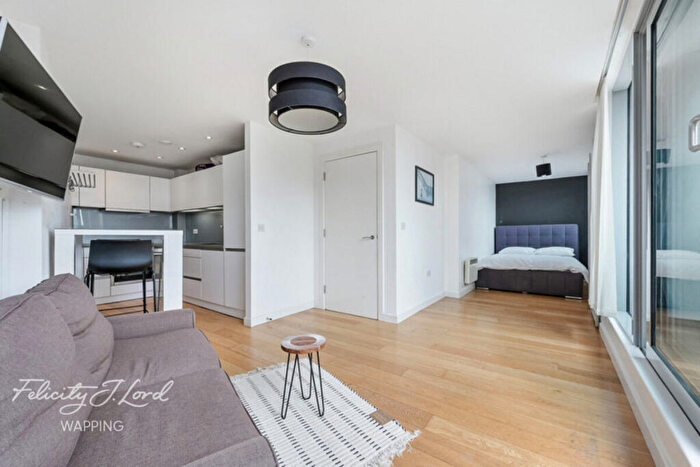
Properties for sale in St Dunstan's
Roads and Postcodes in St Dunstan's
Navigate through our locations to find the location of your next house in St Dunstan's, London for sale or to rent.
| Streets | Postcodes |
|---|---|
| Aston Street | E14 7UJ E14 7UP E14 7UQ |
| Bale Road | E1 4QJ |
| Batten Cottages | E14 7QP |
| Beaufort Gardens | E1 3DQ E1 3FA |
| Beaumont Square | E1 4NA E1 4NL |
| Belgrave Street | E1 0NS |
| Ben Johnson Road | E1 3NN |
| Ben Jonson Road | E1 3FQ E1 4QH E1 4SD |
| Bermuda Way | E1 4GD |
| Blount Street | E14 7BZ E14 7RL |
| Bohn Road | E1 4QP |
| Brenton Street | E14 7PY |
| Brunton Place | E14 7LL |
| Camdenhurst Street | E14 7NB |
| Canal Close | E1 4PB |
| Carmelo Mews | E1 4GH |
| Carr Street | E14 7FD E14 7RH |
| Coltman Street | E14 7BP E14 7LN |
| Commodore Street | E1 4PF |
| Conder Street | E14 7ND |
| Dakin Place | E1 0NZ |
| Duckett Street | E1 4FY E1 4SW E1 4TD |
| Eastfield Street | E14 7RE |
| Ernest Street | E1 4SE E1 4SN |
| Frank Whipple Place | E14 7LQ E14 7NZ |
| Halley Street | E14 7BQ E14 7SS |
| Harford Street | E1 4FG E1 4FU E1 4PZ E1 4SH |
| Jamuna Close | E14 7RF |
| Killick Way | E1 3FD E1 3FH E1 3FJ E1 3FL E1 3FN E1 3FP |
| Krupa Mews | E14 7XY |
| Maroon Street | E14 7BS E14 7GX E14 7RG E14 7RQ |
| Masters Street | E1 3NP |
| Mile End Road | E1 4GG E1 4RQ |
| Monsey Place | E1 4GN |
| Ocean Street | E1 4TH |
| Oman Way | E14 7UR |
| Pechora Way | E14 7UL E14 7UN |
| Repton Street | E14 7BH E14 7BX E14 7FU |
| Salmon Lane | E14 7PR |
| Shandy Street | E1 3FR E1 3FS E1 3FT E1 4ST |
| Shaw Crescent | E14 7BF |
| Solebay Street | E1 4PN E1 4PW |
| Solomon Way | E1 0FA |
| St Pauls Way | E3 4AQ |
| Stepney High Street | E1 0NR |
| Toby Lane | E1 4DN E1 4DP E1 4DW |
| Wakeling Street | E14 7NS |
| White Horse Lane | E1 3FX E1 3FZ E1 3NR |
| White Horse Road | E1 0NE E1 0NN |
| White Tower Way | E1 4RN |
| Yorkshire Road | E14 7LP |
| E14 7LR E14 7PU |
Transport near St Dunstan's
-
Limehouse Station
-
Stepney Green Station
-
Mile End Station
-
Westferry Station
-
Whitechapel Station
-
Bow Road Station
-
Shadwell Station
-
Bethnal Green Station
-
Devons Road Station
-
Langdon Park Station
- FAQ
- Price Paid By Year
- Property Type Price
Frequently asked questions about St Dunstan's
What is the average price for a property for sale in St Dunstan's?
The average price for a property for sale in St Dunstan's is £411,212. This amount is 22% lower than the average price in London. There are 5,979 property listings for sale in St Dunstan's.
What streets have the most expensive properties for sale in St Dunstan's?
The streets with the most expensive properties for sale in St Dunstan's are Batten Cottages at an average of £795,000, Shaw Crescent at an average of £575,000 and White Horse Lane at an average of £571,000.
What streets have the most affordable properties for sale in St Dunstan's?
The streets with the most affordable properties for sale in St Dunstan's are Bermuda Way at an average of £229,500, Frank Whipple Place at an average of £318,535 and Aston Street at an average of £411,142.
Which train stations are available in or near St Dunstan's?
Some of the train stations available in or near St Dunstan's are Limehouse, Whitechapel and Shadwell.
Which tube stations are available in or near St Dunstan's?
Some of the tube stations available in or near St Dunstan's are Stepney Green, Mile End and Whitechapel.
Property Price Paid in St Dunstan's by Year
The average sold property price by year was:
| Year | Average Sold Price | Price Change |
Sold Properties
|
|---|---|---|---|
| 2025 | £552,500 | 26% |
8 Properties |
| 2024 | £410,000 | 8% |
8 Properties |
| 2023 | £379,083 | 25% |
3 Properties |
| 2022 | £283,187 | -41% |
8 Properties |
| 2021 | £398,642 | -1% |
7 Properties |
| 2020 | £402,642 | -16% |
19 Properties |
| 2019 | £466,910 | 25% |
28 Properties |
| 2018 | £350,000 | -100% |
1 Property |
| 2017 | £700,000 | 31% |
1 Property |
| 2016 | £483,460 | 19% |
11 Properties |
| 2015 | £389,880 | -6% |
17 Properties |
| 2014 | £412,600 | 22% |
5 Properties |
| 2013 | £320,000 | -5% |
1 Property |
| 2012 | £335,000 | 43% |
1 Property |
| 2011 | £192,000 | -53% |
1 Property |
| 2006 | £294,000 | 83% |
4 Properties |
| 2002 | £49,000 | -145% |
1 Property |
| 2000 | £120,000 | 70% |
1 Property |
| 1996 | £36,000 | -64% |
2 Properties |
| 1995 | £59,000 | - |
1 Property |
Property Price per Property Type in St Dunstan's
Here you can find historic sold price data in order to help with your property search.
The average Property Paid Price for specific property types in the last three years are:
| Property Type | Average Sold Price | Sold Properties |
|---|---|---|
| Terraced House | £685,000.00 | 2 Terraced Houses |
| Flat | £389,310.00 | 25 Flats |

