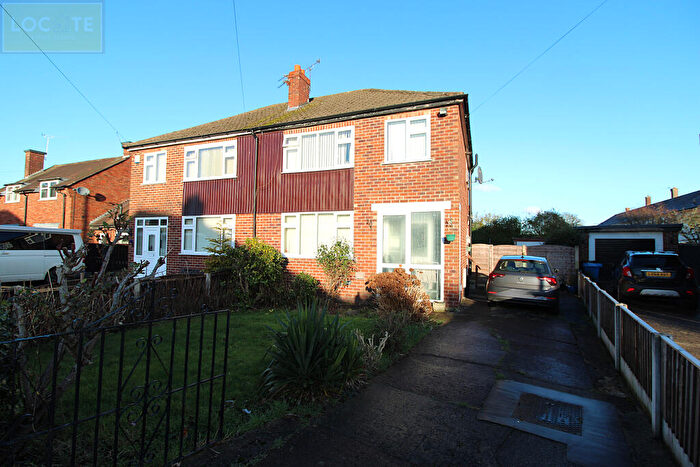
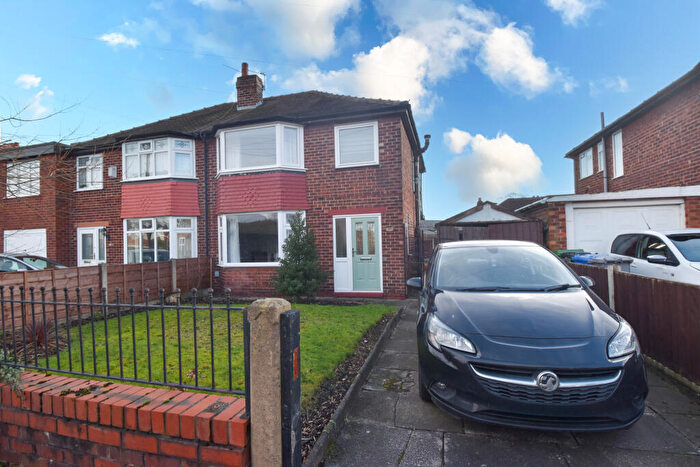
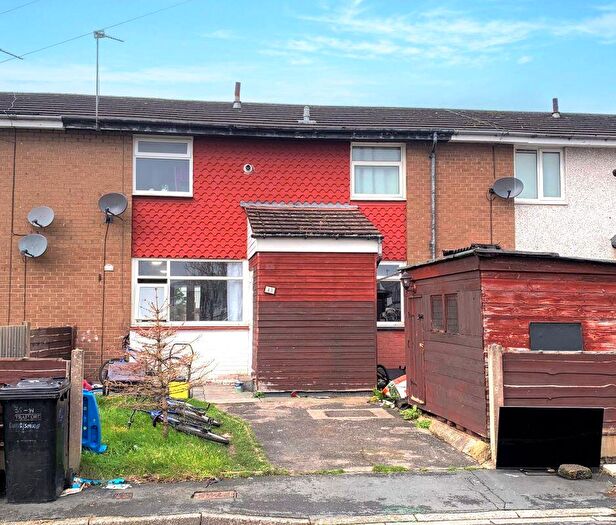
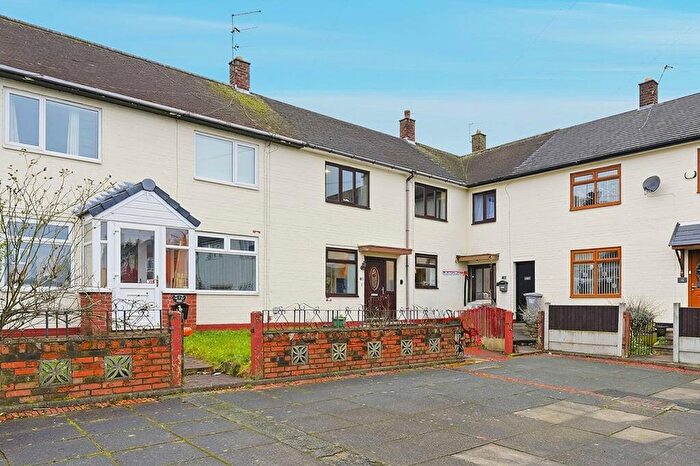
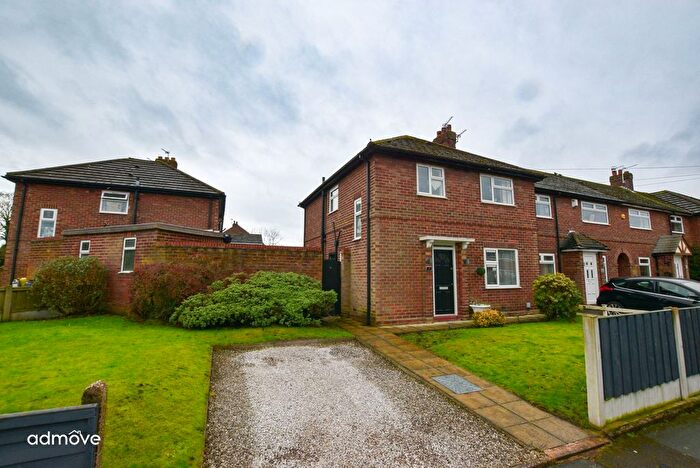
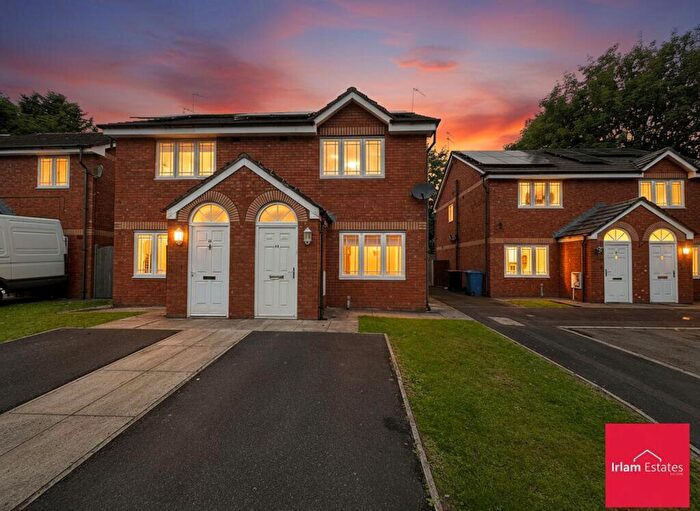
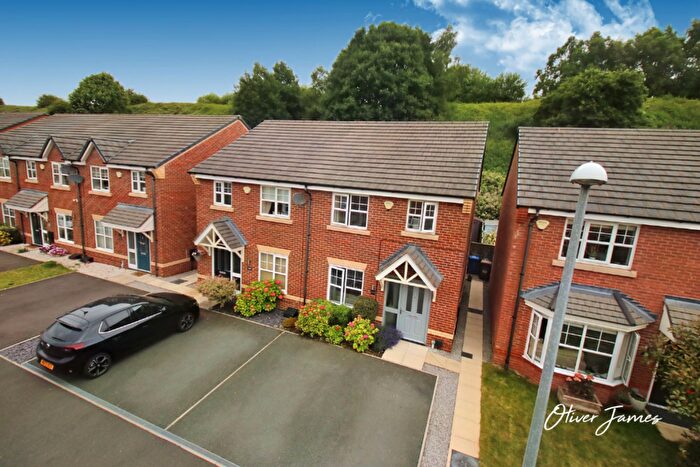
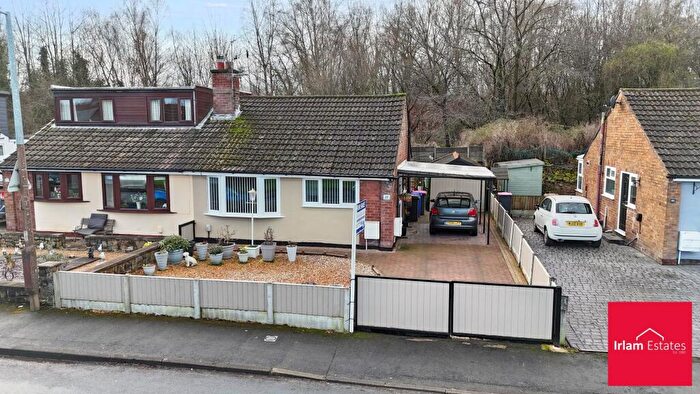
Houses for sale & to rent in Bowdon, Lymm
House Prices in Bowdon
Properties in Bowdon have an average house price of £714,193.00 and had 11 Property Transactions within the last 3 years¹.
Bowdon is an area in Lymm, Trafford with 138 households², where the most expensive property was sold for £1,025,000.00.
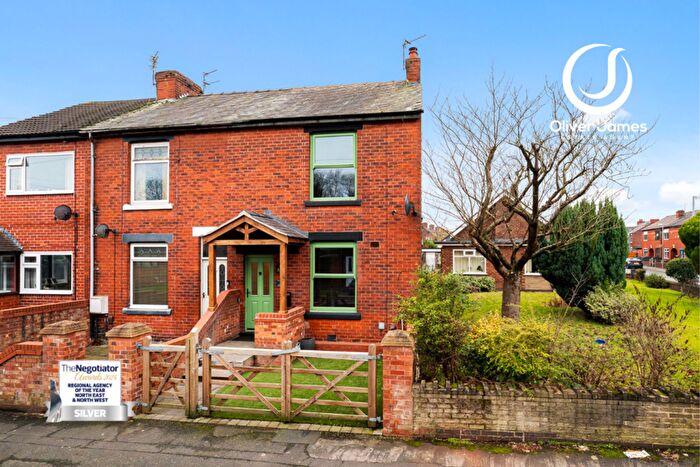
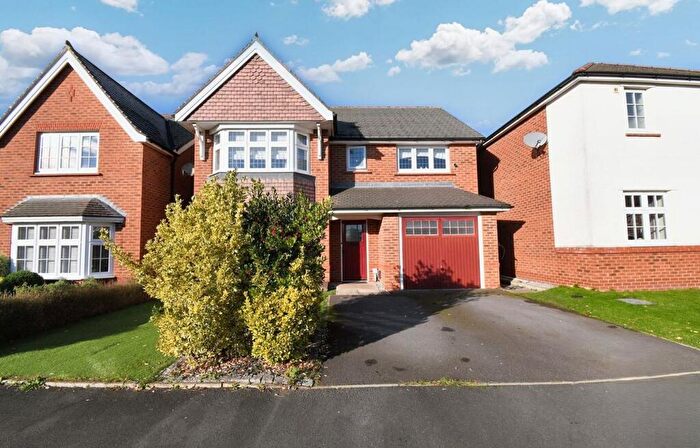
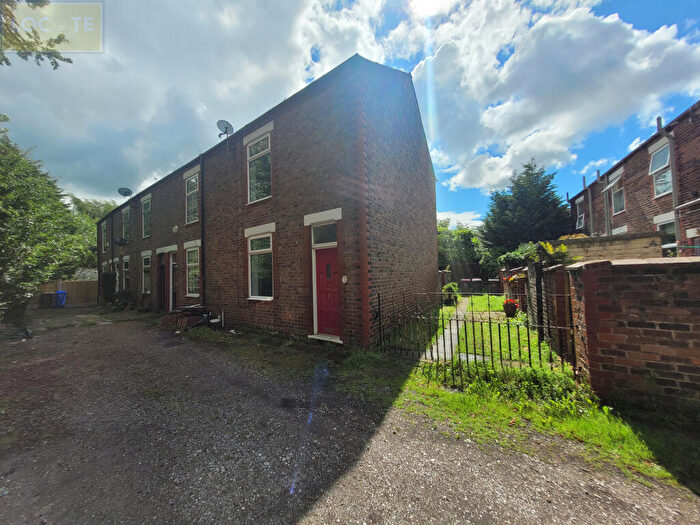
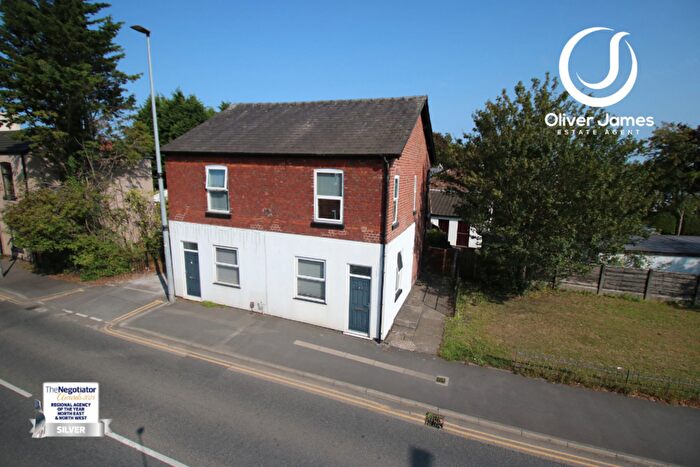
Properties for sale in Bowdon
Roads and Postcodes in Bowdon
Navigate through our locations to find the location of your next house in Bowdon, Lymm for sale or to rent.
| Streets | Postcodes |
|---|---|
| Barns Lane | WA13 9UG |
| Beckett Drive | WA13 9TA |
| Bent Lane | WA13 9TQ |
| Bridge Road | WA13 9ST |
| Carr Green Lane | WA13 9UL WA13 9UN |
| Church Green | WA13 9SS |
| Dunham Road | WA13 9UH WA13 9UQ WA13 9UT WA13 9UZ WA13 9UU WA13 9UX WA13 9UY WA14 4SN |
| Egerton Avenue | WA13 9TD |
| Gorsey Lane | WA13 9UA WA13 9UB |
| Moss Brow | WA13 9TL WA13 9TJ |
| Mosslane | WA13 9TU WA13 9TX |
| Paddock Lane | WA13 9TE WA13 9TG WA13 9SZ WA13 9TH |
| Park Road | WA13 9SU WA13 9SY |
| Sawpit Street | WA13 9UE WA13 9UF |
| Top Park Close | WA13 9NZ |
| Townfield Lane | WA13 9SR |
| Warburton Lane | WA13 9TN WA13 9TP WA13 9TT WA13 9TW WA13 9TR WA13 9TS |
| Werburgh Close | WA13 9GF |
| Wigsey Lane | WA13 9JL |
Transport near Bowdon
-
Glazebrook Station
-
Irlam Station
-
Flixton Station
-
Birchwood Station
-
Altrincham Station
-
Navigation Road Station
-
Hale Station
-
Chassen Road Station
-
Urmston Station
-
Padgate Station
- FAQ
- Price Paid By Year
- Property Type Price
Frequently asked questions about Bowdon
What is the average price for a property for sale in Bowdon?
The average price for a property for sale in Bowdon is £714,193. There are 821 property listings for sale in Bowdon.
What streets have the most expensive properties for sale in Bowdon?
The streets with the most expensive properties for sale in Bowdon are Dunham Road at an average of £1,025,000, Gorsey Lane at an average of £935,000 and Mosslane at an average of £777,265.
What streets have the most affordable properties for sale in Bowdon?
The streets with the most affordable properties for sale in Bowdon are Paddock Lane at an average of £238,050, Warburton Lane at an average of £575,000 and Townfield Lane at an average of £640,000.
Which train stations are available in or near Bowdon?
Some of the train stations available in or near Bowdon are Glazebrook, Irlam and Flixton.
Property Price Paid in Bowdon by Year
The average sold property price by year was:
| Year | Average Sold Price | Price Change |
Sold Properties
|
|---|---|---|---|
| 2025 | £732,718 | 75% |
7 Properties |
| 2024 | £181,100 | -369% |
1 Property |
| 2023 | £848,666 | 55% |
3 Properties |
| 2022 | £385,000 | -37% |
1 Property |
| 2021 | £527,000 | -27% |
7 Properties |
| 2020 | £669,142 | 35% |
7 Properties |
| 2019 | £437,138 | 15% |
4 Properties |
| 2018 | £371,250 | 27% |
2 Properties |
| 2017 | £272,500 | -63% |
2 Properties |
| 2016 | £443,700 | -20% |
5 Properties |
| 2015 | £533,707 | 35% |
7 Properties |
| 2014 | £348,500 | 70% |
2 Properties |
| 2013 | £105,000 | -219% |
1 Property |
| 2012 | £335,150 | 72% |
5 Properties |
| 2010 | £95,000 | -404% |
1 Property |
| 2009 | £479,250 | -0,5% |
4 Properties |
| 2008 | £481,609 | 0,1% |
9 Properties |
| 2007 | £481,314 | -16% |
7 Properties |
| 2006 | £560,000 | 13% |
6 Properties |
| 2005 | £485,000 | 10% |
1 Property |
| 2004 | £438,375 | 46% |
4 Properties |
| 2003 | £236,666 | -53% |
9 Properties |
| 2002 | £362,270 | 31% |
5 Properties |
| 2001 | £250,000 | 38% |
1 Property |
| 2000 | £155,000 | -20% |
2 Properties |
| 1999 | £185,262 | 11% |
4 Properties |
| 1998 | £164,071 | 35% |
7 Properties |
| 1997 | £107,000 | 32% |
5 Properties |
| 1996 | £72,475 | -31% |
2 Properties |
| 1995 | £94,666 | - |
3 Properties |
Property Price per Property Type in Bowdon
Here you can find historic sold price data in order to help with your property search.
The average Property Paid Price for specific property types in the last three years are:
| Property Type | Average Sold Price | Sold Properties |
|---|---|---|
| Detached House | £820,003.00 | 9 Detached Houses |
| Terraced House | £238,050.00 | 2 Terraced Houses |

