
Houses for sale in Trafford, England
House Prices in Trafford
Properties in Trafford have
an average house price of
£432k
and had 9,565 Property Transactions
within the last 3 years.¹
Trafford is a location in
England with
96,415 households², where the most expensive property was sold for £7M.
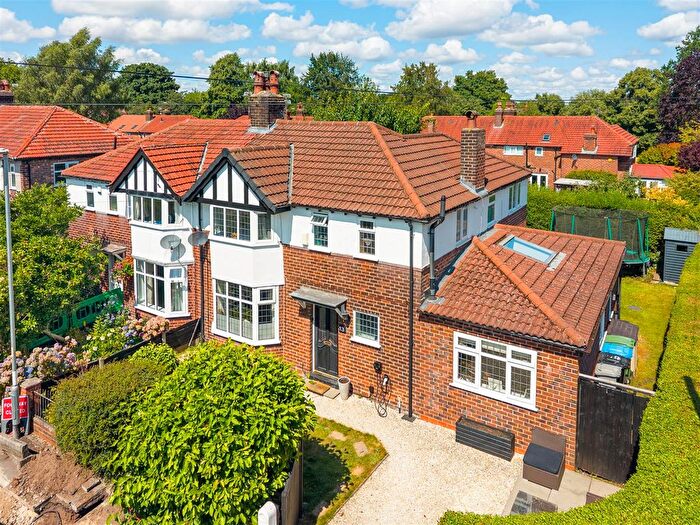
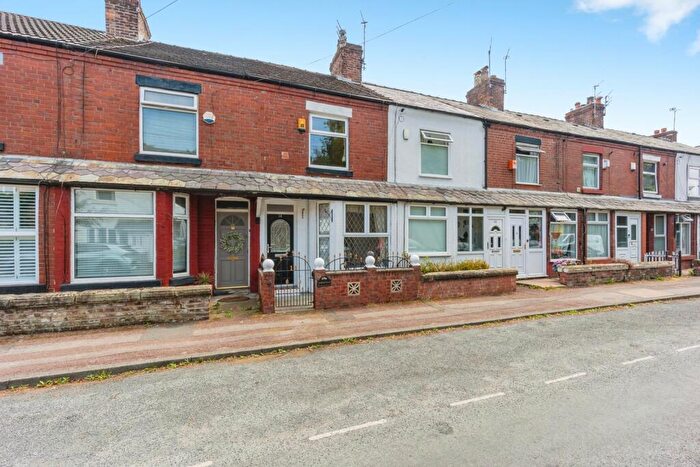
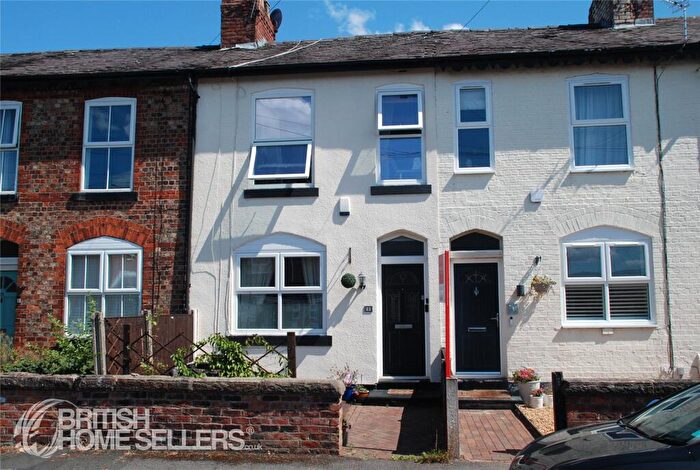
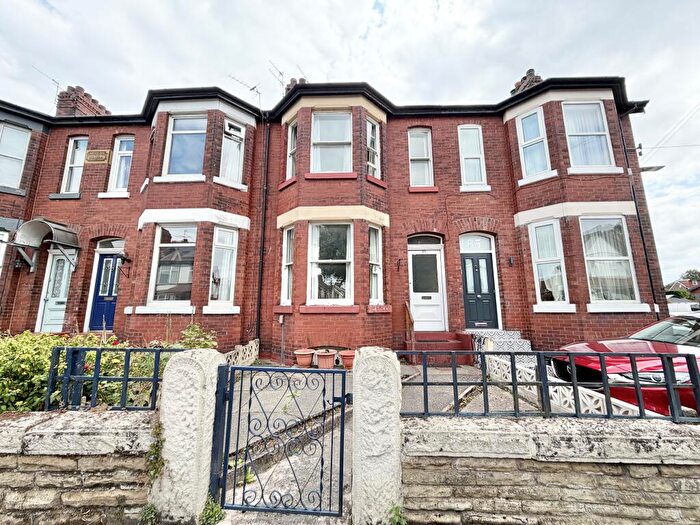
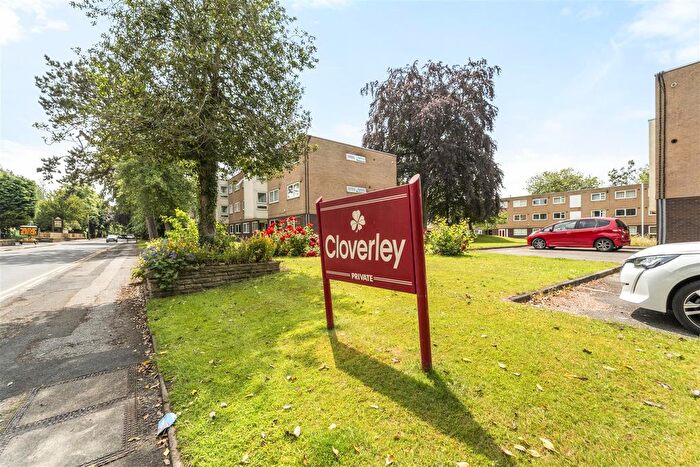
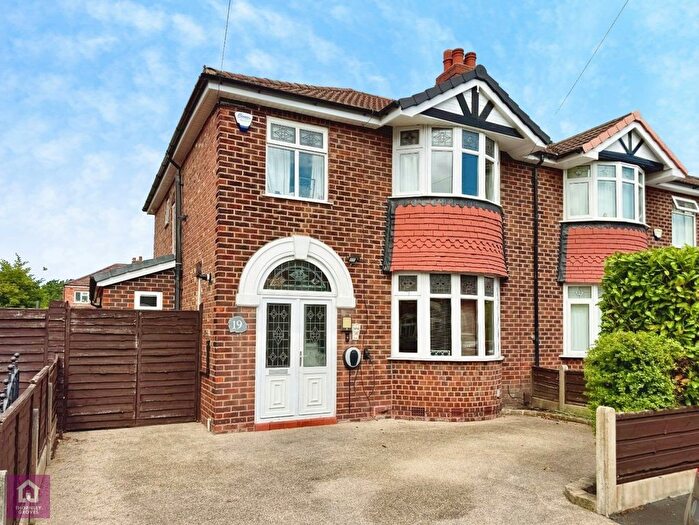
Properties for sale in Trafford
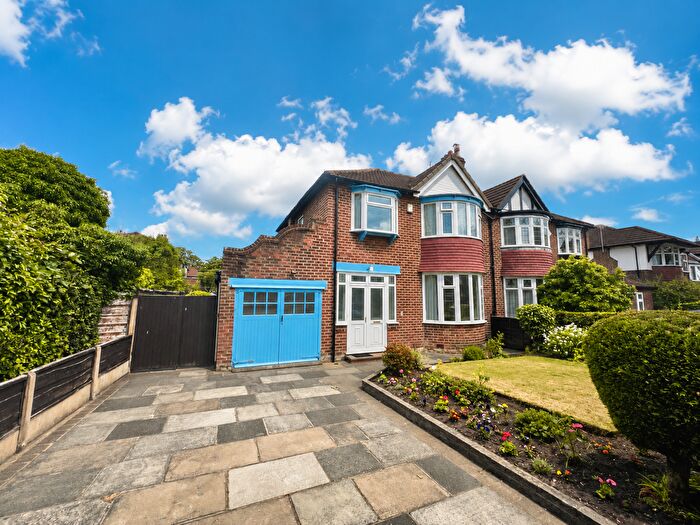
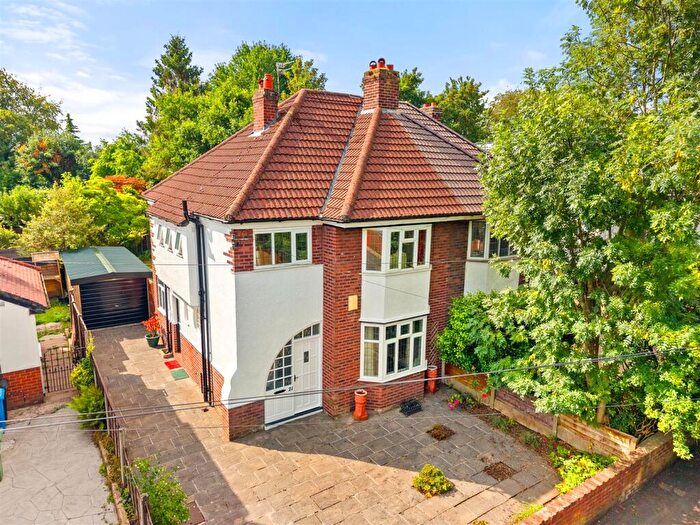
![]()
If you are looking to sell your house, let it out, or receive a property valuation, an expert can help you.
Click the button below to get started.


Towns in Trafford
Navigate through our locations to find the location of your next house in Trafford, England for sale or to rent.
Property price trends in Trafford
According to the latest Land Registry data, the average home in Trafford sold for £417,109 in 2026. That figure comes from a substantial record of 119,024 sales logged over the past 31 years.
Prices have softened over the last three years. Compared with 2023, when the typical sale came in around £429,579, that's a fall of roughly 2.9%.
Looking back five years, average prices are up about 6.4% since 2021, a gain of around £25,171 in cash terms.
Zoom out to the past decade for the fuller picture. Back in 2016, homes here averaged £293,440, so the typical sold price has climbed about 42.1% since then, roughly 3.6% a year. Stretch the view to fifteen years and that annual pace holds at about 3.6%.
Frequently asked questions about Trafford
What is the average price for a property for sale in Trafford?
The average price for a property for sale in Trafford is £431,533. This amount is 20% higher than the average price in England. There are more than 10,000 property listings for sale in Trafford.
What locations have the most expensive properties for sale in Trafford?
The locations with the most expensive properties for sale in Trafford are Lymm at an average of £687,635 and Altrincham at an average of £566,381.
What locations have the most affordable properties for sale in Trafford?
The locations with the most affordable properties for sale in Trafford are Manchester at an average of £313,386 and Sale at an average of £397,192.
Which train stations are available in or near Trafford?
Some of the train stations available in or near Trafford are Navigation Road, Urmston and Chassen Road.
Property Price Paid in Trafford by Year
The average sold property price by year was:
| Year | Average Sold Price | Price Change |
Sold Properties
|
|---|---|---|---|
| 2026 | £417,109 | -5% |
552 Properties |
| 2025 | £438,913 | 2% |
3,133 Properties |
| 2024 | £428,414 | -0,3% |
3,151 Properties |
| 2023 | £429,579 | -0,1% |
2,729 Properties |
| 2022 | £430,114 | 9% |
3,350 Properties |
| 2021 | £391,938 | 8% |
4,641 Properties |
| 2020 | £362,460 | 9% |
3,094 Properties |
| 2019 | £329,038 | 2% |
3,731 Properties |
| 2018 | £321,904 | 2% |
3,983 Properties |
| 2017 | £314,079 | 7% |
4,030 Properties |
Property Price per Property Type in Trafford
Here you can find historic sold price data in order to help with your property search.
The average Property Paid Price for specific property types in the last three years are:
| Property Type | Average Sold Price | Sold Properties |
|---|---|---|
| Semi Detached House | £431,398.00 | 3,971 Semi Detached Houses |
| Terraced House | £350,428.00 | 2,561 Terraced Houses |
| Detached House | £823,697.00 | 1,375 Detached Houses |
| Flat | £231,906.00 | 1,658 Flats |
Transport in Trafford
Please see below transportation links in this area:
