
Houses for sale & to rent in WF11 0JY, Ridgeway Square, Knottingley, Knottingley
House Prices in WF11 0JY, Ridgeway Square, Knottingley
Properties in WF11 0JY have no sales history available within the last 3 years. WF11 0JY is a postcode in Ridgeway Square located in Knottingley, an area in Knottingley, Wakefield, with 8 households².
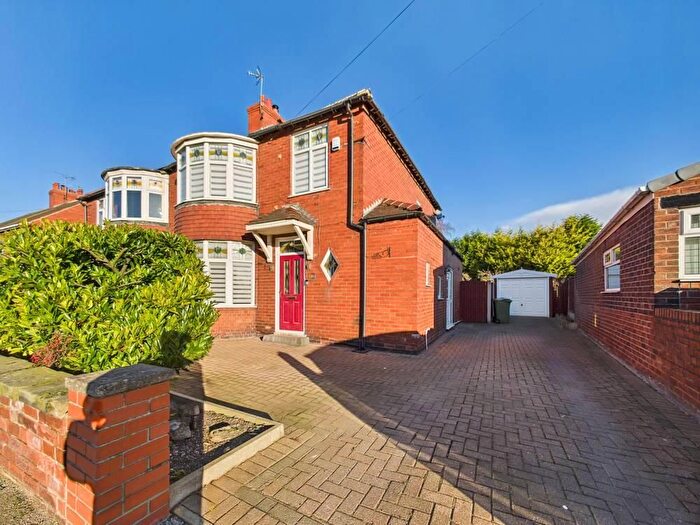
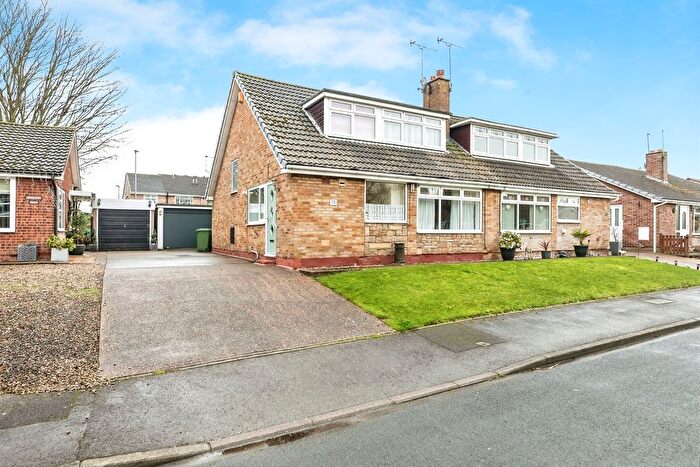
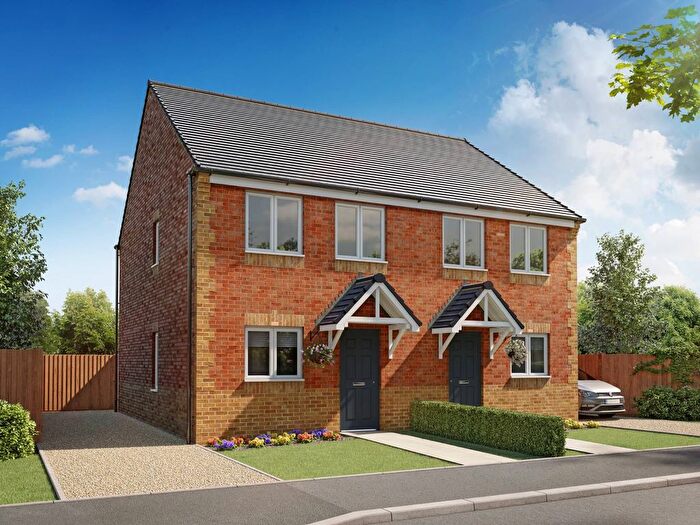
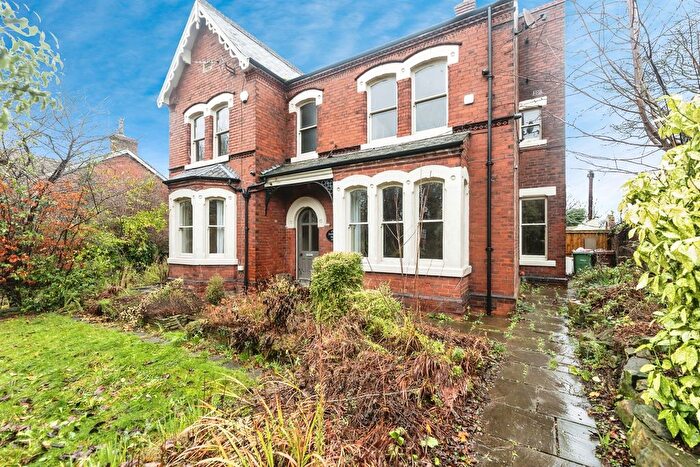
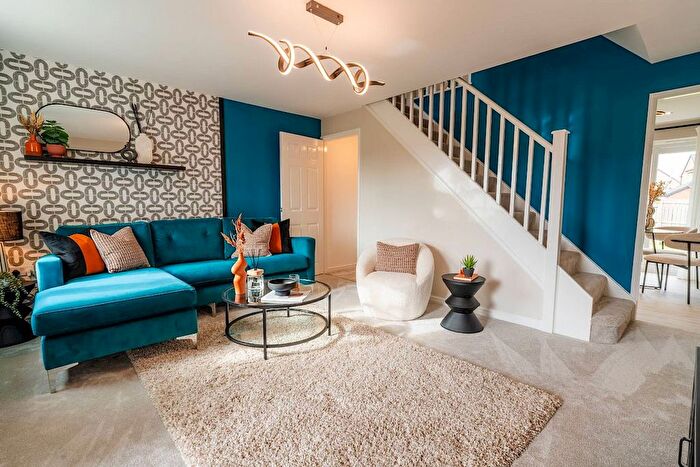
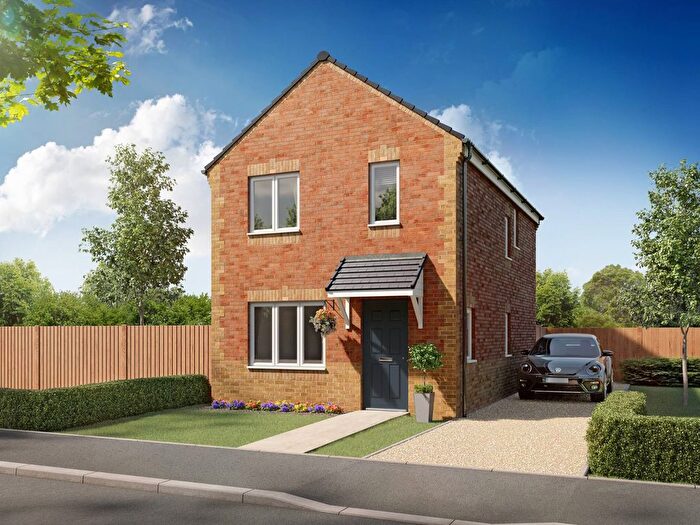
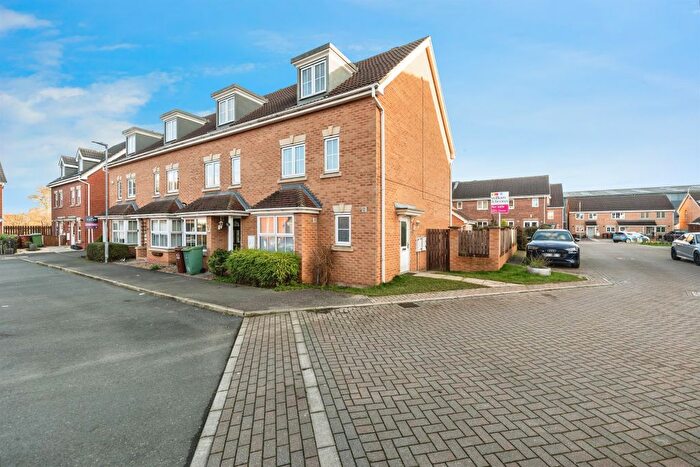
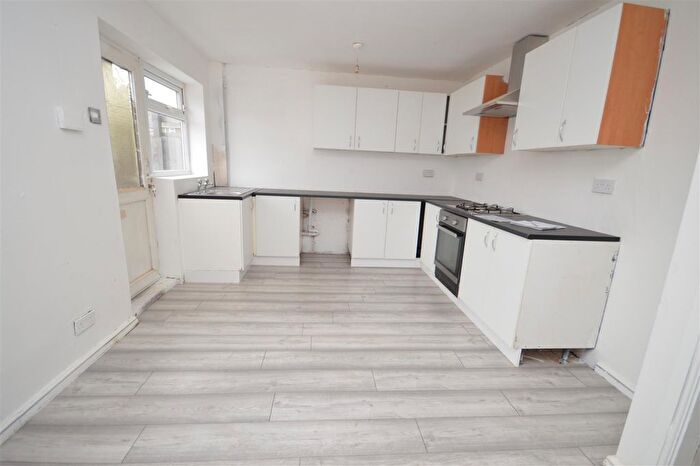
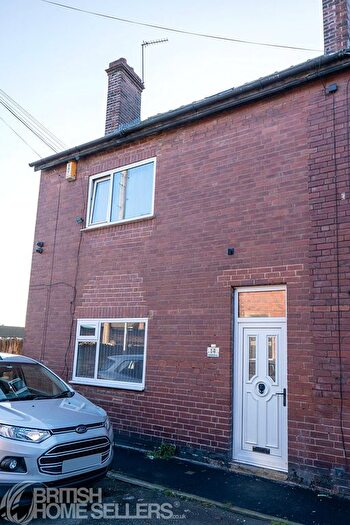
Properties for sale near WF11 0JY, Ridgeway Square
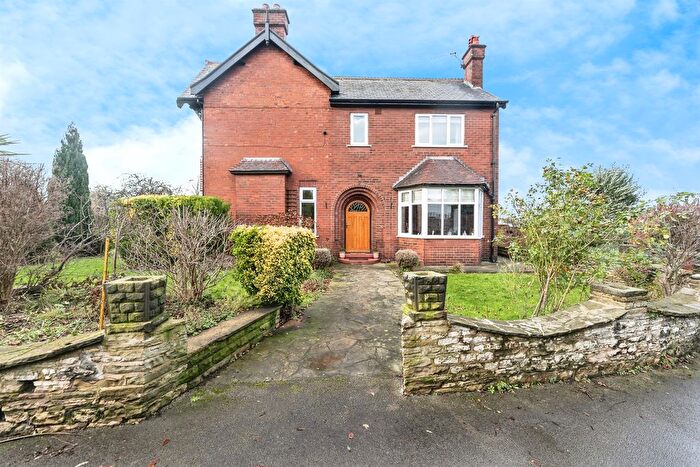
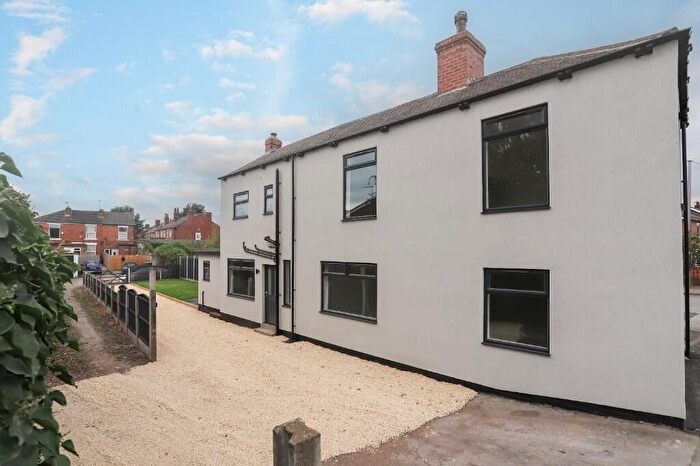

![]()
If you are looking to sell your house, let it out, or receive a property valuation, an expert can help you.
Click the button below to get started.
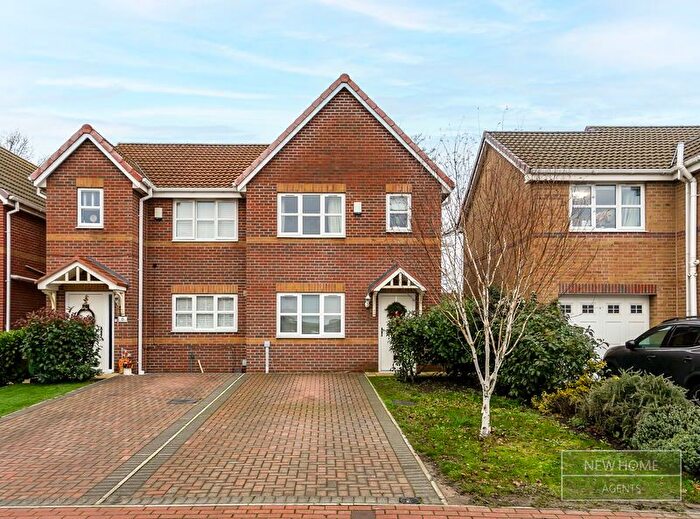
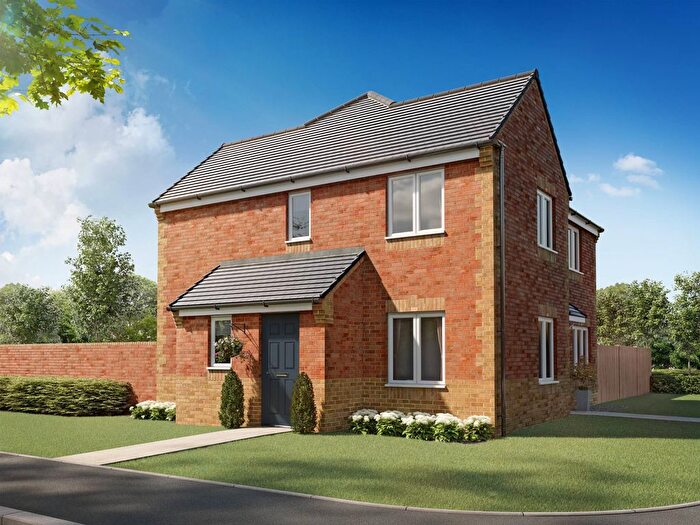
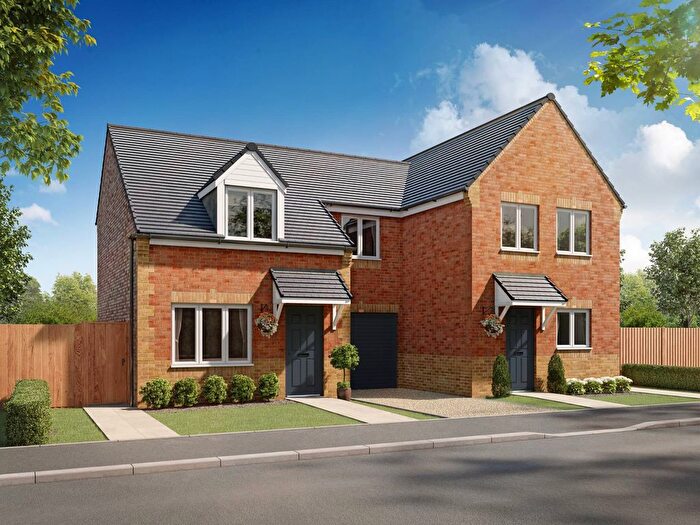
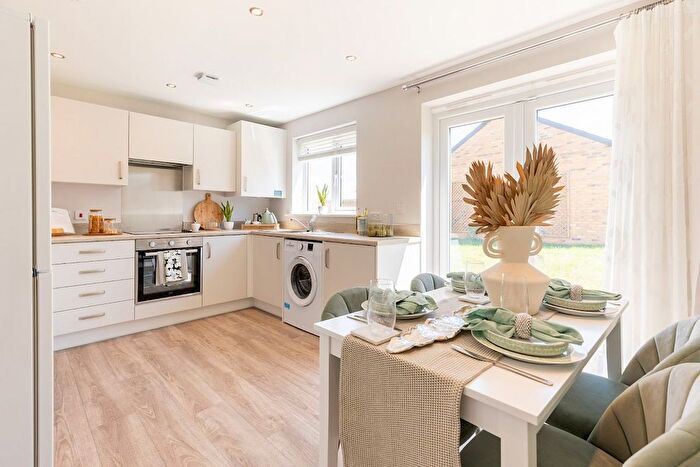
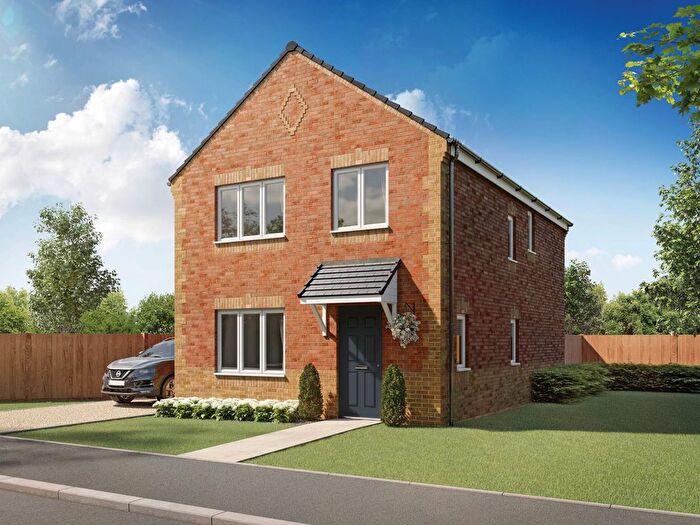
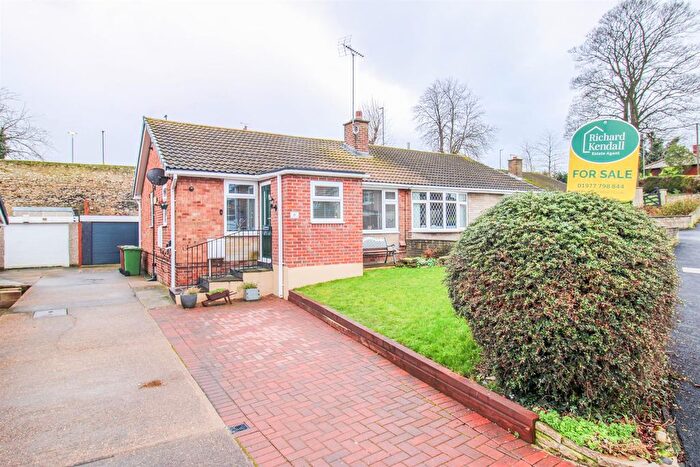
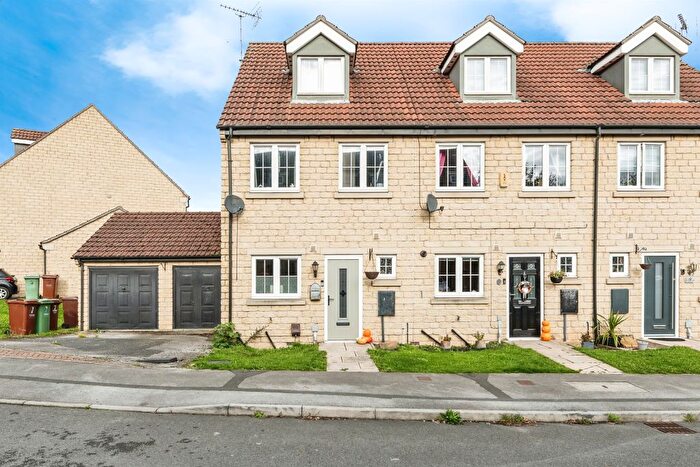
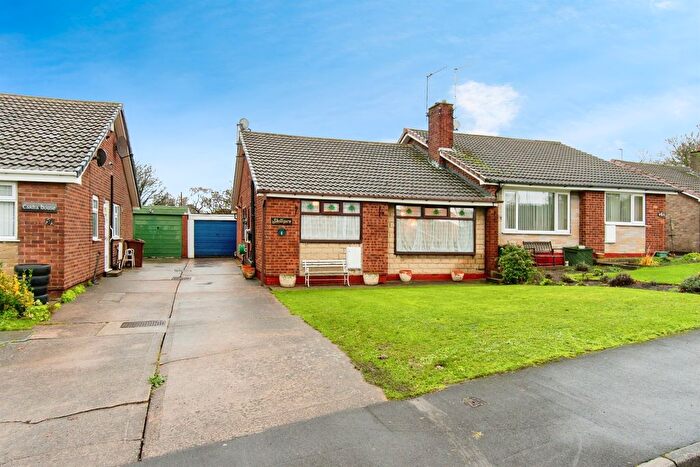
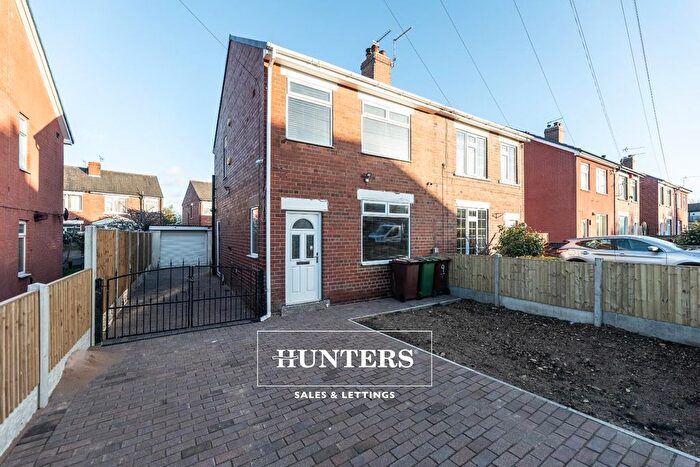
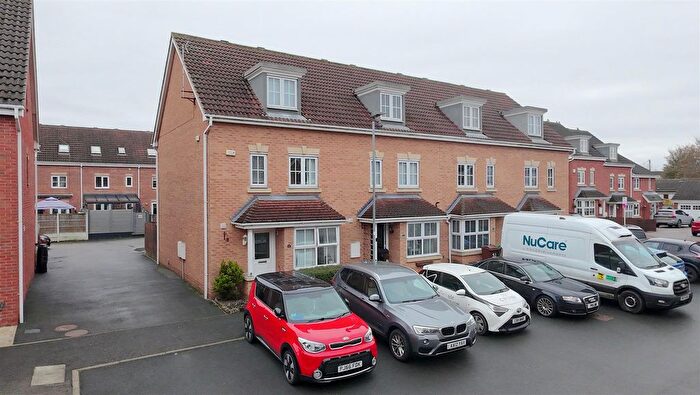
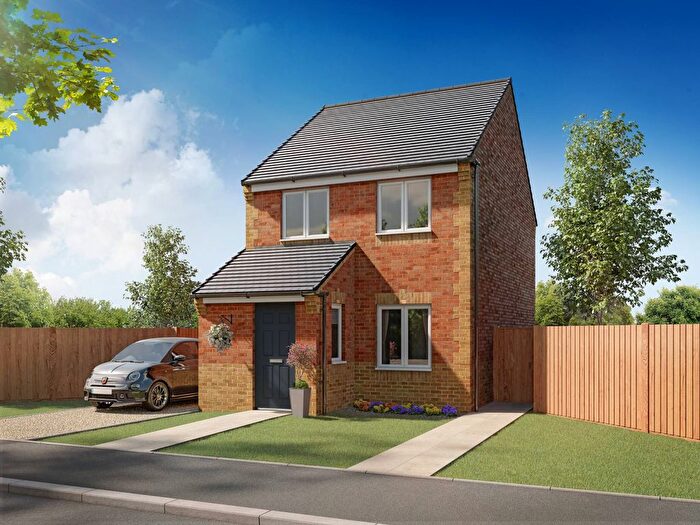
Previously listed properties near WF11 0JY, Ridgeway Square
![]()
If you are looking to sell your house, let it out, or receive a property valuation, an expert can help you.
Click the button below to get started.
Price Paid in Ridgeway Square, WF11 0JY, Knottingley
5 Ridgeway Square, WF11 0JY, Knottingley Knottingley
Property 5 has been sold 3 times. The last time it was sold was in 12/08/2021 and the sold price was £137,000.00.
This semi detached house, sold as a freehold on 12/08/2021, is a 86 sqm semi-detached house with an EPC rating of D.
| Date | Price | Property Type | Tenure | Classification |
|---|---|---|---|---|
| 12/08/2021 | £137,000.00 | Semi Detached House | freehold | Established Building |
| 13/07/2017 | £110,000.00 | Semi Detached House | freehold | Established Building |
| 22/12/1998 | £42,000.00 | Semi Detached House | freehold | Established Building |
1 Ridgeway Square, WF11 0JY, Knottingley Knottingley
Property 1 has been sold 1 time. The last time it was sold was in 25/03/2020 and the sold price was £90,000.00.
This semi detached house, sold as a freehold on 25/03/2020, is a 88 sqm semi-detached house with an EPC rating of D.
| Date | Price | Property Type | Tenure | Classification |
|---|---|---|---|---|
| 25/03/2020 | £90,000.00 | Semi Detached House | freehold | Established Building |
4 Ridgeway Square, WF11 0JY, Knottingley Knottingley
Property 4 has been sold 3 times. The last time it was sold was in 29/07/2016 and the sold price was £125,000.00.
This semi detached house, sold as a freehold on 29/07/2016, is a 88 sqm semi-detached house with an EPC rating of D.
| Date | Price | Property Type | Tenure | Classification |
|---|---|---|---|---|
| 29/07/2016 | £125,000.00 | Semi Detached House | freehold | Established Building |
| 29/07/2016 | £97,500.00 | Semi Detached House | freehold | Established Building |
| 30/09/2004 | £113,000.00 | Semi Detached House | freehold | Established Building |
2 Ridgeway Square, WF11 0JY, Knottingley Knottingley
Property 2 has been sold 2 times. The last time it was sold was in 06/04/2011 and the sold price was £100,000.00.
This semi detached house, sold as a freehold on 06/04/2011, is a 149 sqm semi-detached house with an EPC rating of C.
| Date | Price | Property Type | Tenure | Classification |
|---|---|---|---|---|
| 06/04/2011 | £100,000.00 | Semi Detached House | freehold | Established Building |
| 02/09/2002 | £23,500.00 | Semi Detached House | freehold | Established Building |
3 Ridgeway Square, WF11 0JY, Knottingley Knottingley
Property 3 has been sold 1 time. The last time it was sold was in 07/12/2001 and the sold price was £51,000.00.
This is a Semi Detached House which was sold as a freehold in 07/12/2001
| Date | Price | Property Type | Tenure | Classification |
|---|---|---|---|---|
| 07/12/2001 | £51,000.00 | Semi Detached House | freehold | Established Building |
8 Ridgeway Square, WF11 0JY, Knottingley Knottingley
Property 8 has been sold 1 time. The last time it was sold was in 06/03/1998 and the sold price was £42,000.00.
This is a Semi Detached House which was sold as a freehold in 06/03/1998
| Date | Price | Property Type | Tenure | Classification |
|---|---|---|---|---|
| 06/03/1998 | £42,000.00 | Semi Detached House | freehold | Established Building |
7 Ridgeway Square, WF11 0JY, Knottingley Knottingley
This is a 91 square meter Semi-detached House with an EPC rating of C. Currently, there is no transaction history available for this property.
Transport near WF11 0JY, Ridgeway Square
-
 Knottingley Station
 -
Pontefract Monkhill Station
-
Pontefract Baghill Station
-
Pontefract Tanshelf Station
House price paid reports for WF11 0JY, Ridgeway Square
Click on the buttons below to see price paid reports by year or property price:
- Price Paid By Year
Property Price Paid in WF11 0JY, Ridgeway Square by Year
The average sold property price by year was:
| Year | Average Sold Price | Price Change |
Sold Properties
|
|---|---|---|---|
| 2021 | £137,000 | 34% |
1 Property |
| 2020 | £90,000 | -22% |
1 Property |
| 2017 | £110,000 | -1% |
1 Property |
| 2016 | £111,250 | 10% |
2 Properties |
| 2011 | £100,000 | -13% |
1 Property |
| 2004 | £113,000 | 79% |
1 Property |
| 2002 | £23,500 | -117% |
1 Property |
| 2001 | £51,000 | 18% |
1 Property |
| 1998 | £42,000 | - |
2 Properties |