
Houses for sale in Wakefield, England
House Prices in Wakefield
Properties in Wakefield have
an average house price of
£207k
and had 14,664 Property Transactions
within the last 3 years.¹
Wakefield is a location in
England with
153,534 households², where the most expensive property was sold for £9M.
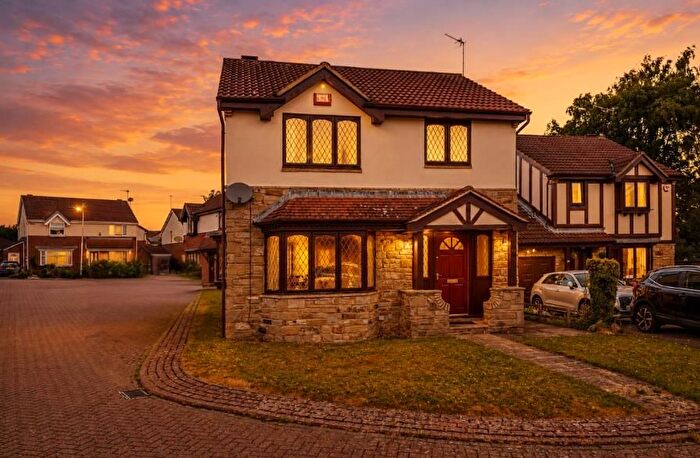
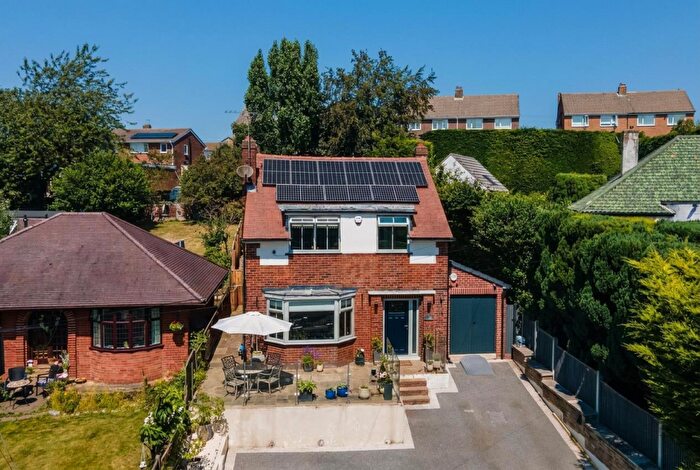
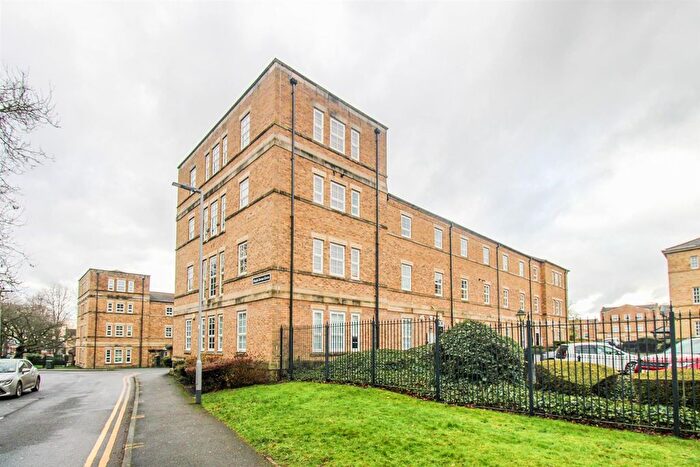
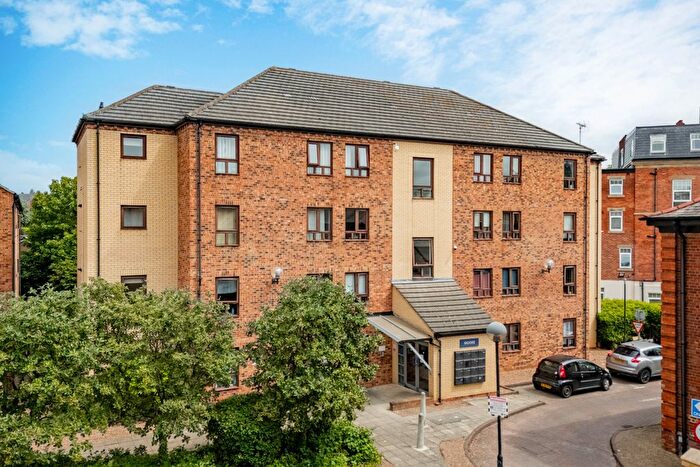
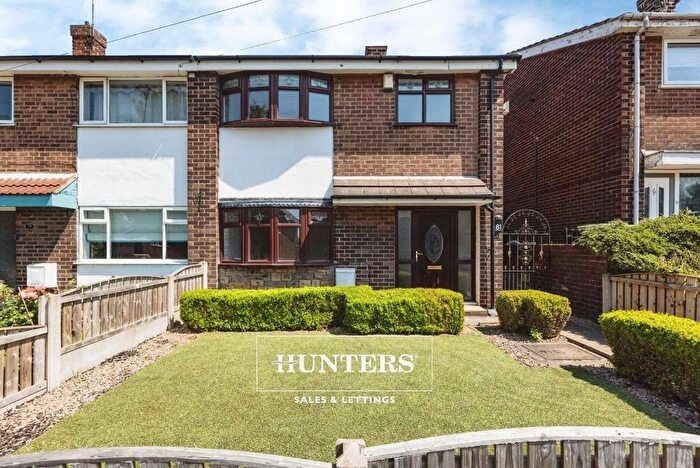
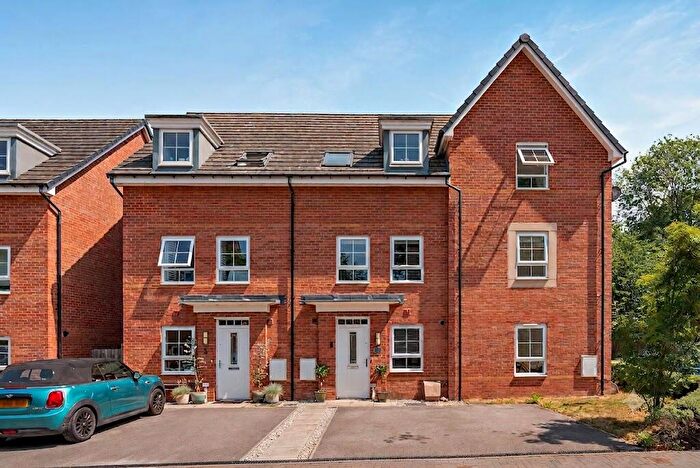
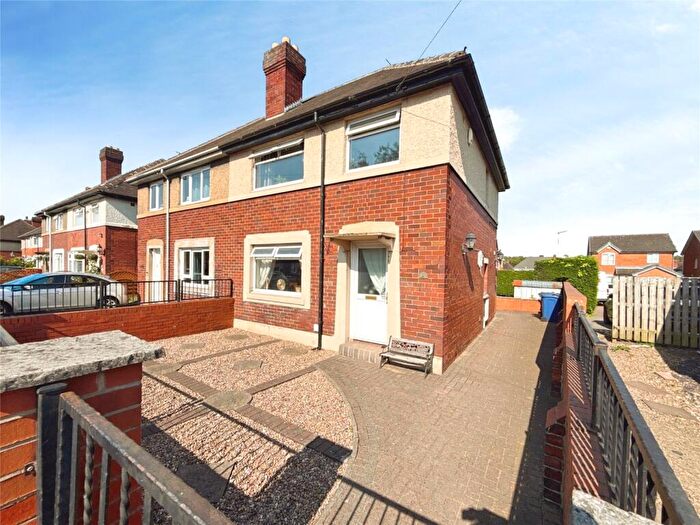
Properties for sale in Wakefield
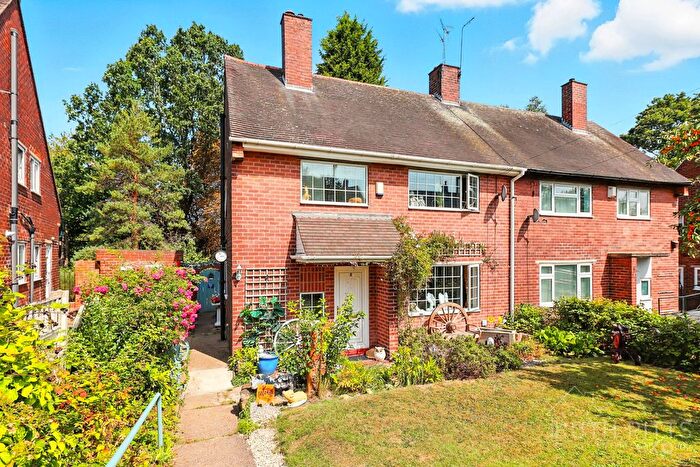
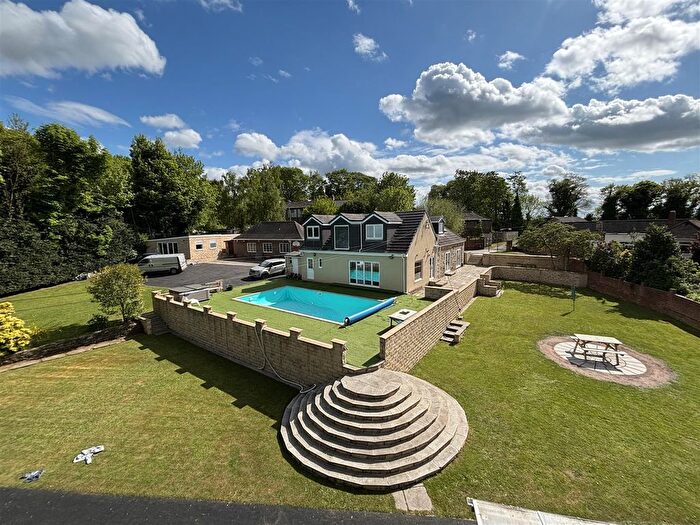
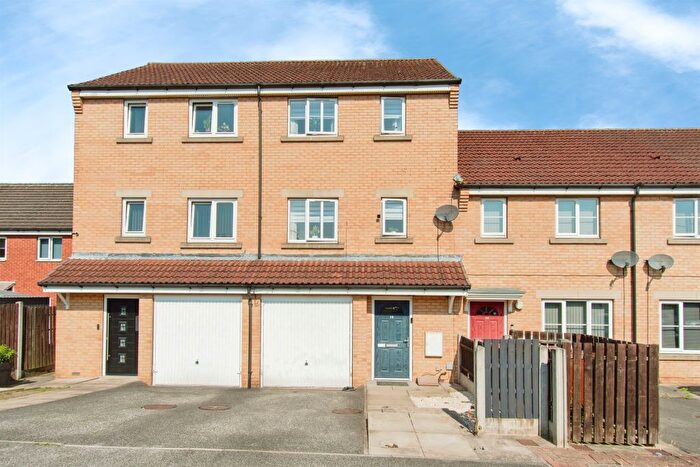
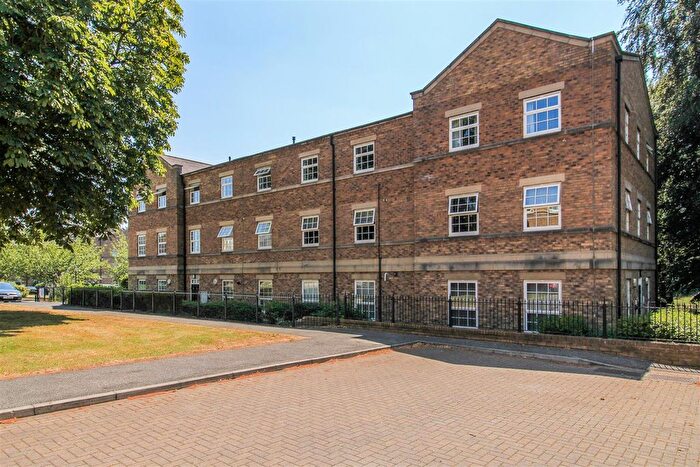
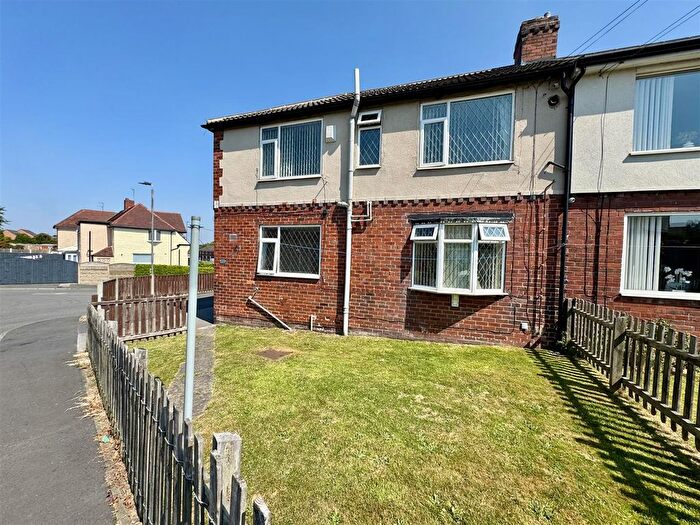
![]()
If you are looking to sell your house, let it out, or receive a property valuation, an expert can help you.
Click the button below to get started.

Towns in Wakefield
Navigate through our locations to find the location of your next house in Wakefield, England for sale or to rent.
Property price trends in Wakefield
According to the latest Land Registry data, the average home in Wakefield sold for £211,463 in 2026. That figure comes from a substantial record of 163,211 sales logged over the past 31 years.
Prices have continued to climb over the last three years. Compared with 2023, when the typical sale came in around £197,197, that's a rise of roughly 7.2%.
Looking back five years, average prices are up about 10.3% since 2021, a gain of around £19,706 in cash terms.
Zoom out to the past decade for the fuller picture. Back in 2016, homes here averaged £152,744, so the typical sold price has climbed about 38.4% since then, roughly 3.3% a year. Stretch the view to fifteen years and that annual pace holds at about 3.2%.
Frequently asked questions about Wakefield
What is the average price for a property for sale in Wakefield?
The average price for a property for sale in Wakefield is £206,738. This amount is 42% lower than the average price in England. There are more than 10,000 property listings for sale in Wakefield.
What locations have the most expensive properties for sale in Wakefield?
The locations with the most expensive properties for sale in Wakefield are Wakefield at an average of £228,467, Ossett at an average of £219,530 and Barnsley at an average of £208,898.
What locations have the most affordable properties for sale in Wakefield?
The locations with the most affordable properties for sale in Wakefield are Dewsbury at an average of £163,555, Knottingley at an average of £170,645 and Castleford at an average of £177,476.
Which train stations are available in or near Wakefield?
Some of the train stations available in or near Wakefield are Streethouse, Normanton and Sandal And Agbrigg.
Property Price Paid in Wakefield by Year
The average sold property price by year was:
| Year | Average Sold Price | Price Change |
Sold Properties
|
|---|---|---|---|
| 2026 | £211,463 | -3% |
845 Properties |
| 2025 | £216,805 | 6% |
4,795 Properties |
| 2024 | £204,373 | 4% |
4,716 Properties |
| 2023 | £197,197 | -1% |
4,308 Properties |
| 2022 | £200,121 | 4% |
5,609 Properties |
| 2021 | £191,757 | 6% |
6,662 Properties |
| 2020 | £180,138 | 5% |
5,023 Properties |
| 2019 | £170,671 | 1% |
6,339 Properties |
| 2018 | £168,757 | 5% |
6,471 Properties |
| 2017 | £160,917 | 5% |
6,609 Properties |
Property Price per Property Type in Wakefield
Here you can find historic sold price data in order to help with your property search.
The average Property Paid Price for specific property types in the last three years are:
| Property Type | Average Sold Price | Sold Properties |
|---|---|---|
| Semi Detached House | £196,942.00 | 5,871 Semi Detached Houses |
| Terraced House | £146,723.00 | 4,751 Terraced Houses |
| Detached House | £338,495.00 | 3,213 Detached Houses |
| Flat | £109,410.00 | 829 Flats |
Transport in Wakefield
Please see below transportation links in this area:
