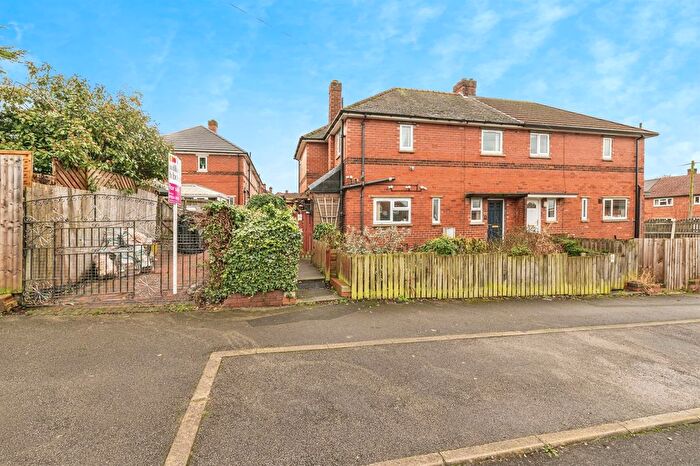
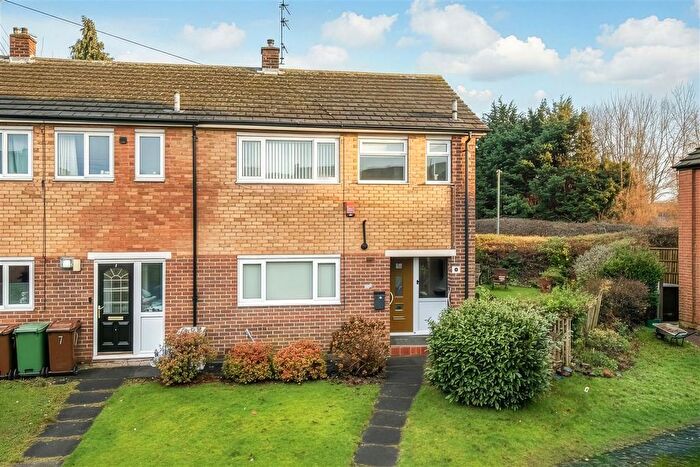
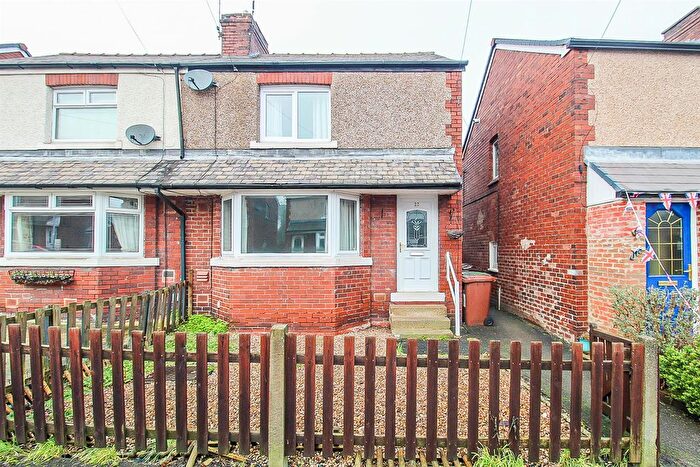
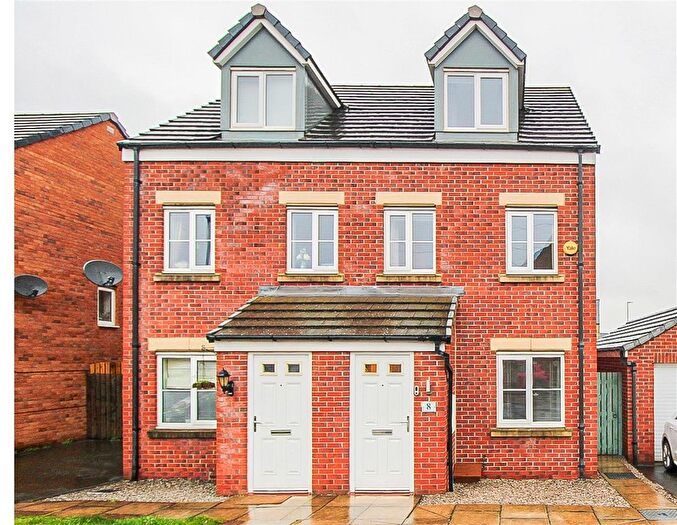
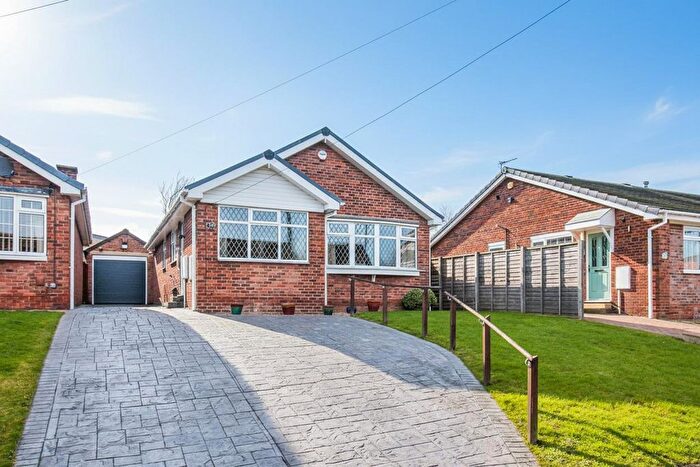
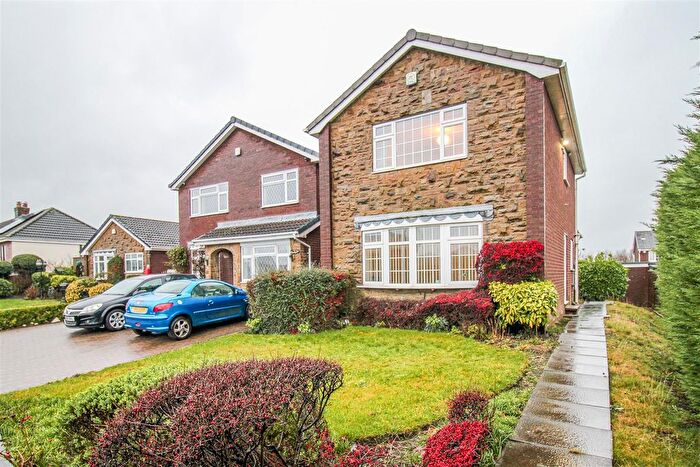
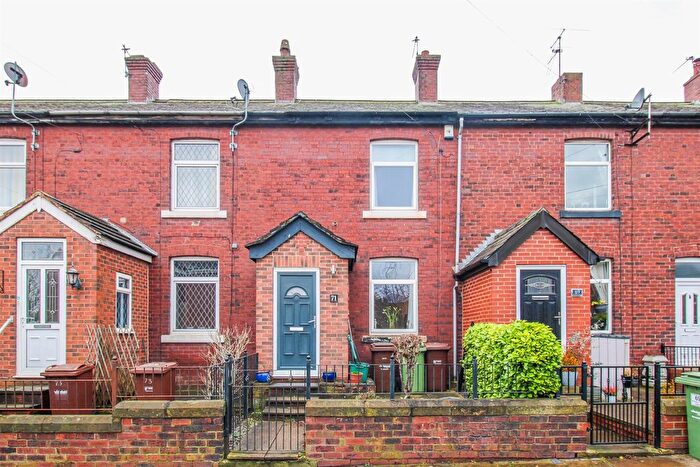
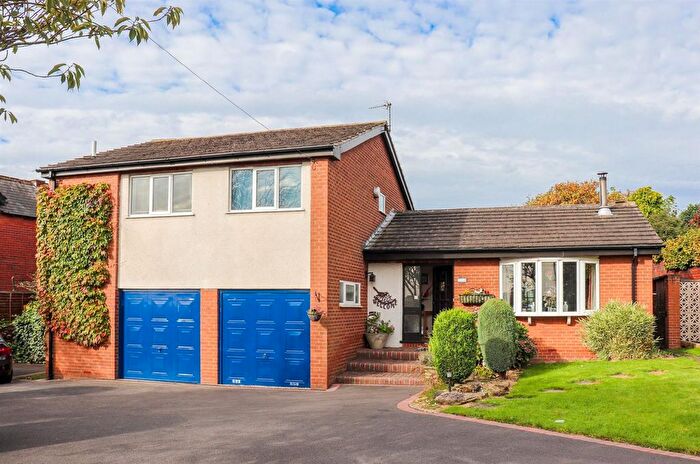
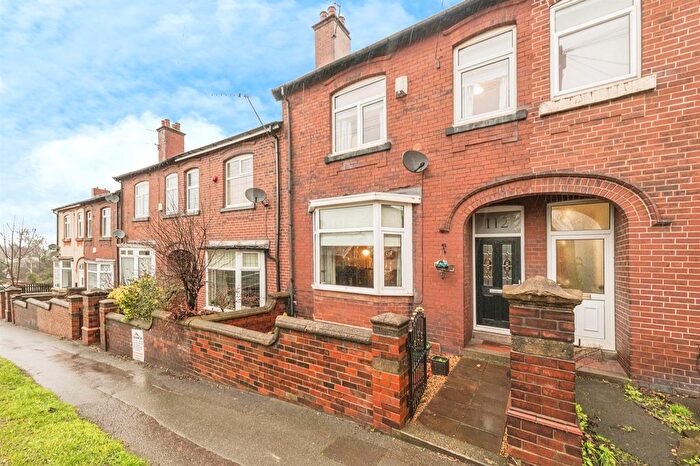
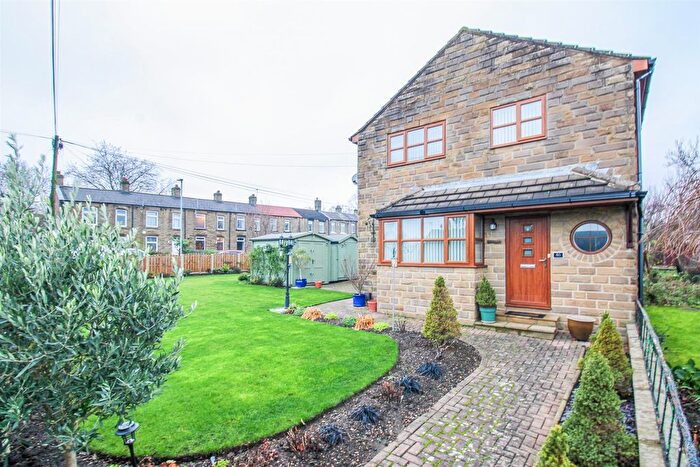
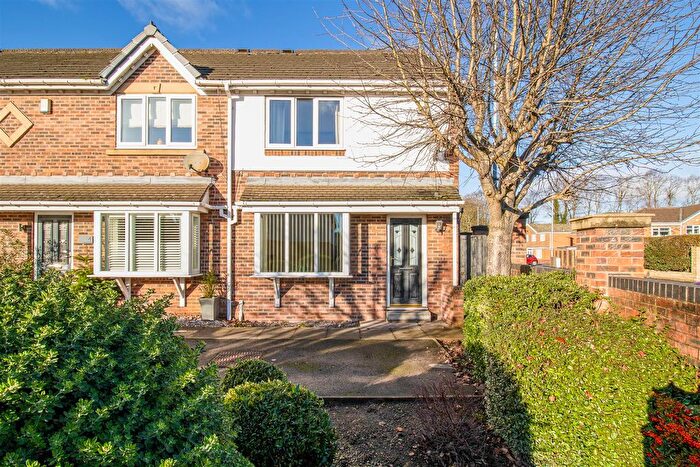
Houses for sale & to rent in Horbury And South Ossett, Ossett
House Prices in Horbury And South Ossett
Properties in Horbury And South Ossett have an average house price of £240,629.00 and had 154 Property Transactions within the last 3 years¹.
Horbury And South Ossett is an area in Ossett, Wakefield with 2,234 households², where the most expensive property was sold for £750,000.00.
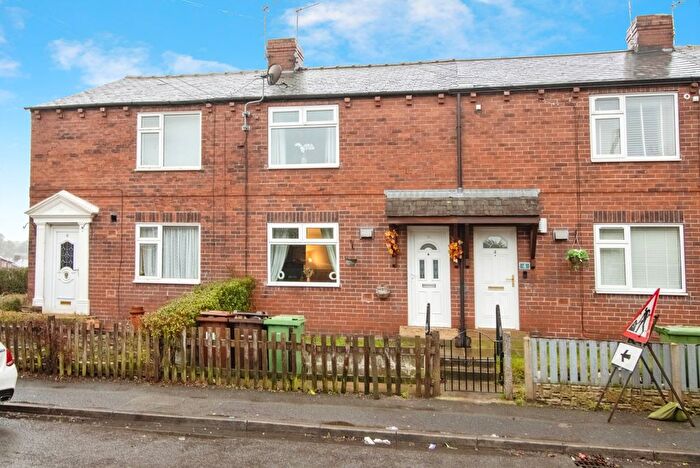
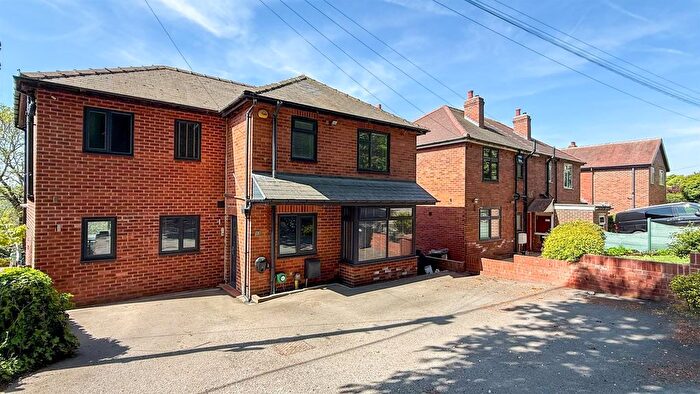
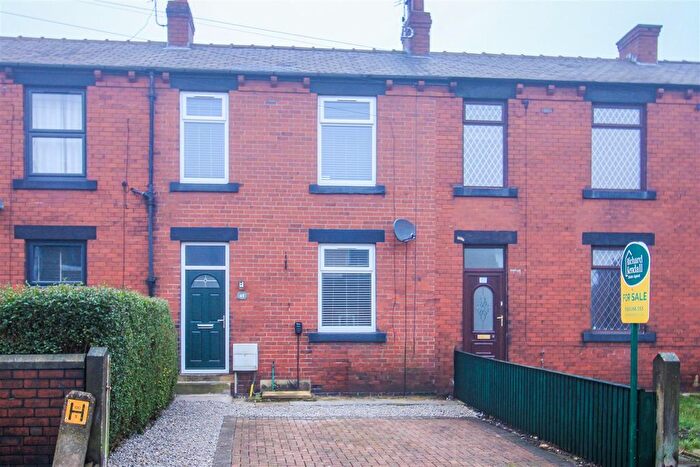
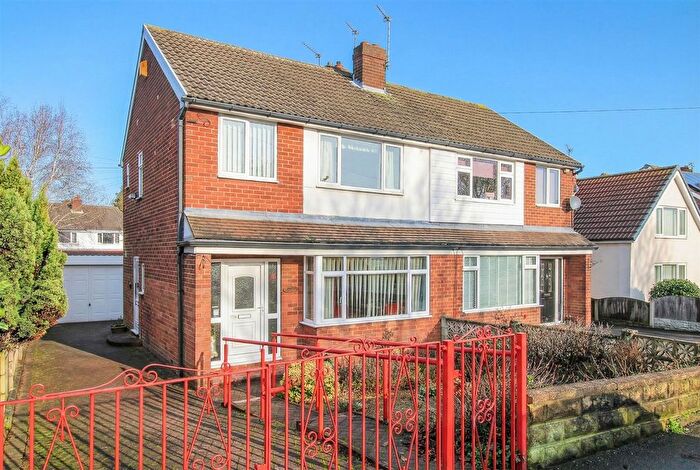
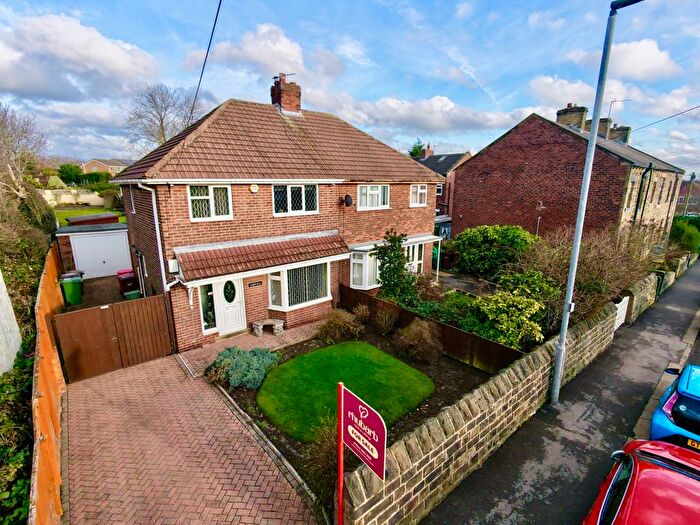
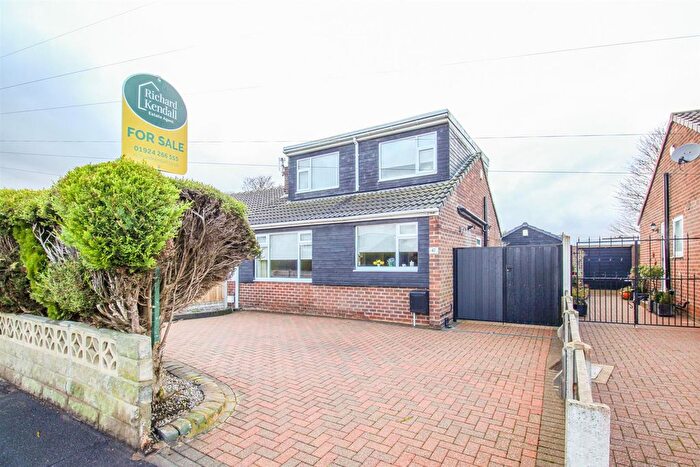
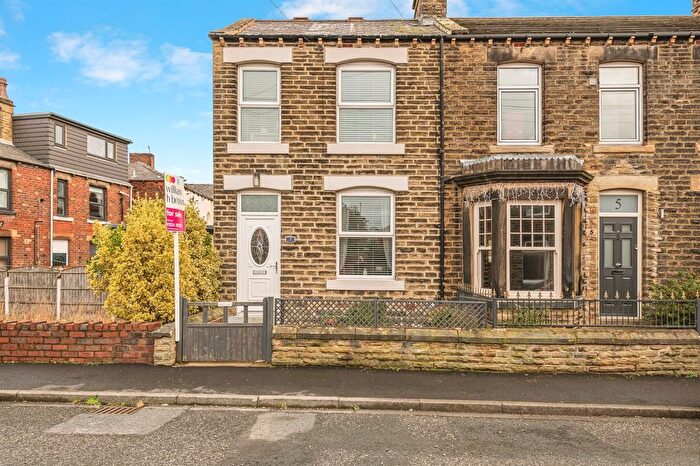
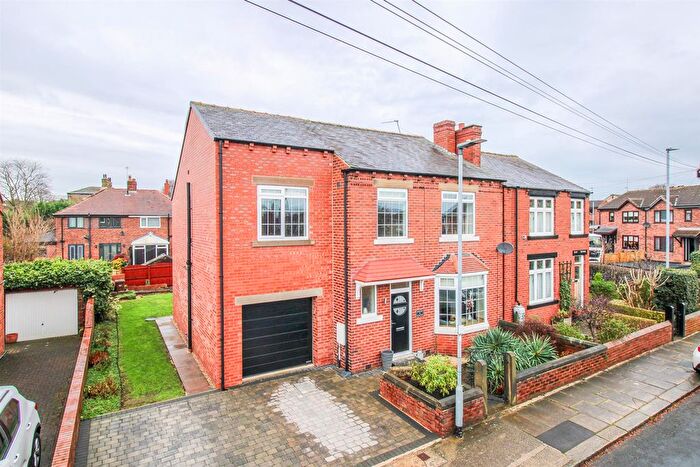
Properties for sale in Horbury And South Ossett
Previously listed properties in Horbury And South Ossett
Roads and Postcodes in Horbury And South Ossett
Navigate through our locations to find the location of your next house in Horbury And South Ossett, Ossett for sale or to rent.
| Streets | Postcodes |
|---|---|
| Aston Court | WF5 0PQ |
| Bankfield Close | WF5 0SU |
| Baptist Lane | WF5 0HD |
| Barmby Close | WF5 0DS |
| Barmby Crescent | WF5 0DR |
| Barmby Fold | WF5 0DW |
| Brook Close | WF5 0SR |
| Brooklands Court | WF5 0SL |
| Calverts Walk | WF5 0TA |
| Cardigan Lane | WF5 0LT |
| Cavewell Close | WF5 0SN |
| Cavewell Gardens | WF5 0SW |
| Chapel Street | WF5 0EN |
| Charles Street | WF5 0LR |
| Charlotte Grove | WF5 0HR |
| Clarendon Cottages | WF5 0BP |
| Crown Street | WF5 0BJ |
| Elder Mews | WF5 0GQ |
| Fairfield Avenue | WF5 0LZ |
| Fairfield Close | WF5 0EE |
| Fairfield Drive | WF5 0DU WF5 0EA WF5 0DT |
| Fairfield Gardens | WF5 0LX |
| Fairfield Mount | WF5 0TE |
| Fairfield Road | WF5 0DZ WF5 0EG WF5 0EH WF5 0TF |
| Fairfield Terrace | WF5 0JF |
| Fairfield Walk | WF5 0ED |
| Fisher Grove | WF5 0TB |
| Garden Close | WF5 0SQ |
| Georgia Mews | WF5 0ST |
| Goring Park Avenue | WF5 0HX |
| Grange Drive | WF5 0SH |
| Green Park Avenue | WF5 0AY |
| Greenfield Avenue | WF5 0ER WF5 0EW |
| Greenfield Close | WF5 0EP |
| Greenfield Road | WF5 0ES |
| Greystones Drive | WF5 0BD |
| Haggs Hill Road | WF5 0NS |
| Harvest Mews | WF5 0TN |
| Hawthorn Terrace | WF5 0BW |
| Heather Close | WF5 0SS |
| Hope Street | WF5 0LP |
| Horbury Road | WF5 0BL WF5 0BN WF5 0BS WF5 0BT WF5 0BY |
| Horbury View | WF5 0FA |
| Junction Lane | WF5 0EZ WF5 0HA WF5 0HF |
| Leopold Street | WF5 0HY |
| Lombardi Court | WF5 0EQ |
| Lynda Grove | WF5 0EX |
| Manor Avenue | WF5 0LY |
| Manor Close | WF5 0LU |
| Manor Court | WF5 0JA |
| Manor Drive | WF5 0LL |
| Manor Grove | WF5 0LN |
| Manor Lane | WF5 0LJ WF5 0LS |
| Manor Road | WF5 0AX WF5 0DX WF5 0ET WF5 0LF WF5 0LH WF5 0LQ WF5 0LW WF5 0SJ WF5 0HG |
| Maple Court | WF5 0DP |
| Marsden Avenue | WF5 0AW |
| Maryfield Gardens | WF5 0TW |
| Mayfield Court | WF5 0SG |
| Park Court | WF5 0JR |
| Park Gardens | WF5 0LA |
| Park Lands | WF5 0JY |
| Park Square | WF5 0JS WF5 0JU |
| Park Street | WF5 0JZ |
| Parkfield Drive | WF5 0PB |
| Parkfield View | WF5 0PD |
| Queens Drive | WF5 0NE WF5 0NG WF5 0NJ WF5 0NR |
| Queens Drive Close | WF5 0NF |
| Queens Walk | WF5 0NL |
| Richmond Garth | WF5 0TD |
| Rock House Way | WF5 0BG |
| Roundwood Road | WF5 0HZ |
| Rushmead Court | WF5 0NZ |
| Saville Park | WF5 0JT |
| Saville Street | WF5 0JX |
| South Parade | WF5 0DY WF5 0EB WF5 0EF WF5 0EL WF5 0NU |
| South Terrace | WF5 0DE |
| Sowood Avenue | WF5 0DB WF5 0DD |
| Sowood Court | WF5 0TJ |
| Sowood Gardens | WF5 0SP |
| Sowood Grange | WF5 0TL |
| Sowood Lane | WF5 0LE |
| Sowood View | WF5 0LG |
| Spa Croft Road | WF5 0EU WF5 0EY WF5 0HE |
| Spa Lane | WF5 0HN |
| Spa Street | WF5 0HH WF5 0HP WF5 0HJ WF5 0HW |
| St Aidens Walk | WF5 0HB |
| St Johns Avenue | WF5 0NX |
| St Johns Close | WF5 0NT |
| St Johns Crescent | WF5 0EJ |
| Station Road | WF5 0JE WF5 0LB |
| Stonegate | WF5 0JD |
| Storrs Hill Road | WF5 0DA WF5 0DF WF5 0DQ |
| Taylor Close | WF5 0SY |
| Taylor Crescent | WF5 0SZ |
| Taylor Drive | WF5 0SX |
| Teall Court | WF5 0PF WF5 0PG |
| Teall Street | WF5 0HS WF5 0HU WF5 0NW WF5 0NY WF5 0PA WF5 0PE |
| The Hawthorns | WF5 0BH |
| Vicar Lane | WF5 0BE |
| Westwood Road | WF5 0NN |
| Whinfield Place | WF5 0HL |
| Whinfield Terrace | WF5 0FL |
| Wilson Avenue | WF5 0HQ |
Transport near Horbury And South Ossett
-
Wakefield Westgate Station
-
Dewsbury Station
-
Wakefield Kirkgate Station
-
Sandal And Agbrigg Station
-
Batley Station
-
Outwood Station
-
Ravensthorpe Station
- FAQ
- Price Paid By Year
- Property Type Price
Frequently asked questions about Horbury And South Ossett
What is the average price for a property for sale in Horbury And South Ossett?
The average price for a property for sale in Horbury And South Ossett is £240,629. This amount is 10% higher than the average price in Ossett. There are 620 property listings for sale in Horbury And South Ossett.
What streets have the most expensive properties for sale in Horbury And South Ossett?
The streets with the most expensive properties for sale in Horbury And South Ossett are Manor Lane at an average of £509,500, Horbury View at an average of £460,000 and Fairfield Drive at an average of £414,975.
What streets have the most affordable properties for sale in Horbury And South Ossett?
The streets with the most affordable properties for sale in Horbury And South Ossett are Taylor Close at an average of £80,000, Greenfield Avenue at an average of £123,750 and Parkfield View at an average of £140,000.
Which train stations are available in or near Horbury And South Ossett?
Some of the train stations available in or near Horbury And South Ossett are Wakefield Westgate, Dewsbury and Wakefield Kirkgate.
Property Price Paid in Horbury And South Ossett by Year
The average sold property price by year was:
| Year | Average Sold Price | Price Change |
Sold Properties
|
|---|---|---|---|
| 2025 | £246,263 | -4% |
51 Properties |
| 2024 | £257,214 | 16% |
54 Properties |
| 2023 | £216,486 | -2% |
49 Properties |
| 2022 | £221,314 | 8% |
91 Properties |
| 2021 | £204,470 | 12% |
72 Properties |
| 2020 | £180,204 | -6% |
78 Properties |
| 2019 | £191,867 | -0,1% |
92 Properties |
| 2018 | £192,033 | 7% |
71 Properties |
| 2017 | £178,472 | -2% |
82 Properties |
| 2016 | £182,417 | 12% |
106 Properties |
| 2015 | £160,180 | 11% |
103 Properties |
| 2014 | £142,053 | -0,5% |
76 Properties |
| 2013 | £142,694 | - |
54 Properties |
| 2012 | £142,680 | -1% |
52 Properties |
| 2011 | £143,851 | -3% |
46 Properties |
| 2010 | £148,377 | -9% |
40 Properties |
| 2009 | £161,988 | 0,2% |
36 Properties |
| 2008 | £161,655 | 8% |
49 Properties |
| 2007 | £147,991 | 0,2% |
93 Properties |
| 2006 | £147,712 | 7% |
102 Properties |
| 2005 | £136,926 | 4% |
95 Properties |
| 2004 | £131,084 | 13% |
99 Properties |
| 2003 | £114,211 | 18% |
94 Properties |
| 2002 | £93,531 | 9% |
89 Properties |
| 2001 | £84,958 | 20% |
119 Properties |
| 2000 | £67,590 | 11% |
116 Properties |
| 1999 | £59,968 | 11% |
79 Properties |
| 1998 | £53,455 | -1% |
86 Properties |
| 1997 | £54,116 | 7% |
64 Properties |
| 1996 | £50,257 | 1% |
76 Properties |
| 1995 | £49,664 | - |
70 Properties |
Property Price per Property Type in Horbury And South Ossett
Here you can find historic sold price data in order to help with your property search.
The average Property Paid Price for specific property types in the last three years are:
| Property Type | Average Sold Price | Sold Properties |
|---|---|---|
| Semi Detached House | £230,375.00 | 73 Semi Detached Houses |
| Detached House | £360,516.00 | 37 Detached Houses |
| Terraced House | £160,471.00 | 41 Terraced Houses |
| Flat | £107,000.00 | 3 Flats |

