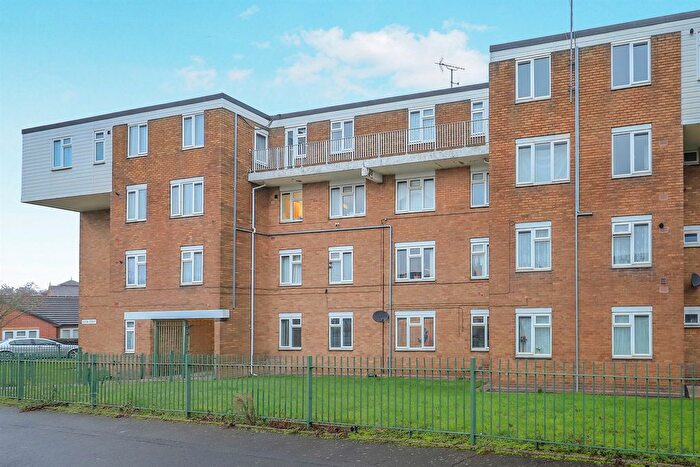
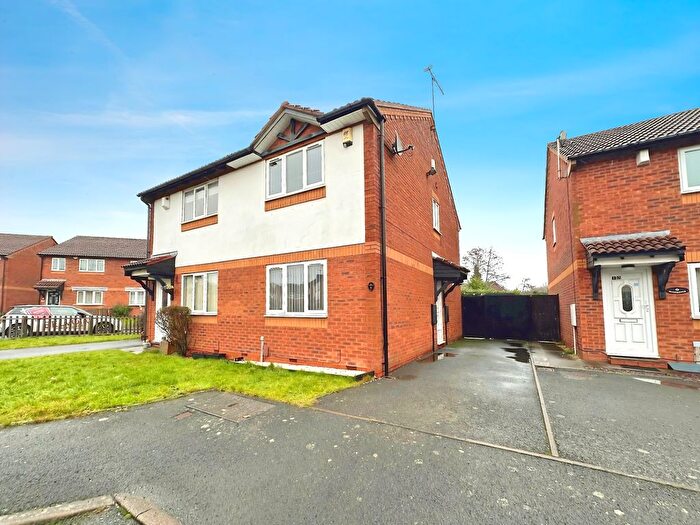
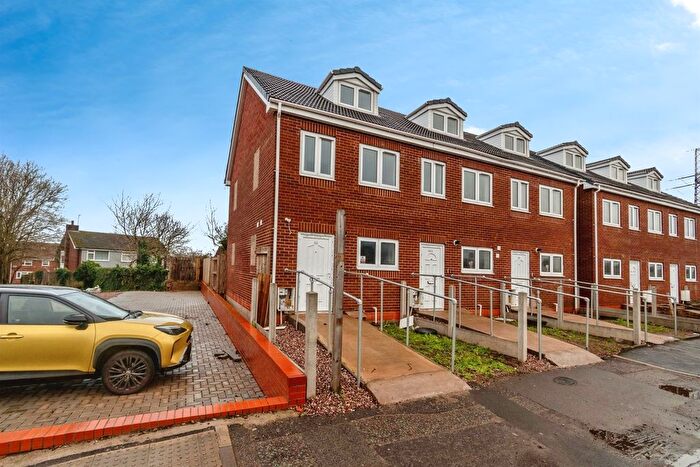
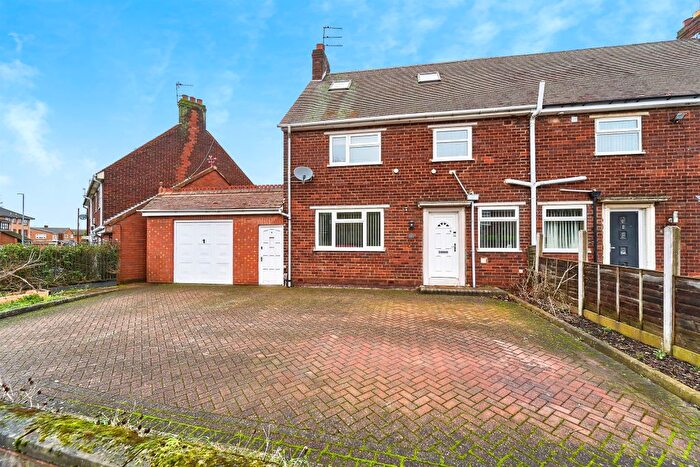
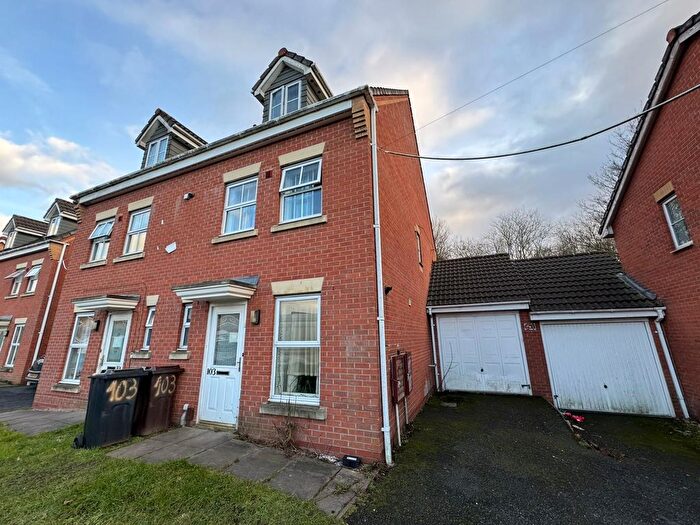
Houses for sale & to rent in Darlaston South, Bilston
House Prices in Darlaston South
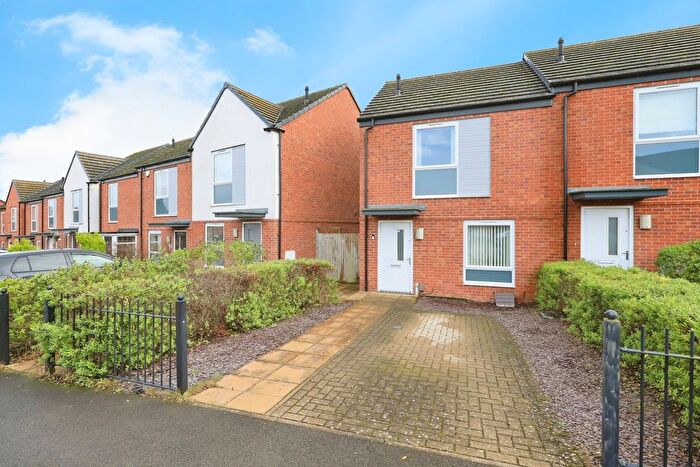
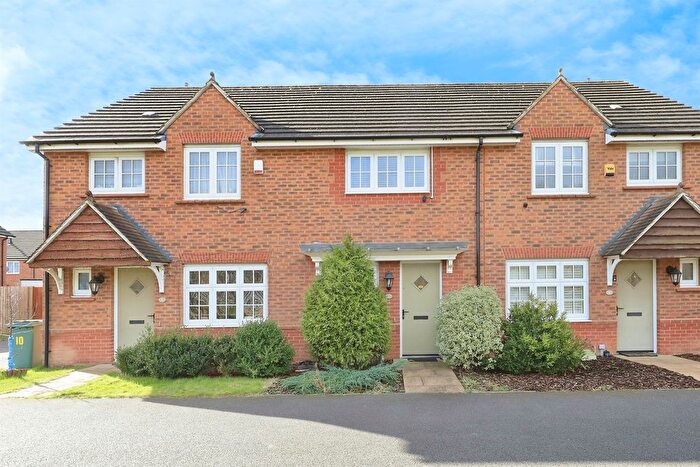
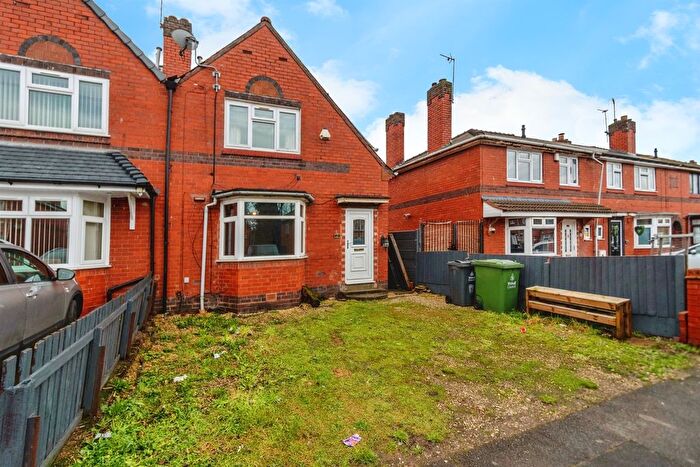
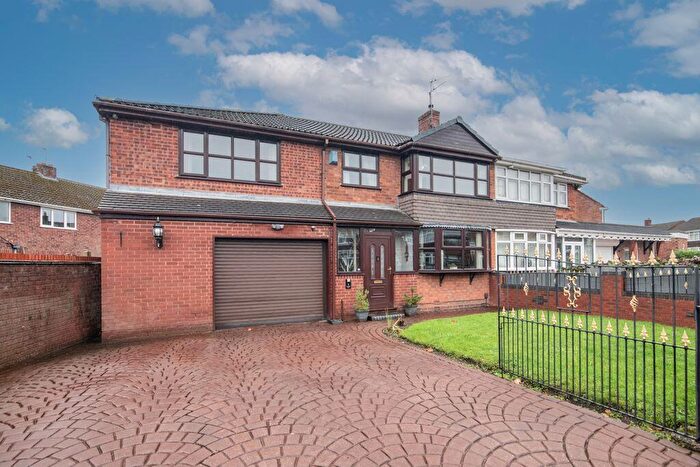
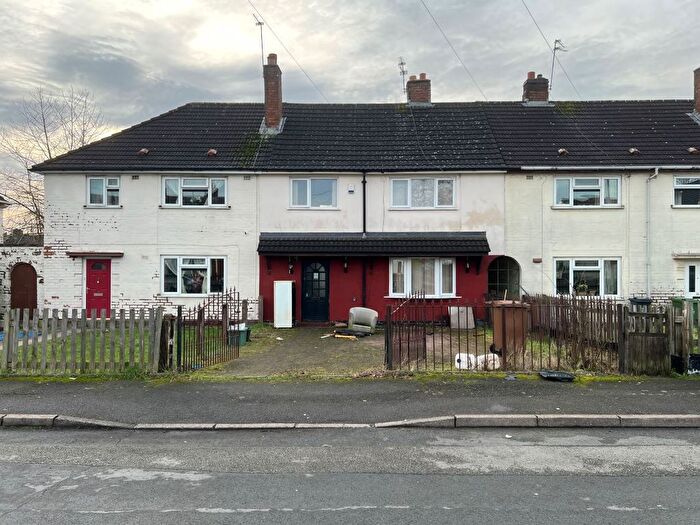
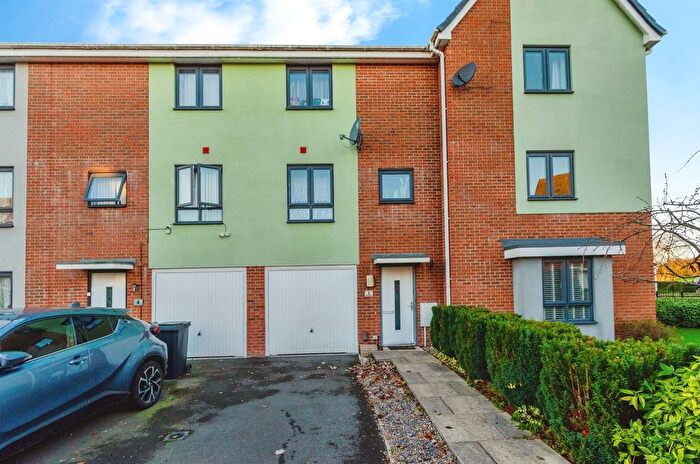
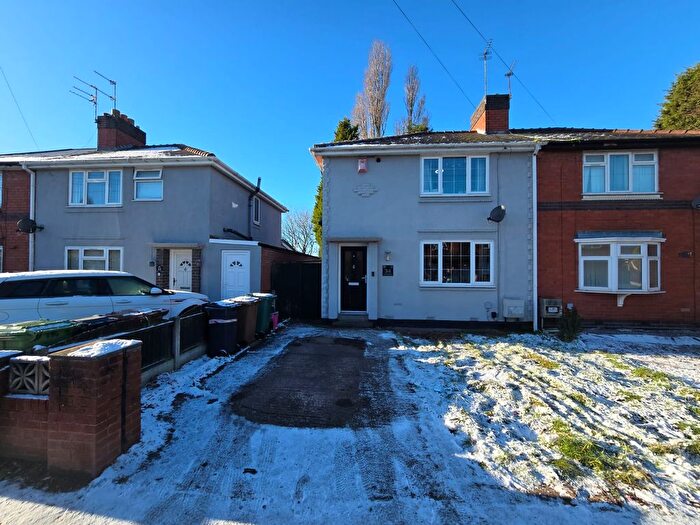
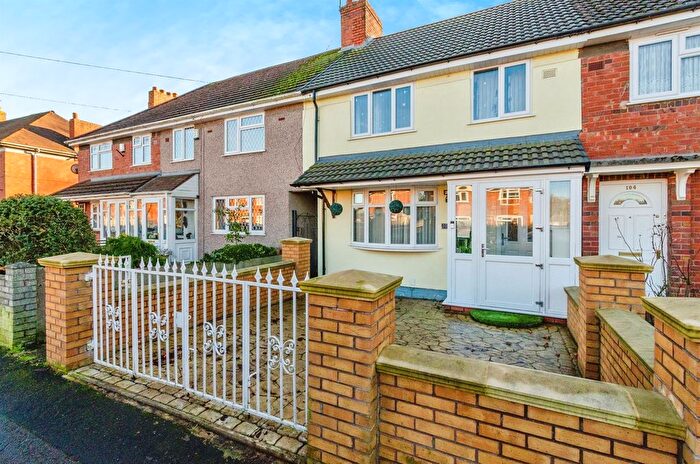
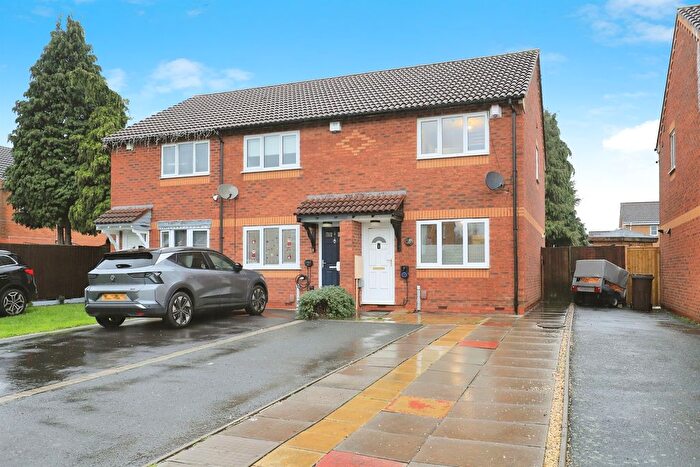
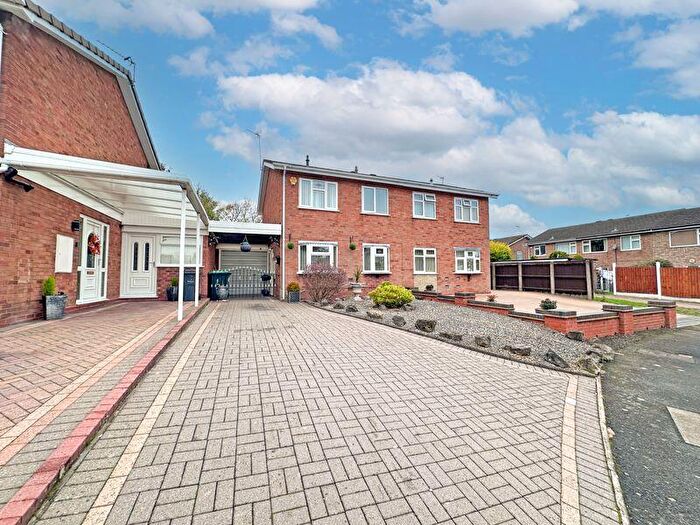
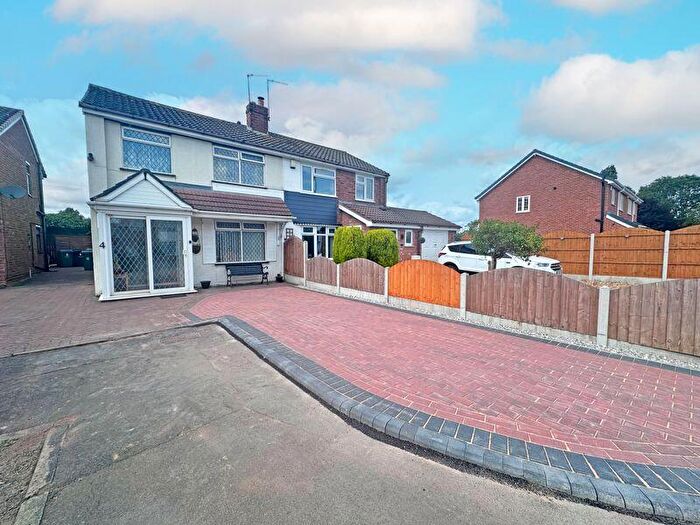
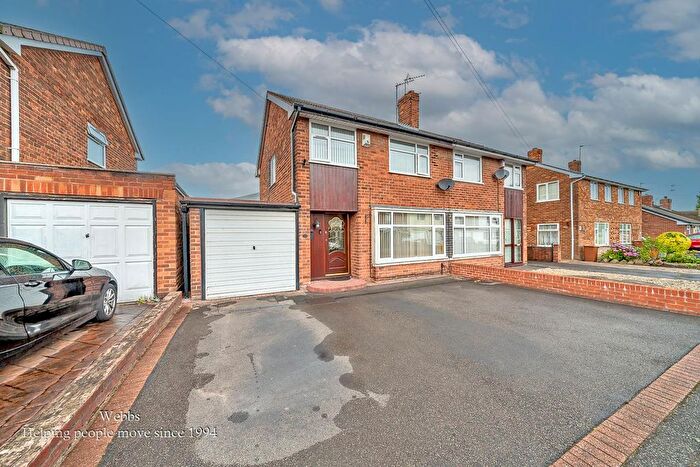
Properties in Darlaston South have an average house price of £178,188.00 and had 61 Property Transactions within the last 3 years¹.
Darlaston South is an area in Bilston, Walsall with 692 households², where the most expensive property was sold for £303,000.00.
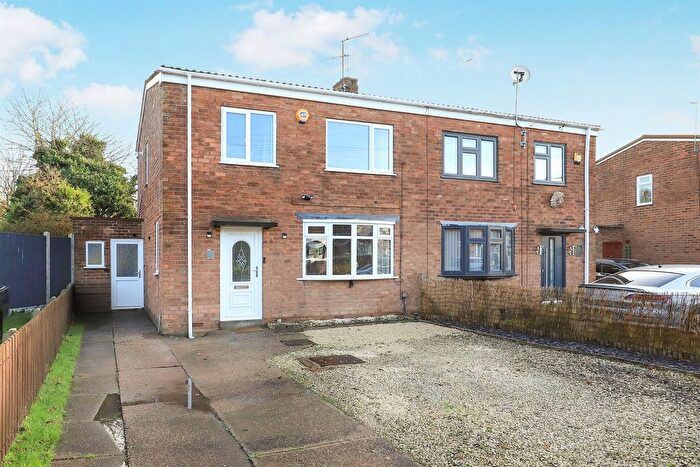
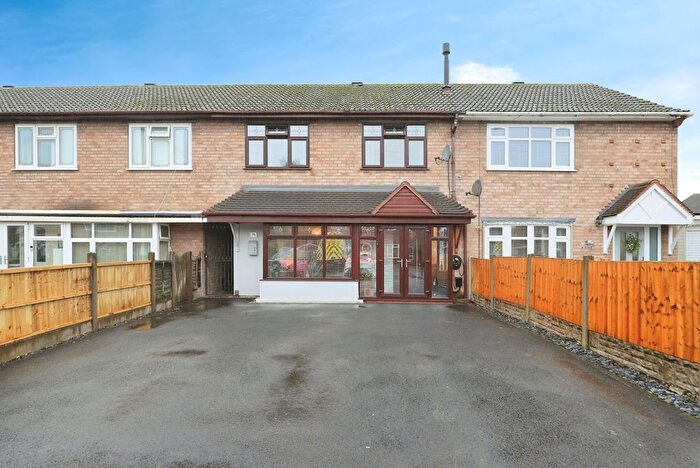
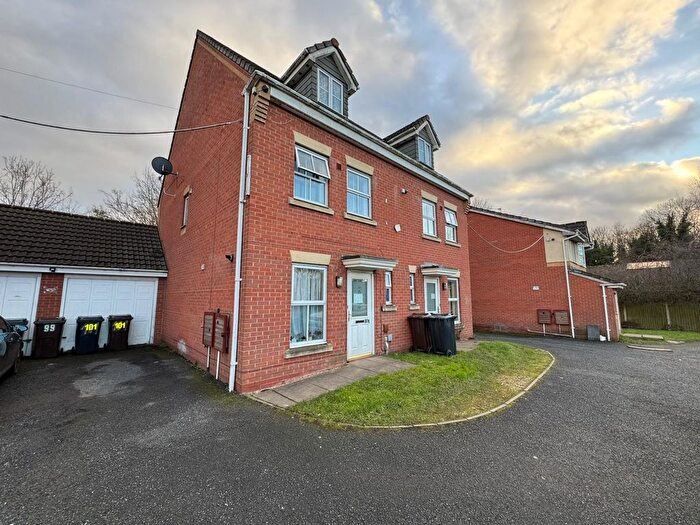
Properties for sale in Darlaston South
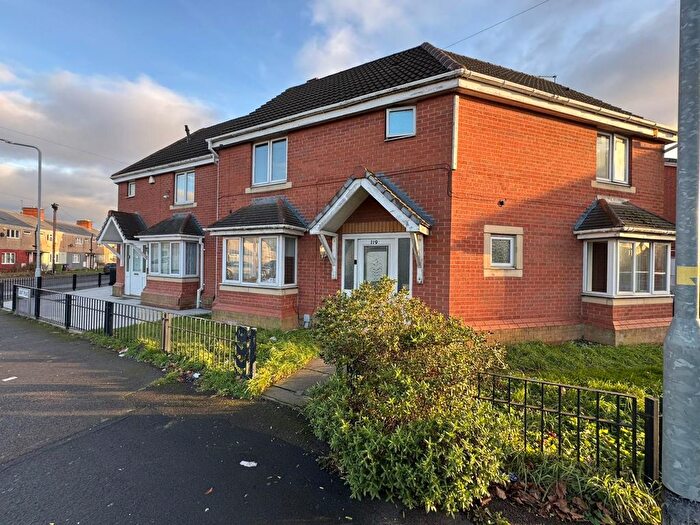
Previously listed properties in Darlaston South
Roads and Postcodes in Darlaston South
Navigate through our locations to find the location of your next house in Darlaston South, Bilston for sale or to rent.
| Streets | Postcodes |
|---|---|
| Arden Place | WV14 8LS |
| Ashtree Grove | WV14 8LX WV14 8LY |
| Aston Close | WV14 8LL |
| Belmont Street | WV14 8ND |
| Bradley Lane | WV14 8EP |
| Bull Lane | WV14 8NE WV14 8NF WV14 8QZ |
| Castle View Road | WV14 8LP WV14 8LW |
| Charnwood Close | WV14 8LZ WV14 8NA WV14 8NB |
| Elder Road | WV14 8QA WV14 8QB |
| Fircroft | WV14 8ER |
| Glyn Avenue | WV14 8NL WV14 8NN |
| Glyn Drive | WV14 8NJ |
| Great Bridge Road | WV14 8LA WV14 8LG WV14 8NG WV14 8NH WV14 8NQ WV14 8NS WV14 8NW WV14 8LB |
| Hannah Road | WV14 8ET |
| Hemlock Way | WV14 8NU |
| Kendrick Place | WV14 8LH |
| Kendrick Road | WV14 8LJ |
| Land Adjoining | WV14 8LT |
| Laurel Grove | WV14 8NP |
| Leighton Road | WV14 8LN WV14 8LQ |
| Lodge Road | WV14 8AH |
| Maple Grove | WV14 8QL |
| Morcroft | WV14 8ES |
| Sorbus Street | WV14 8QF WV14 8QH |
| Sorrel Drive | WV14 8QN WV14 8QY |
| Thorneycroft Place | WV14 8LU |
| Tilia Grove | WV14 8NT |
| Tudor Road | WV14 8LR |
| Walnut Close | WV14 8QJ |
Transport near Darlaston South
- FAQ
- Price Paid By Year
- Property Type Price
Frequently asked questions about Darlaston South
What is the average price for a property for sale in Darlaston South?
The average price for a property for sale in Darlaston South is £178,188. There are 374 property listings for sale in Darlaston South.
What streets have the most expensive properties for sale in Darlaston South?
The streets with the most expensive properties for sale in Darlaston South are Belmont Street at an average of £289,333, Bradley Lane at an average of £225,000 and Sorrel Drive at an average of £216,250.
What streets have the most affordable properties for sale in Darlaston South?
The streets with the most affordable properties for sale in Darlaston South are Kendrick Road at an average of £108,375, Land Adjoining at an average of £140,000 and Morcroft at an average of £159,000.
Which train stations are available in or near Darlaston South?
Some of the train stations available in or near Darlaston South are Coseley, Tipton and Dudley Port.
Property Price Paid in Darlaston South by Year
The average sold property price by year was:
| Year | Average Sold Price | Price Change |
Sold Properties
|
|---|---|---|---|
| 2025 | £190,600 | 12% |
20 Properties |
| 2024 | £168,160 | -6% |
25 Properties |
| 2023 | £178,343 | 7% |
16 Properties |
| 2022 | £165,177 | 15% |
31 Properties |
| 2021 | £140,407 | 11% |
33 Properties |
| 2020 | £125,555 | -22% |
17 Properties |
| 2019 | £152,714 | -0,1% |
38 Properties |
| 2018 | £152,851 | 12% |
58 Properties |
| 2017 | £134,793 | 7% |
83 Properties |
| 2016 | £125,739 | -0,1% |
33 Properties |
| 2015 | £125,808 | 35% |
32 Properties |
| 2014 | £81,558 | 17% |
17 Properties |
| 2013 | £67,812 | 4% |
8 Properties |
| 2012 | £64,833 | 21% |
6 Properties |
| 2011 | £51,142 | -63% |
7 Properties |
| 2010 | £83,500 | 2% |
10 Properties |
| 2009 | £81,666 | -11% |
3 Properties |
| 2008 | £90,497 | 6% |
13 Properties |
| 2007 | £84,730 | 4% |
26 Properties |
| 2006 | £81,245 | -5% |
12 Properties |
| 2005 | £85,436 | 16% |
15 Properties |
| 2004 | £71,567 | 25% |
14 Properties |
| 2003 | £53,855 | 23% |
12 Properties |
| 2002 | £41,408 | 6% |
18 Properties |
| 2001 | £39,107 | -3% |
12 Properties |
| 2000 | £40,277 | -3% |
9 Properties |
| 1999 | £41,363 | 26% |
11 Properties |
| 1998 | £30,672 | -2% |
11 Properties |
| 1997 | £31,142 | -1% |
14 Properties |
| 1996 | £31,565 | 2% |
13 Properties |
| 1995 | £30,850 | - |
15 Properties |
Property Price per Property Type in Darlaston South
Here you can find historic sold price data in order to help with your property search.
The average Property Paid Price for specific property types in the last three years are:
| Property Type | Average Sold Price | Sold Properties |
|---|---|---|
| Semi Detached House | £167,944.00 | 36 Semi Detached Houses |
| Detached House | £289,333.00 | 3 Detached Houses |
| Terraced House | £179,795.00 | 22 Terraced Houses |

