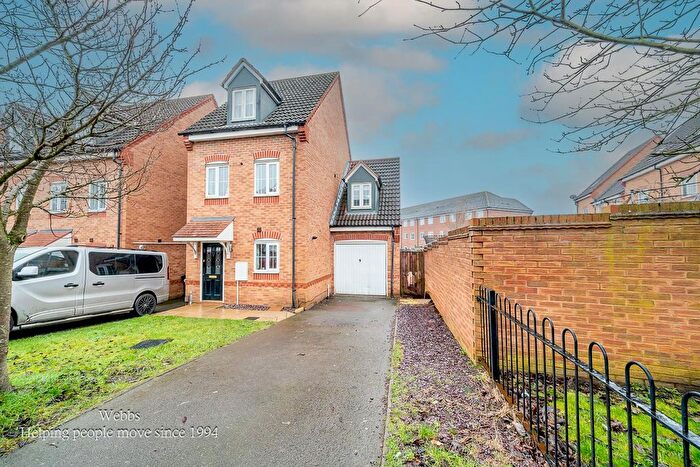
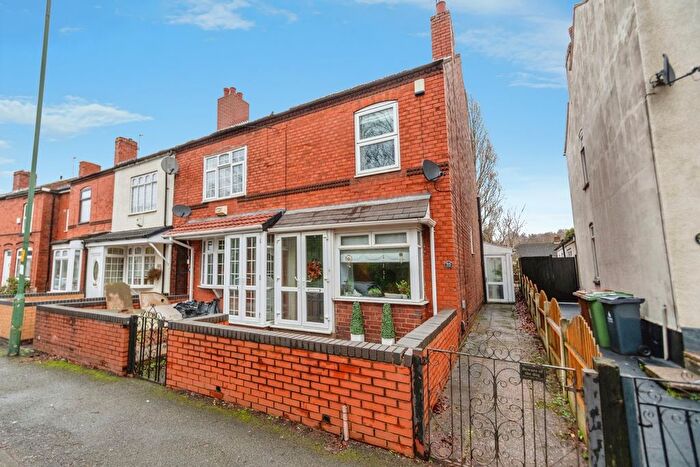
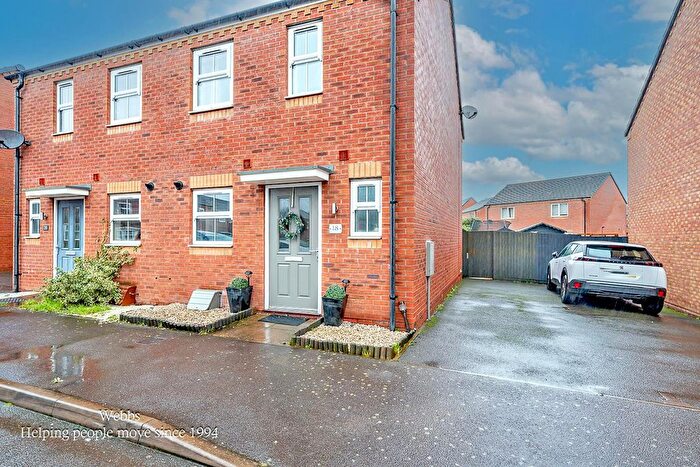
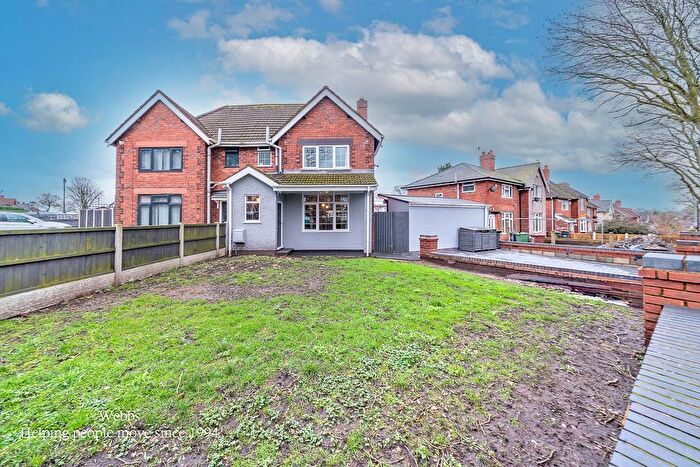
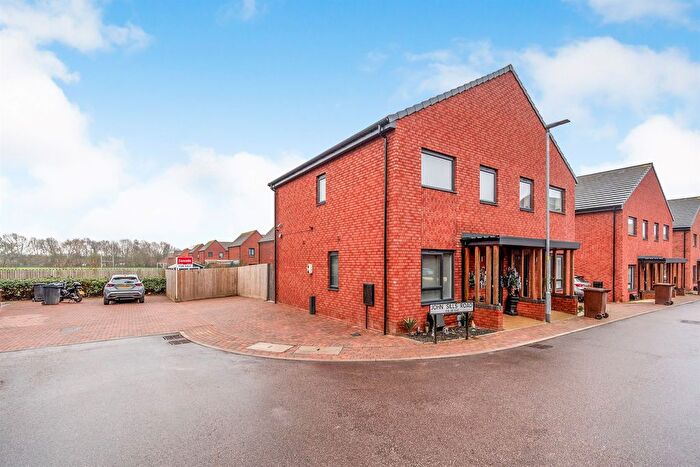
Houses for sale & to rent in Walsall, England
House Prices in Walsall
Properties in Walsall have
an average house price of
£227,745.00
and had 8,065 Property Transactions
within the last 3 years.¹
Walsall is a location in
England with
107,875 households², where the most expensive property was sold for £2,300,000.00.
Properties for sale in Walsall
Towns in Walsall
Navigate through our locations to find the location of your next house in Walsall, England for sale or to rent.
Transport in Walsall
Please see below transportation links in this area:
- FAQ
- Price Paid By Year
- Property Type Price
Frequently asked questions about Walsall
What is the average price for a property for sale in Walsall?
The average price for a property for sale in Walsall is £227,745. This amount is 36% lower than the average price in England. There are more than 10,000 property listings for sale in Walsall.
What locations have the most expensive properties for sale in Walsall?
The locations with the most expensive properties for sale in Walsall are Sutton Coldfield at an average of £355,237, Wolverhampton at an average of £340,179 and Birmingham at an average of £255,100.
What locations have the most affordable properties for sale in Walsall?
The locations with the most affordable properties for sale in Walsall are Wednesbury at an average of £169,587, Bilston at an average of £178,188 and Willenhall at an average of £192,176.
Which train stations are available in or near Walsall?
Some of the train stations available in or near Walsall are Walsall, Bloxwich and Bescot Stadium.
Property Price Paid in Walsall by Year
The average sold property price by year was:
| Year | Average Sold Price | Price Change |
Sold Properties
|
|---|---|---|---|
| 2025 | £231,825 | 2% |
2,367 Properties |
| 2024 | £226,414 | 0,3% |
2,894 Properties |
| 2023 | £225,674 | 2% |
2,804 Properties |
| 2022 | £222,070 | 5% |
3,278 Properties |
| 2021 | £211,598 | 12% |
3,932 Properties |
| 2020 | £186,339 | 3% |
3,010 Properties |
| 2019 | £180,763 | -0,4% |
3,505 Properties |
| 2018 | £181,424 | 5% |
3,652 Properties |
| 2017 | £171,908 | 7% |
3,770 Properties |
| 2016 | £159,930 | 4% |
3,638 Properties |
| 2015 | £153,616 | 1% |
3,483 Properties |
| 2014 | £151,949 | 4% |
3,138 Properties |
| 2013 | £145,235 | 5% |
2,486 Properties |
| 2012 | £138,498 | -1% |
2,099 Properties |
| 2011 | £139,229 | -3% |
2,311 Properties |
| 2010 | £143,326 | 1% |
2,228 Properties |
| 2009 | £141,265 | -2% |
2,136 Properties |
| 2008 | £144,171 | -2% |
2,644 Properties |
| 2007 | £147,623 | 1% |
4,766 Properties |
| 2006 | £145,576 | 6% |
4,665 Properties |
| 2005 | £137,393 | 6% |
3,947 Properties |
| 2004 | £128,549 | 15% |
4,525 Properties |
| 2003 | £109,706 | 16% |
4,350 Properties |
| 2002 | £91,849 | 17% |
4,388 Properties |
| 2001 | £76,444 | 9% |
3,926 Properties |
| 2000 | £69,760 | 7% |
3,816 Properties |
| 1999 | £64,960 | 6% |
3,650 Properties |
| 1998 | £61,197 | 4% |
3,227 Properties |
| 1997 | £58,871 | 6% |
3,563 Properties |
| 1996 | £55,218 | 2% |
3,163 Properties |
| 1995 | £53,857 | - |
2,747 Properties |
Property Price per Property Type in Walsall
Here you can find historic sold price data in order to help with your property search.
The average Property Paid Price for specific property types in the last three years are:
| Property Type | Average Sold Price | Sold Properties |
|---|---|---|
| Semi Detached House | £228,336.00 | 3,221 Semi Detached Houses |
| Terraced House | £180,937.00 | 2,494 Terraced Houses |
| Detached House | £375,157.00 | 1,444 Detached Houses |
| Flat | £119,542.00 | 906 Flats |

