
Houses for sale & to rent in Streetly, Walsall
House Prices in Streetly
Properties in Streetly have an average house price of £448,062.00 and had 16 Property Transactions within the last 3 years¹.
Streetly is an area in Walsall, Walsall with 77 households², where the most expensive property was sold for £1,020,000.00.
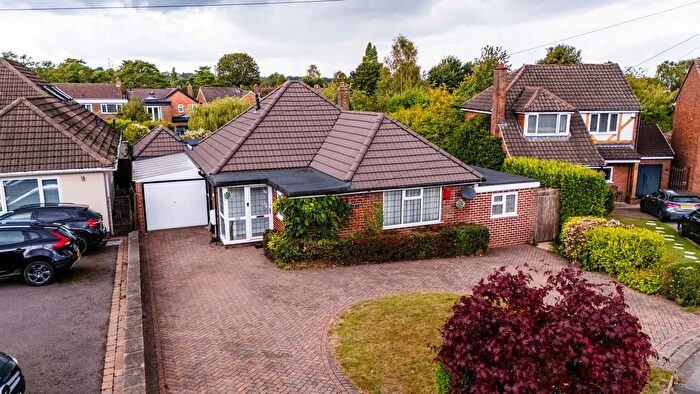
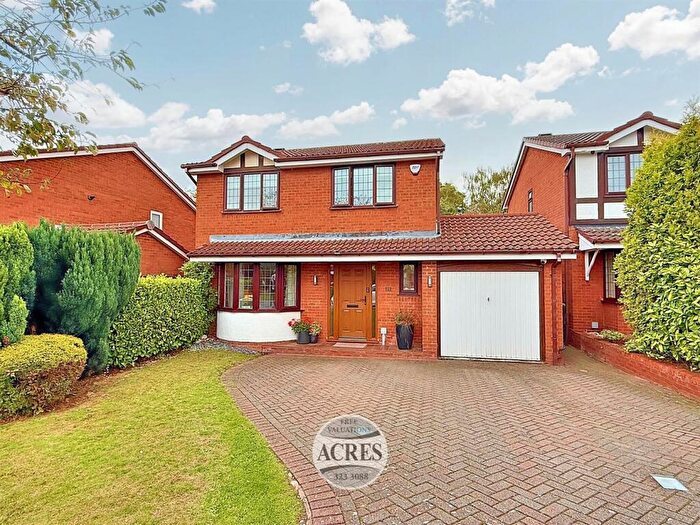
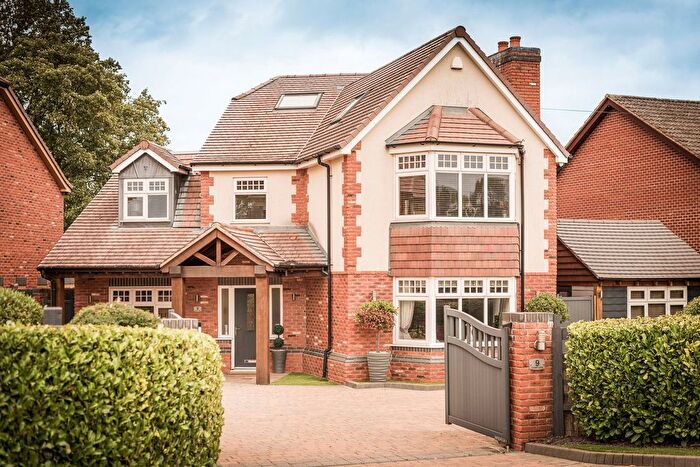
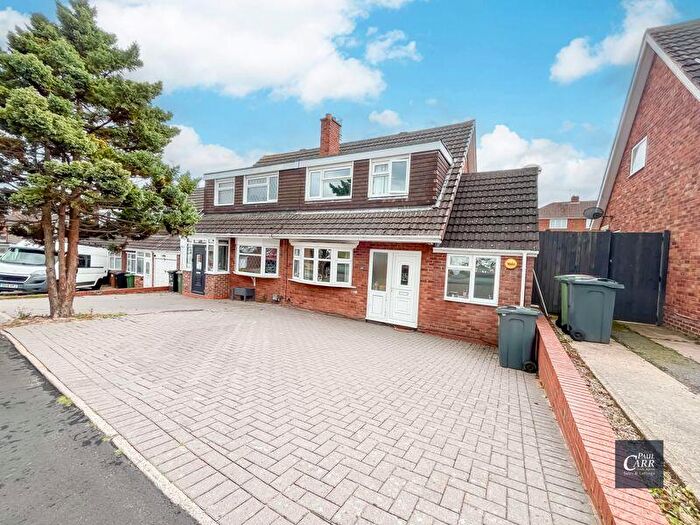
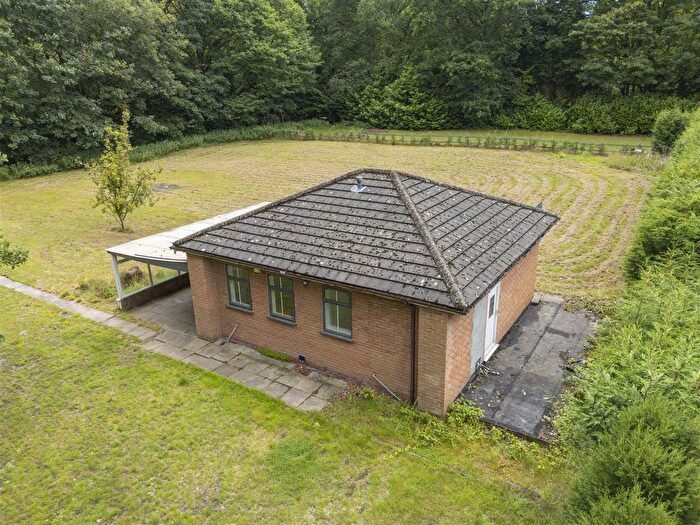
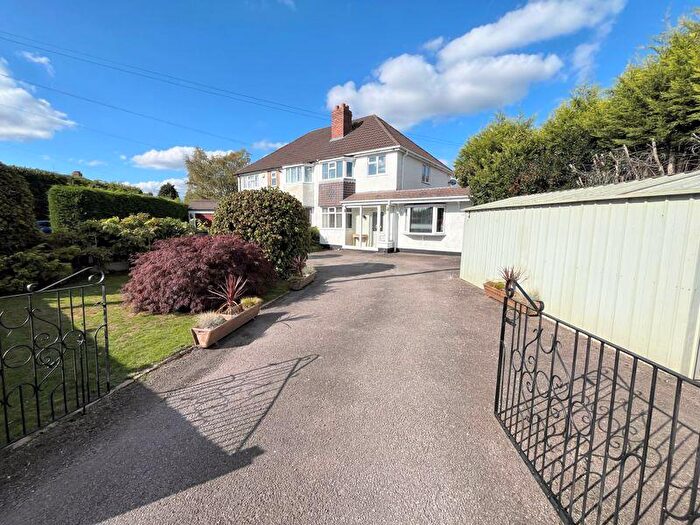
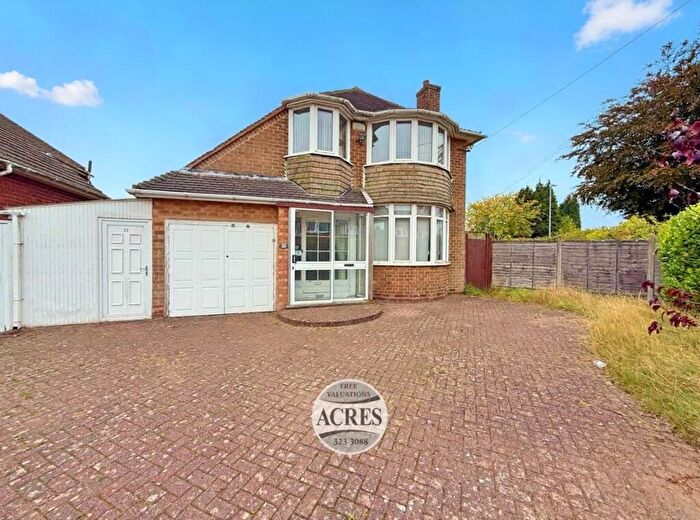
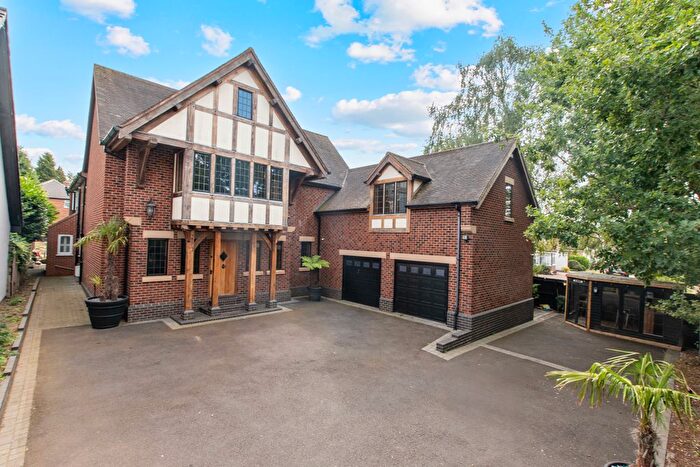
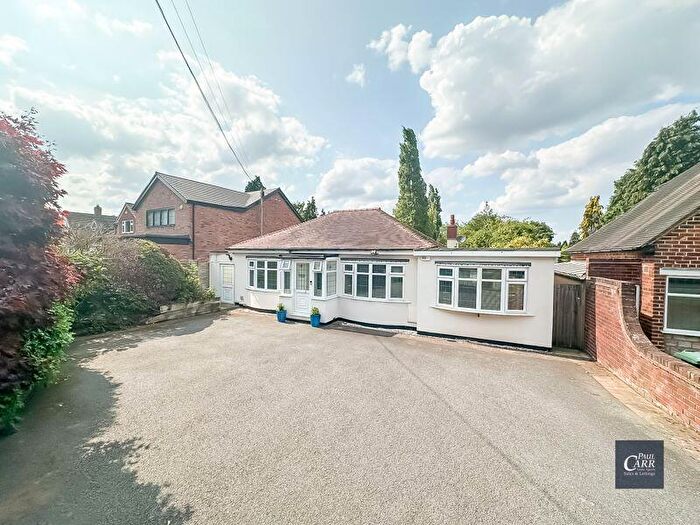
Properties for sale in Streetly
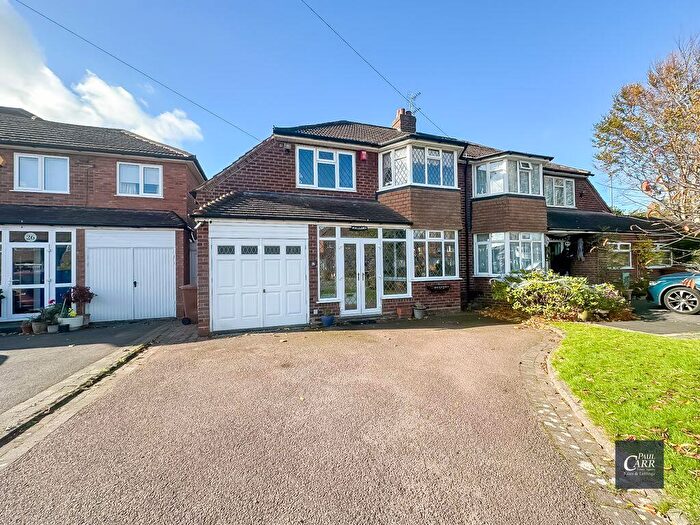
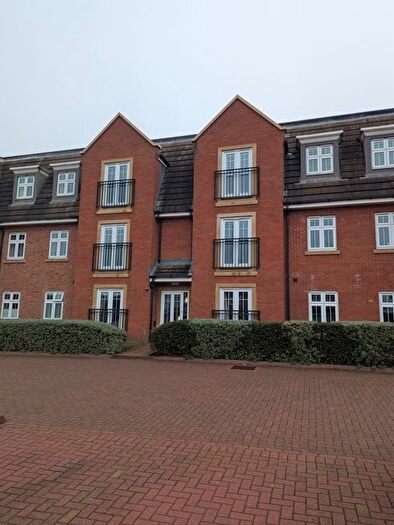
![]()
If you are looking to sell your house, let it out, or receive a property valuation, an expert can help you.
Click the button below to get started.


Roads and Postcodes in Streetly
Navigate through our locations to find the location of your next house in Streetly, Walsall for sale or to rent.
| Streets | Postcodes |
|---|---|
| Beacon Hill | WS9 0RH WS9 0RJ |
| Brandon Close | WS9 0PN |
| Chester Road | WS9 0PH |
| Hingley Croft | WS9 0PL |
| Leacliffe Way | WS9 0PW |
| Raglan Close | WS9 0PJ |
Transport near Streetly

- FAQ
- Price Paid By Year
- Property Type Price
Frequently asked questions about Streetly
What is the average price for a property for sale in Streetly?
The average price for a property for sale in Streetly is £448,062. This amount is 100% higher than the average price in Walsall. There are 448 property listings for sale in Streetly.
What streets have the most expensive properties for sale in Streetly?
The streets with the most expensive properties for sale in Streetly are Chester Road at an average of £577,375 and Hingley Croft at an average of £344,000.
What streets have the most affordable properties for sale in Streetly?
The streets with the most affordable properties for sale in Streetly are Brandon Close at an average of £257,000 and Beacon Hill at an average of £326,000.
Which train stations are available in or near Streetly?
Some of the train stations available in or near Streetly are Blake Street, Butlers Lane and Four Oaks.
Property Price Paid in Streetly by Year
The average sold property price by year was:
| Year | Average Sold Price | Price Change |
Sold Properties
|
|---|---|---|---|
| 2025 | £320,000 | -49% |
1 Property |
| 2024 | £476,800 | 23% |
5 Properties |
| 2023 | £366,000 | -31% |
3 Properties |
| 2022 | £481,000 | 19% |
7 Properties |
| 2021 | £391,250 | 16% |
2 Properties |
| 2020 | £329,500 | 7% |
4 Properties |
| 2019 | £307,500 | -40% |
1 Property |
| 2018 | £429,666 | 12% |
3 Properties |
| 2017 | £378,000 | 16% |
3 Properties |
| 2016 | £318,387 | 24% |
8 Properties |
| 2015 | £242,500 | 5% |
2 Properties |
| 2014 | £230,000 | -11% |
4 Properties |
| 2013 | £254,666 | 24% |
3 Properties |
| 2012 | £192,316 | -45% |
3 Properties |
| 2011 | £279,250 | 12% |
4 Properties |
| 2010 | £245,975 | 13% |
2 Properties |
| 2009 | £215,000 | 9% |
3 Properties |
| 2008 | £195,000 | -80% |
1 Property |
| 2007 | £351,500 | 31% |
3 Properties |
| 2006 | £240,975 | 8% |
4 Properties |
| 2005 | £222,862 | 9% |
4 Properties |
| 2004 | £203,500 | -4% |
2 Properties |
| 2003 | £212,000 | 31% |
2 Properties |
| 2002 | £145,687 | 13% |
8 Properties |
| 2001 | £127,000 | 7% |
1 Property |
| 2000 | £117,500 | 16% |
2 Properties |
| 1999 | £98,490 | 16% |
5 Properties |
| 1998 | £82,375 | -7% |
4 Properties |
| 1997 | £88,166 | 10% |
3 Properties |
| 1996 | £79,000 | 1% |
2 Properties |
| 1995 | £78,000 | - |
1 Property |
Property Price per Property Type in Streetly
Here you can find historic sold price data in order to help with your property search.
The average Property Paid Price for specific property types in the last three years are:
| Property Type | Average Sold Price | Sold Properties |
|---|---|---|
| Semi Detached House | £398,857.00 | 7 Semi Detached Houses |
| Detached House | £486,333.00 | 9 Detached Houses |