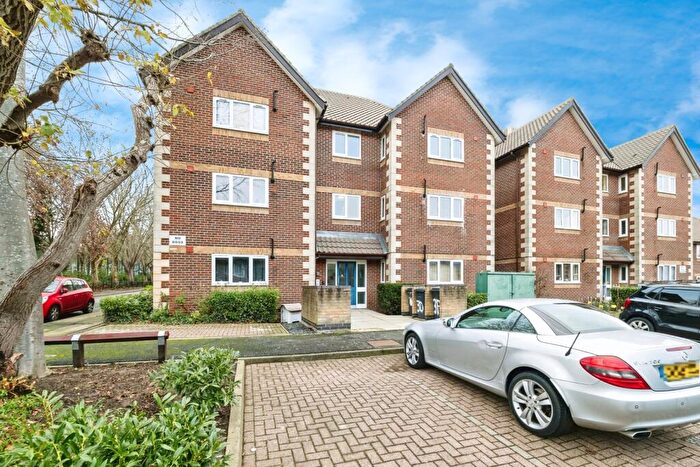
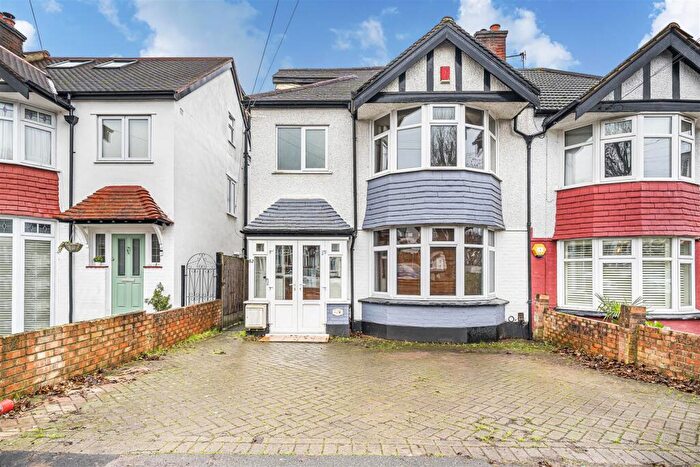
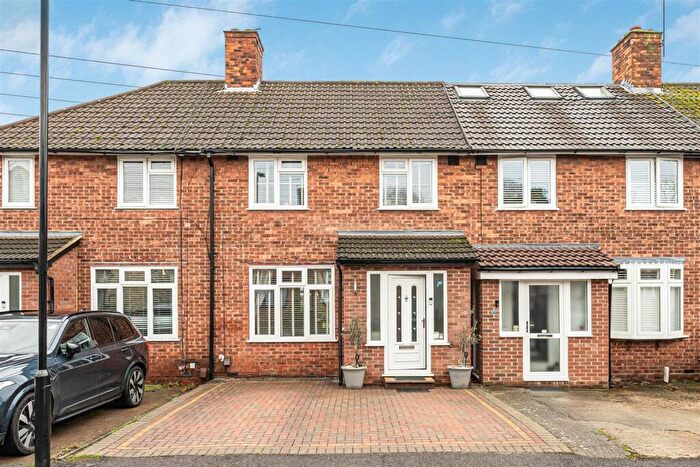
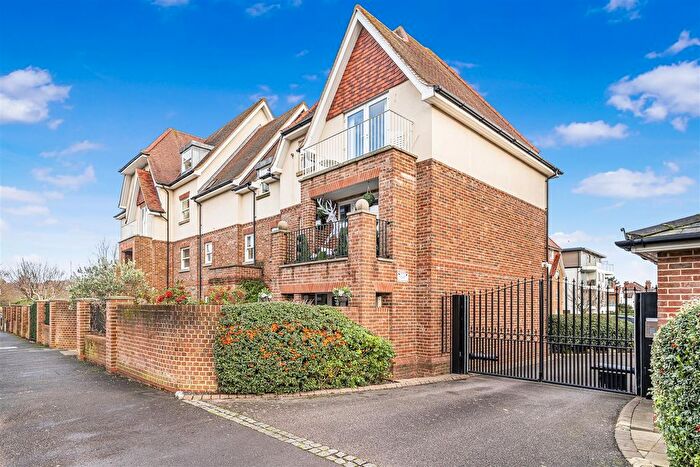
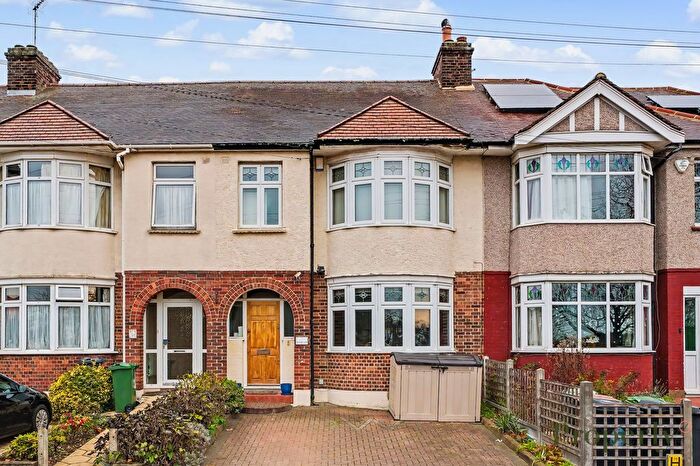
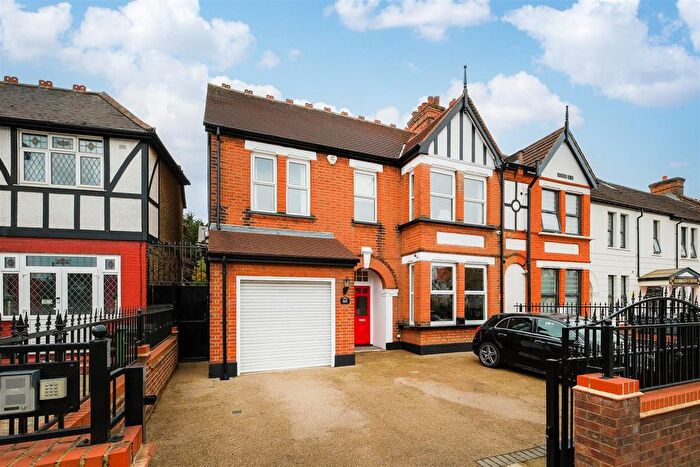
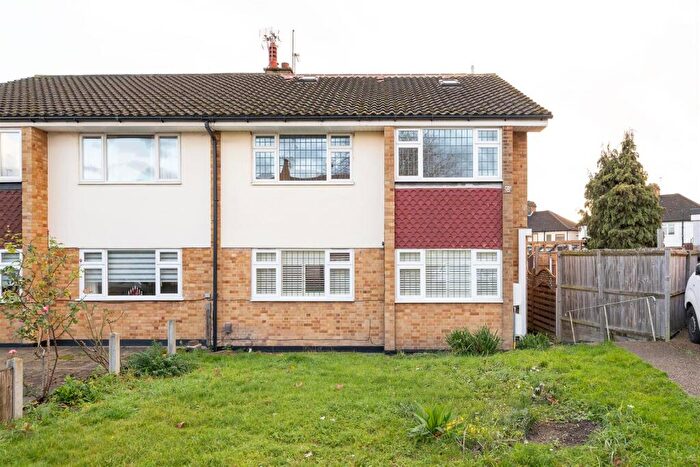
Houses for sale & to rent in Chingford Green, London
House Prices in Chingford Green
Properties in this part of Chingford Green within London have an average house price of £574,043.00 and had 529 Property Transactions within the last 3 years¹. This area has 4,467 households² , where the most expensive property was sold for £1,750,000.00.
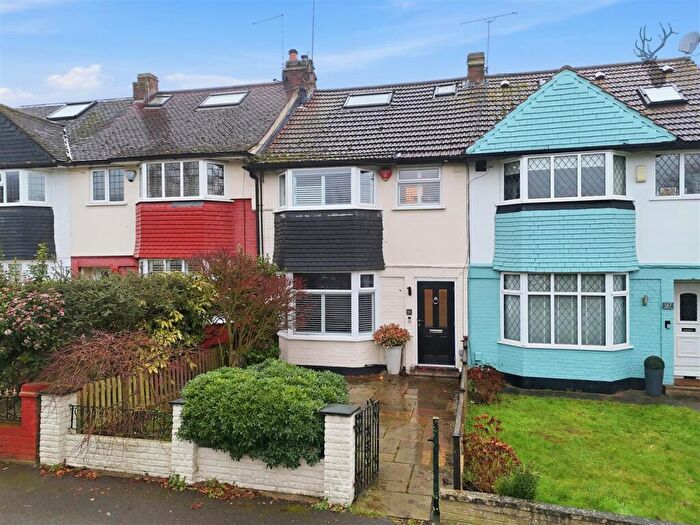
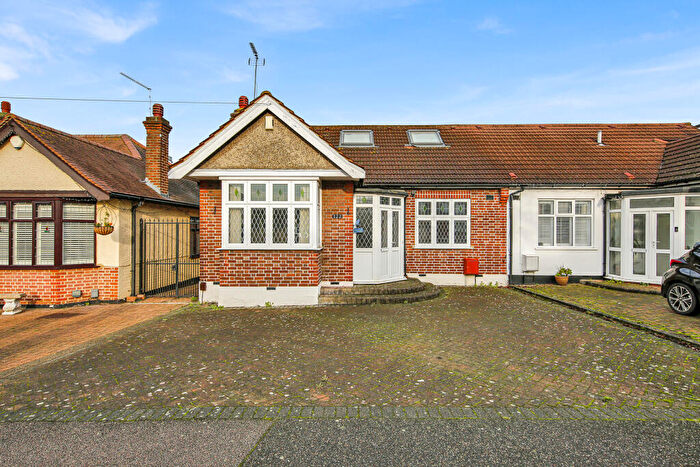
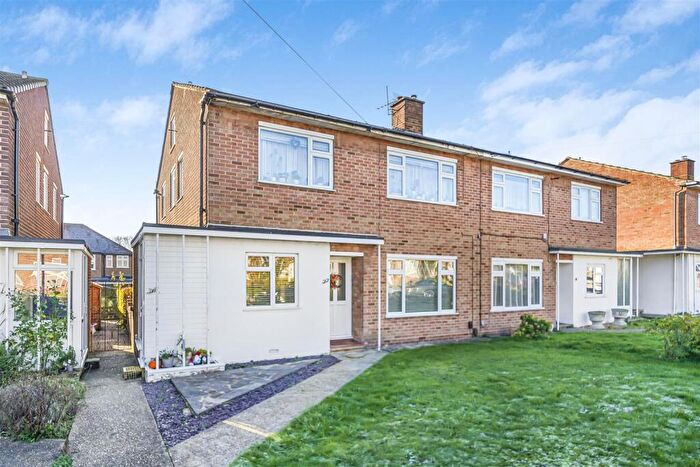
Properties for sale in Chingford Green
Roads and Postcodes in Chingford Green
Navigate through our locations to find the location of your next house in Chingford Green, London for sale or to rent.
| Streets | Postcodes |
|---|---|
| Amesbury Drive | E4 7PZ |
| Antlers Hill | E4 7RT E4 7RX E4 7RY |
| Arabia Close | E4 7DU |
| Beech Tree Glade | E4 6BG |
| Beresford Road | E4 6ED E4 6EE E4 6EF E4 6EP E4 6FY |
| Blandford Crescent | E4 7NT |
| Boardman Avenue | E4 7QB E4 7QD |
| Bury Road | E4 7QJ |
| Buxton Road | E4 7DP E4 7FP |
| Cambridge Road | E4 7BP |
| Carbis Close | E4 7HW |
| Cart Lane | E4 7DH |
| Charles Place | E4 7DW |
| Chelwood Close | E4 7UN E4 7UW |
| Connaught Avenue | E4 7AA E4 7AB E4 7AE E4 7AF E4 7AG E4 7AP E4 7AQ E4 7UE E4 7UF |
| Connaught Road | E4 7DL |
| Crescent Road | E4 6AT E4 6AU E4 6AX E4 6AY E4 6AZ E4 6BL |
| Cross Road | E4 7DQ |
| Deer Leap Grove | E4 7RU |
| Dells Close | E4 7TN E4 7TW |
| Douglas Road | E4 6DA E4 6DB |
| Drysdale Avenue | E4 7NJ E4 7NL E4 7PD E4 7PE |
| Eglington Road | E4 7AN E4 7AS E4 7AT |
| Epping Glade | E4 7PQ |
| Epping Way | E4 7PB E4 7PG |
| Essex Road | E4 6DG |
| Farnley Road | E4 7AD |
| Faversham Avenue | E4 6DT |
| Forest Approach | E4 7AZ |
| Forest Avenue | E4 6AR E4 6AS |
| Forest Court | E4 6BJ |
| Forest Side | E4 6BA E4 6BE |
| Forest View | E4 7AR E4 7AU E4 7AW E4 7AX E4 7AY E4 7GA E4 7UA E4 7UD |
| Frederica Road | E4 7AL |
| Garfield Road | E4 7DG |
| Gilwell Close | E4 7RZ |
| Glendower Road | E4 7BS |
| Gordon Road | E4 6BS E4 6BT E4 6BU E4 6BX E4 6DL |
| Harford Close | E4 7NH |
| Harford Road | E4 7NQ |
| Hawkdene | E4 7PF |
| Hawksmouth | E4 7NA |
| Hawkwood Crescent | E4 7PH E4 7PJ E4 7PL E4 7PN E4 7UH |
| Holly Drive | E4 7NG |
| Jubilee Villas | E4 7EW |
| Kimberley Road | E4 6DD E4 6DF E4 6DQ |
| Kimberley Way | E4 6DE |
| Kings Head Hill | E4 7EA E4 7LY E4 7NU E4 7NX E4 7PP E4 7PW E4 7NB E4 7ND E4 7NE E4 7NF |
| Kings Road | E4 7HP |
| Laurel Gardens | E4 7PS |
| Lea Valley Road | E4 7PX |
| Littleton Avenue | E4 6DS |
| Long Deacon Road | E4 6EG |
| Low Hall Close | E4 7JR |
| Maida Avenue | E4 7JH E4 7JJ E4 7JN |
| Maida Way | E4 7JL |
| Mansfield Hill | E4 7JP |
| Margaret Avenue | E4 7NP |
| Mark Avenue | E4 7NR |
| Markfield Gardens | E4 7NN E4 7NS |
| Merryhill Close | E4 7PT |
| Mornington Road | E4 7DR E4 7DS E4 7DT |
| Mount View Road | E4 7EF |
| Oakhurst Gardens | E4 6BQ |
| Parkhill Road | E4 7ED |
| Pole Hill Road | E4 7LZ |
| Queens Grove Road | E4 7BT |
| Queens Walk | E4 7EP |
| Rangers Road | E4 7QH |
| Redwood Gardens | E4 7NZ |
| Richmond Road | E4 7BN |
| Sewardstone Gardens | E4 7QE |
| Sewardstone Road | E4 7JW E4 7PA E4 7PR E4 7PU E4 7PY E4 7QA E4 7TA |
| Shaftesbury Road | E4 7BW |
| South Avenue | E4 7NW |
| Springfield Road | E4 7DJ |
| Stanley Road | E4 7DB E4 7DD |
| Station Approach | E4 6AL |
| Station Road | E4 6AG E4 6AN E4 7BA E4 7BE E4 7BH E4 7BJ E4 7BU E4 6AA E4 6AB E4 6AD E4 6AP E4 6BN E4 7BB E4 7BQ |
| Sunnyside Drive | E4 7DZ |
| Taverners Way | E4 6DJ |
| Thaxton Place | E4 7EQ |
| The Copse | E4 6BH |
| The Drive | E4 7AH E4 7AJ |
| The Green | E4 7EN |
| The Green Walk | E4 7ER |
| Top House Rise | E4 7EE |
| Valance Avenue | E4 6DR |
| Victoria Road | E4 6BY E4 6BZ |
| Village Arcade | E4 7DA |
| Waltham Forest | E4 0AW E4 0BE E4 0BL E4 0DE E4 0DX E4 0EA E4 0EF E4 0EH E4 0ES E4 0FH E4 0FL E4 0FN E4 0FY E4 0GA E4 0GB E4 0GF E4 0GJ E4 0GL E4 0GN E4 0GR E4 0GU E4 0GW E4 0GX E4 6FN E4 7XJ E4 7YF E4 0BQ E4 0HA E4 0HB E4 0HX E4 0HY E4 0HZ E4 0JE E4 0JJ E4 0JL E4 0JN E4 0JP E4 0JQ E4 0JR E4 0JS E4 0JT E4 0JU |
| Warren Pond Road | E4 6BD |
| Westminster Gardens | E4 6ER |
| Whitehall Gardens | E4 6EH E4 6EJ |
| Whitehall Road | E4 6DH E4 6DW E4 6EQ |
| Willow Street | E4 7EG |
| Woodberry Way | E4 7DX E4 7DY |
| Woodedge Close | E4 6BB |
| Yardley Close | E4 7SE |
| Yardley Lane | E4 7RS |
| E4 0JW E4 0JX |
Transport near Chingford Green
-
Chingford Station
-
Ponders End Station
-
Highams Park Station
-
Buckhurst Hill Station
-
Brimsdown Station
-
Roding Valley Station
-
Woodford Station
-
Loughton Station
-
Southbury Station
-
Angel Road Station
- FAQ
- Price Paid By Year
- Property Type Price
Frequently asked questions about Chingford Green
What is the average price for a property for sale in Chingford Green?
The average price for a property for sale in Chingford Green is £574,043. This amount is 7% higher than the average price in London. There are 1,288 property listings for sale in Chingford Green.
What streets have the most expensive properties for sale in Chingford Green?
The streets with the most expensive properties for sale in Chingford Green are The Drive at an average of £1,155,000, The Green Walk at an average of £995,000 and Oakhurst Gardens at an average of £976,000.
What streets have the most affordable properties for sale in Chingford Green?
The streets with the most affordable properties for sale in Chingford Green are Chelwood Close at an average of £158,647, Redwood Gardens at an average of £274,444 and The Copse at an average of £336,000.
Which train stations are available in or near Chingford Green?
Some of the train stations available in or near Chingford Green are Chingford, Ponders End and Highams Park.
Which tube stations are available in or near Chingford Green?
Some of the tube stations available in or near Chingford Green are Buckhurst Hill, Roding Valley and Woodford.
Property Price Paid in Chingford Green by Year
The average sold property price by year was:
| Year | Average Sold Price | Price Change |
Sold Properties
|
|---|---|---|---|
| 2025 | £553,493 | -3% |
100 Properties |
| 2024 | £569,308 | -2% |
138 Properties |
| 2023 | £579,162 | -1% |
137 Properties |
| 2022 | £587,075 | 6% |
154 Properties |
| 2021 | £550,772 | 10% |
187 Properties |
| 2020 | £495,564 | 5% |
119 Properties |
| 2019 | £470,958 | 0,1% |
169 Properties |
| 2018 | £470,423 | -2% |
163 Properties |
| 2017 | £482,049 | 11% |
150 Properties |
| 2016 | £426,974 | 1% |
169 Properties |
| 2015 | £421,843 | 11% |
189 Properties |
| 2014 | £374,569 | 14% |
157 Properties |
| 2013 | £321,710 | 8% |
160 Properties |
| 2012 | £296,156 | -2% |
130 Properties |
| 2011 | £302,772 | 7% |
120 Properties |
| 2010 | £282,485 | 3% |
111 Properties |
| 2009 | £272,953 | -4% |
119 Properties |
| 2008 | £283,358 | -13% |
116 Properties |
| 2007 | £318,990 | 16% |
243 Properties |
| 2006 | £269,108 | 0,4% |
251 Properties |
| 2005 | £268,020 | 11% |
223 Properties |
| 2004 | £237,230 | 3% |
227 Properties |
| 2003 | £230,565 | 15% |
223 Properties |
| 2002 | £196,161 | 14% |
223 Properties |
| 2001 | £168,512 | 17% |
227 Properties |
| 2000 | £140,103 | 8% |
204 Properties |
| 1999 | £128,817 | 16% |
259 Properties |
| 1998 | £108,659 | 12% |
260 Properties |
| 1997 | £95,176 | 4% |
185 Properties |
| 1996 | £91,220 | -2% |
187 Properties |
| 1995 | £92,695 | - |
147 Properties |
Property Price per Property Type in Chingford Green
Here you can find historic sold price data in order to help with your property search.
The average Property Paid Price for specific property types in the last three years are:
| Property Type | Average Sold Price | Sold Properties |
|---|---|---|
| Flat | £339,139.00 | 174 Flats |
| Semi Detached House | £732,255.00 | 191 Semi Detached Houses |
| Detached House | £1,096,066.00 | 15 Detached Houses |
| Terraced House | £592,998.00 | 149 Terraced Houses |

