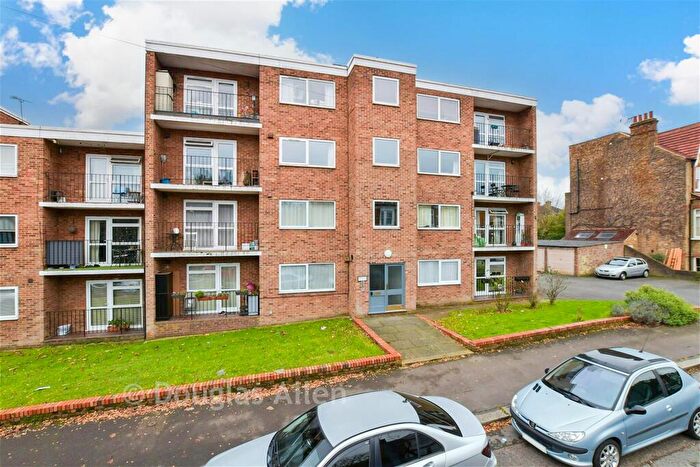
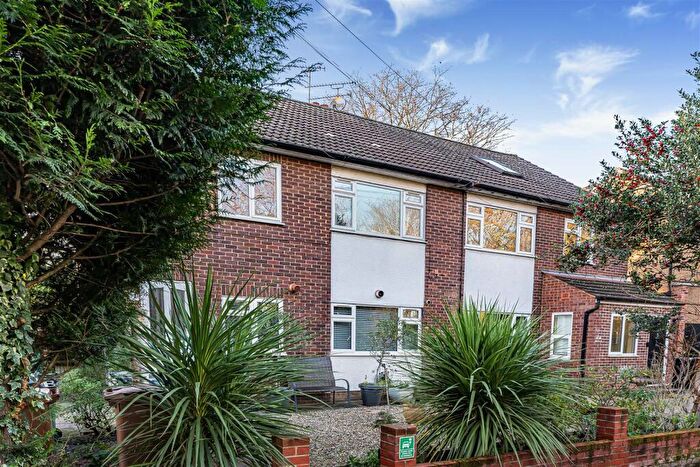
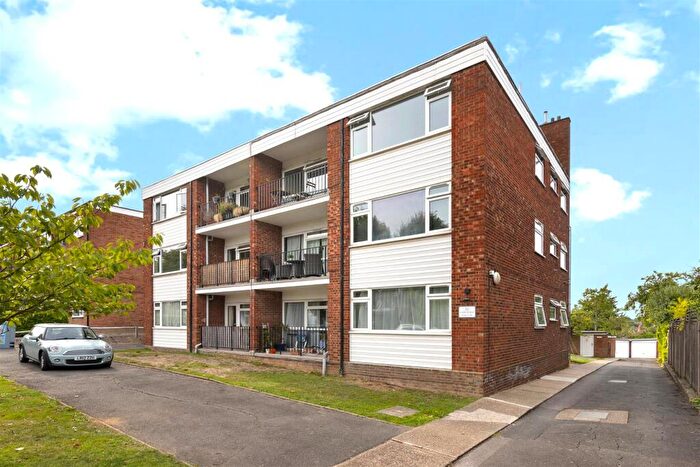
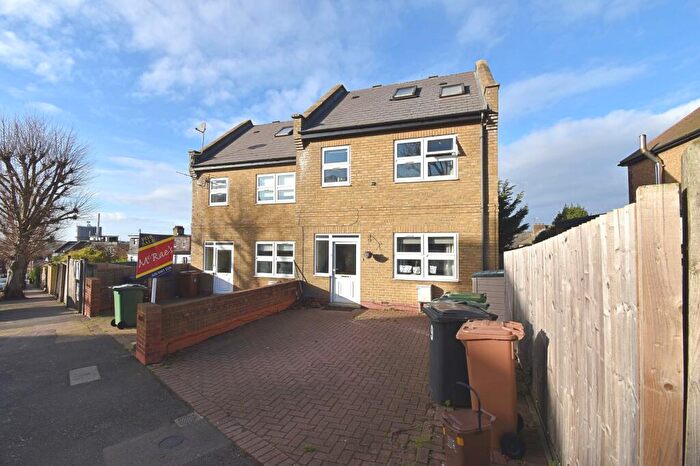
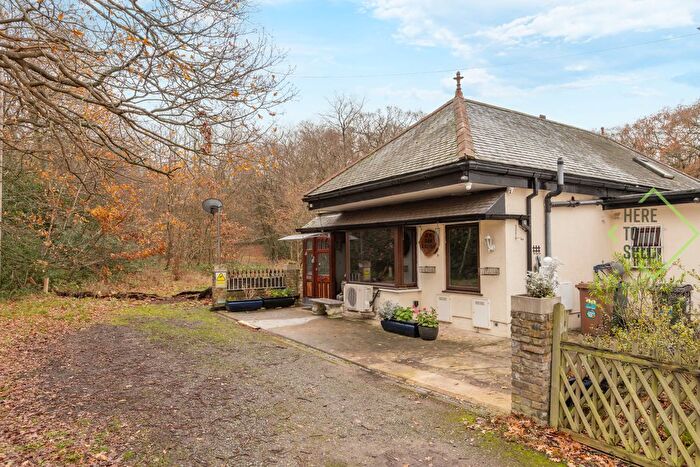
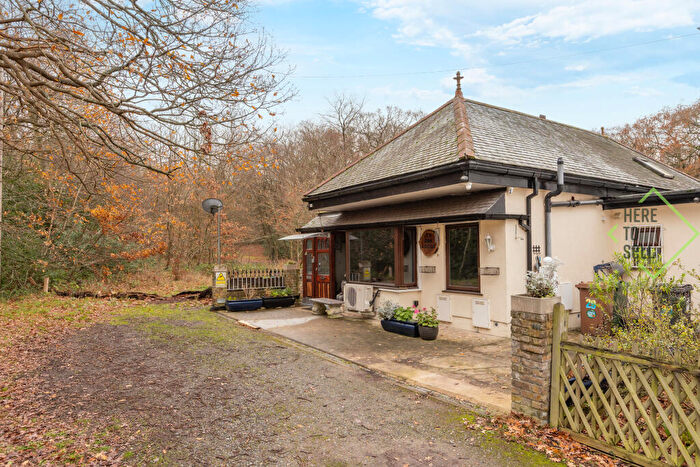
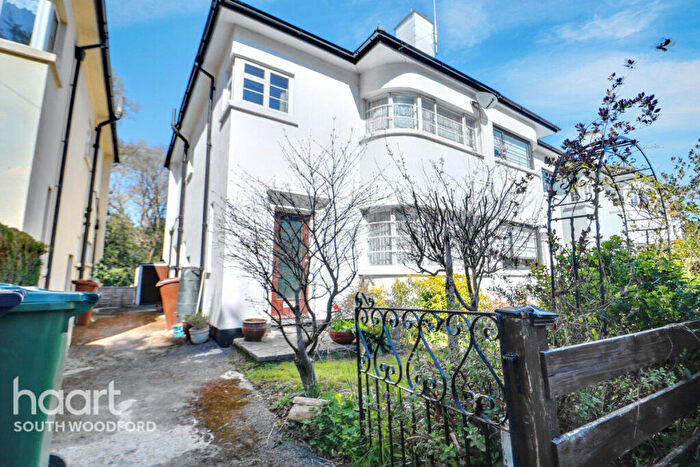
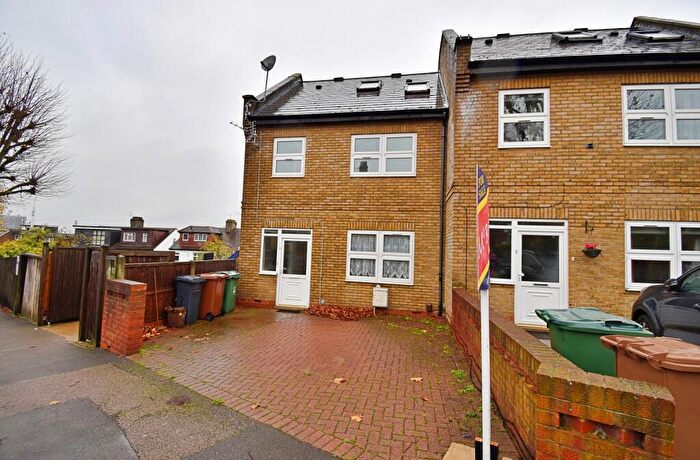
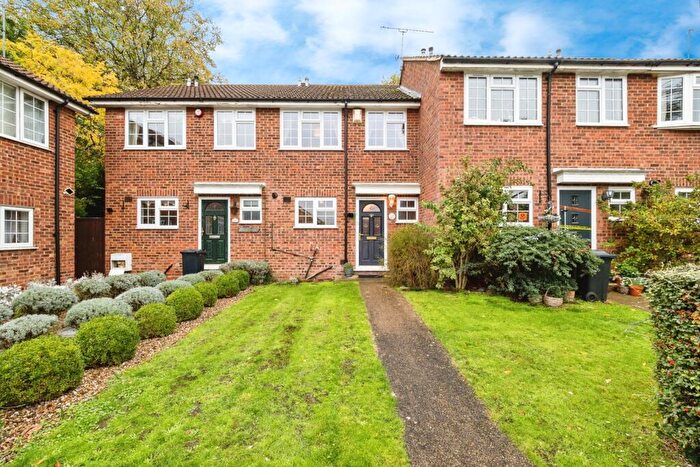
Houses for sale & to rent in Hatch Lane, Woodford Green
House Prices in Hatch Lane
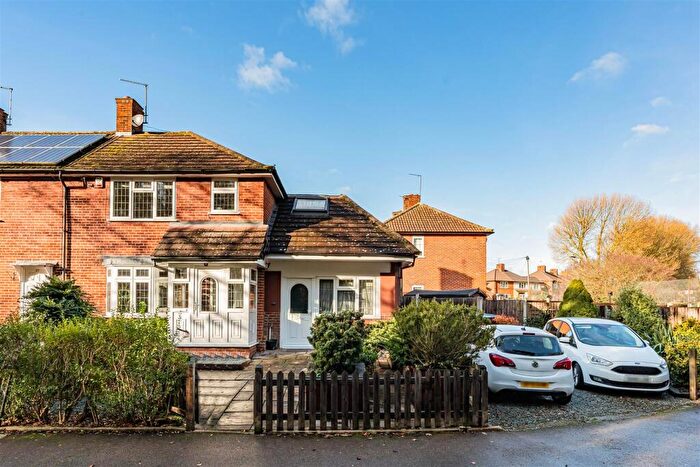
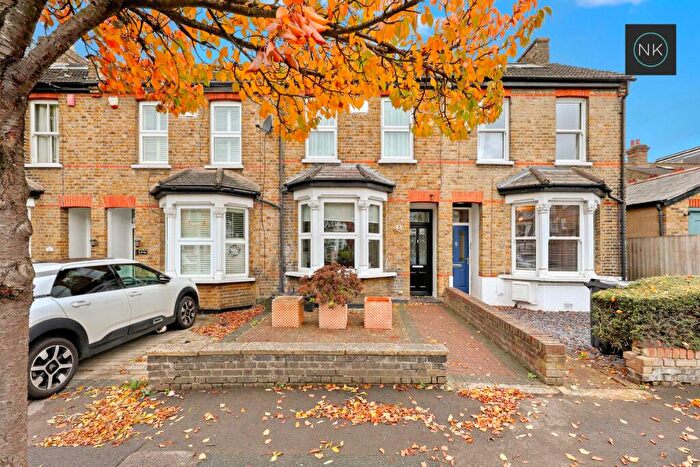
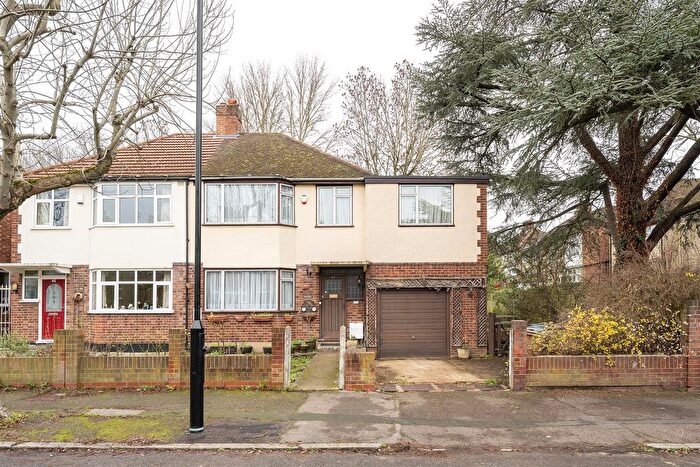
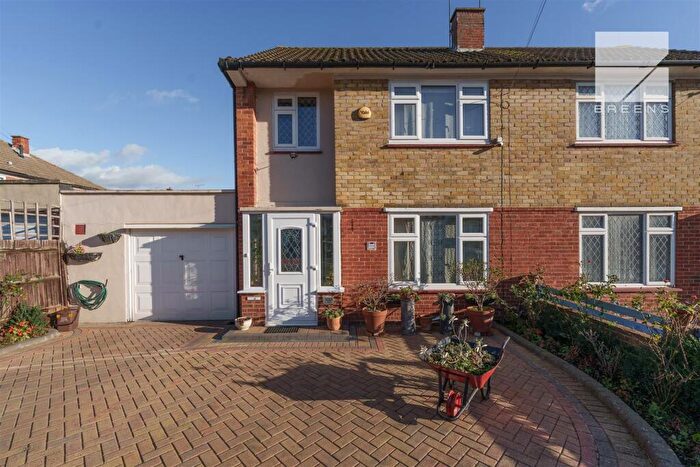
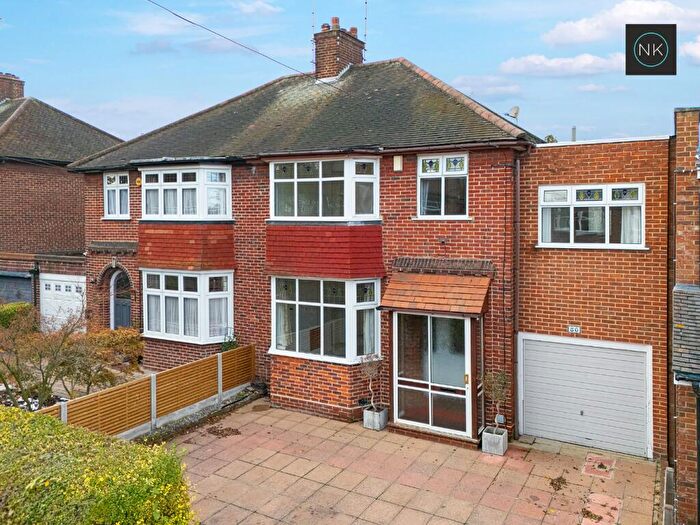
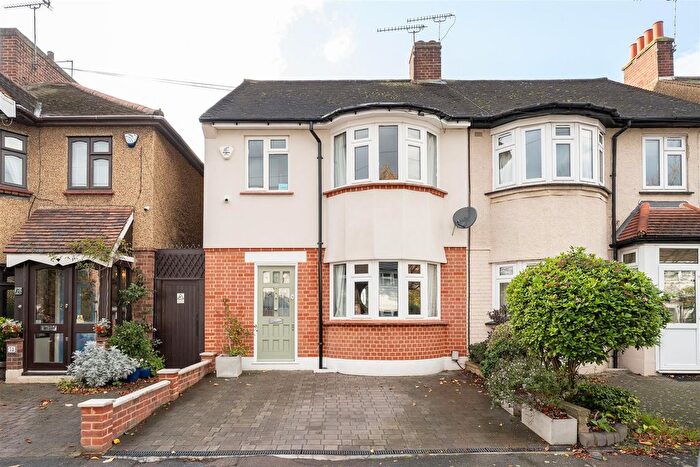
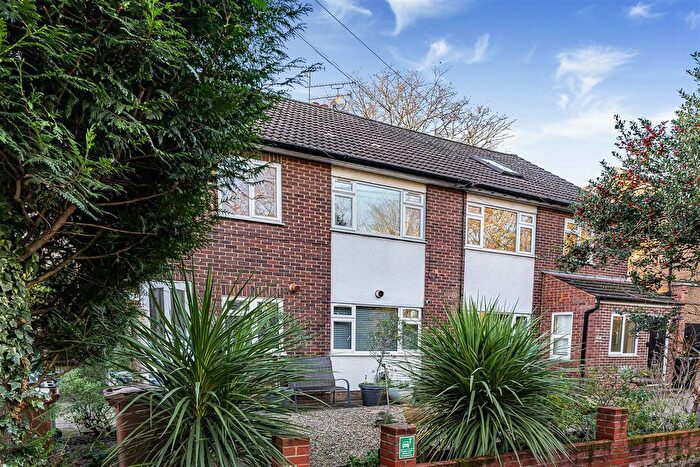
Properties in this part of Hatch Lane within Woodford Green have an average house price of £513,987.00 and had 88 Property Transactions within the last 3 years¹. This area has 757 households² , where the most expensive property was sold for £1,325,000.00.
Properties for sale in Hatch Lane
Roads and Postcodes in Hatch Lane
Navigate through our locations to find the location of your next house in Hatch Lane, Woodford Green for sale or to rent.
| Streets | Postcodes |
|---|---|
| Beechwood Drive | IG8 9QX IG8 9QY |
| Chingford Lane | IG8 9QL IG8 9QP IG8 9QQ IG8 9QR IG8 9QS IG8 9QT IG8 9QW |
| Crealock Grove | IG8 9QZ |
| Elm Grove | IG8 0UW |
| Henrys Avenue | IG8 9RA IG8 9RB |
| High Elms | IG8 0UP |
| Keynsham Avenue | IG8 9SZ |
| Lichfield Road | IG8 9ST IG8 9SY |
| Marion Grove | IG8 9TA |
| Mason Road | IG8 9SX |
| Mill Lane | IG8 0UL IG8 0UN |
| Montalt Road | IG8 9RS IG8 9RU IG8 9RX IG8 9RY IG8 9SA IG8 9SD IG8 9SE IG8 9SF IG8 9SN IG8 9SP IG8 9SQ IG8 9SS IG8 9SW IG8 9TB IG8 9TD IG8 9TG IG8 9RT IG8 9RZ IG8 9SB IG8 9SG IG8 9SH IG8 9SJ IG8 9SL IG8 9SR |
| Payzes Gardens | IG8 9QN |
| Wood Lane | IG8 9TE IG8 9TF IG8 9TL |
Transport near Hatch Lane
-
Highams Park Station
-
Woodford Station
-
Roding Valley Station
-
Chingford Station
-
South Woodford Station
-
Buckhurst Hill Station
-
Wood Street Station
-
Snaresbrook Station
-
Walthamstow Central Station
-
Chigwell Station
- FAQ
- Price Paid By Year
- Property Type Price
Frequently asked questions about Hatch Lane
What is the average price for a property for sale in Hatch Lane?
The average price for a property for sale in Hatch Lane is £513,987. This amount is 16% lower than the average price in Woodford Green. There are 1,239 property listings for sale in Hatch Lane.
What streets have the most expensive properties for sale in Hatch Lane?
The streets with the most expensive properties for sale in Hatch Lane are Lichfield Road at an average of £961,333, Marion Grove at an average of £862,500 and Keynsham Avenue at an average of £844,000.
What streets have the most affordable properties for sale in Hatch Lane?
The streets with the most affordable properties for sale in Hatch Lane are Chingford Lane at an average of £346,733, Mill Lane at an average of £478,600 and Montalt Road at an average of £490,075.
Which train stations are available in or near Hatch Lane?
Some of the train stations available in or near Hatch Lane are Highams Park, Chingford and Wood Street.
Which tube stations are available in or near Hatch Lane?
Some of the tube stations available in or near Hatch Lane are Woodford, Roding Valley and South Woodford.
Property Price Paid in Hatch Lane by Year
The average sold property price by year was:
| Year | Average Sold Price | Price Change |
Sold Properties
|
|---|---|---|---|
| 2025 | £426,656 | -43% |
16 Properties |
| 2024 | £608,955 | 24% |
20 Properties |
| 2023 | £461,431 | -21% |
29 Properties |
| 2022 | £558,426 | 29% |
23 Properties |
| 2021 | £394,714 | -5% |
18 Properties |
| 2020 | £412,913 | -22% |
29 Properties |
| 2019 | £504,000 | 16% |
26 Properties |
| 2018 | £421,839 | -8% |
28 Properties |
| 2017 | £456,861 | 11% |
21 Properties |
| 2016 | £404,706 | 7% |
25 Properties |
| 2015 | £377,730 | 14% |
38 Properties |
| 2014 | £324,649 | -5% |
41 Properties |
| 2013 | £341,942 | 5% |
33 Properties |
| 2012 | £323,879 | 10% |
25 Properties |
| 2011 | £292,807 | 5% |
26 Properties |
| 2010 | £278,545 | 7% |
26 Properties |
| 2009 | £260,159 | -1% |
22 Properties |
| 2008 | £262,652 | -4% |
23 Properties |
| 2007 | £272,340 | 4% |
35 Properties |
| 2006 | £260,460 | -0,2% |
38 Properties |
| 2005 | £261,031 | 19% |
32 Properties |
| 2004 | £212,678 | 12% |
32 Properties |
| 2003 | £187,723 | 2% |
38 Properties |
| 2002 | £184,345 | 9% |
55 Properties |
| 2001 | £167,610 | 18% |
36 Properties |
| 2000 | £138,099 | -2% |
32 Properties |
| 1999 | £140,442 | 36% |
28 Properties |
| 1998 | £89,431 | -2% |
25 Properties |
| 1997 | £91,098 | 0,2% |
35 Properties |
| 1996 | £90,925 | 17% |
21 Properties |
| 1995 | £75,540 | - |
34 Properties |
Property Price per Property Type in Hatch Lane
Here you can find historic sold price data in order to help with your property search.
The average Property Paid Price for specific property types in the last three years are:
| Property Type | Average Sold Price | Sold Properties |
|---|---|---|
| Semi Detached House | £783,458.00 | 24 Semi Detached Houses |
| Terraced House | £654,361.00 | 18 Terraced Houses |
| Flat | £287,145.00 | 44 Flats |
| Detached House | £1,007,500.00 | 2 Detached Houses |

